


1. 函数功能
在规则网格内的指定位置创建子区
2. 函数语法
matplotlib.pyplot.subplot2grid(shape, loc, rowspan=1, colspan=1, fig=None, **kwargs)
3. 函数参数与示例
| 参数 | 含义 |
|---|---|
| shape | (int, int) 网格布局 |
| loc | (int, int)绘制图形的位置,初始位置(0,0),表示第一行第一列 |
| rowspan | 整数,默认为1;图形跨越的行数 |
| colspan | 整数,默认为1;图形跨越的列数 |
| fig | 可选参数,放置subplot子图的画布,默认为当前画布 |
import matplotlib.pyplot as plt
import numpy as np
import matplotlib as mpl
mpl.rcParams['font.sans-serif'] = ['KaiTi']
mpl.rcParams['axes.unicode_minus'] = False
x = np.linspace(0, 8, 500)
y1 = x
y2 = np.sin(x)
y3 = np.power(x, 2)
y4 = np.cos(4 * x)
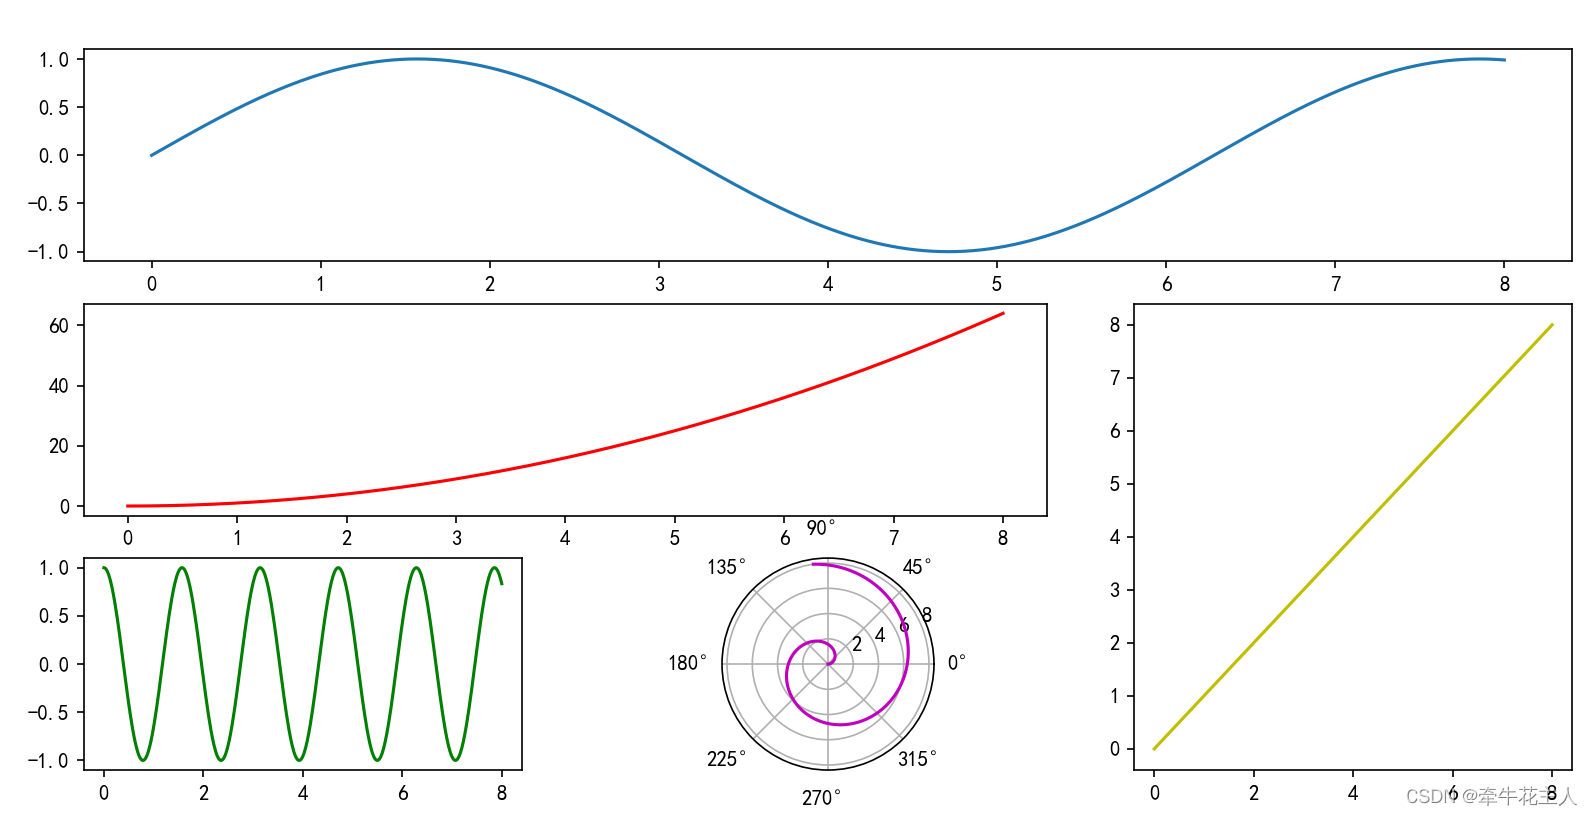
plt.subplot2grid(shape=(3, 3), loc=(0, 0), colspan=3)
plt.plot(x, y2)
plt.subplot2grid(shape=(3, 3), loc=(1, 0), colspan=2)
plt.plot(x, y3, c='r')
plt.subplot2grid(shape=(3, 3), loc=(1, 2), rowspan=2)
plt.plot(x, y1, c='y')
plt.subplot2grid(shape=(3, 3), loc=(2, 0), colspan=1)
plt.plot(x, y4, c='g')
plt.subplot2grid(shape=(3, 3), loc=(2, 1), colspan=1, polar=True)
plt.plot(x, y1, c='m')
plt.show()

4. 与subplot函数对比
上述跨区绘制的图形也可以通过subplot函数实现,代码如下。
import matplotlib.pyplot as plt
import numpy as np
import matplotlib as mpl

mpl.rcParams['font.sans-serif'] = ['KaiTi']
mpl.rcParams['axes.unicode_minus'] = False

x = np.linspace(0, 8, 500)
y1 = x
y2 = np.sin(x)
y3 = np.power(x, 2)
y4 = np.cos(4 * x)

plt.subplot(3, 3, (1, 3))
plt.plot(x, y2)
plt.subplot(3, 3, (4, 5))
plt.plot(x, y3, c='r')
plt.subplot(3, 3, (6, 9))
plt.plot(x, y1, c='y')
plt.subplot(3, 3, 7)
plt.plot(x, y4, c='g')
plt.subplot(3, 3, 8, polar=True)
plt.plot(x, y1, c='m')
plt.show()
目前来看subplot()与subplot2grid()函数均可以实现跨区绘制图形,只是subplot指定绘制位置的时候使用每个图形的索引(从1开始,从左向右增加);而subplot2gird()函数,运用位置索引(行、列索引均从0开始),然后指定横向和纵向跨区数量。对于划分行列较多的绘图subplot2grid()函数使用位置索引和跨越区域数量的方式会更方便。


 1323
1323


 被折叠的 条评论
为什么被折叠?
被折叠的 条评论
为什么被折叠?
 到【灌水乐园】发言


