


当前有效matplotlib版本为:3.4.1。
函数概述
subplot2grid函数的功能是在特定网格位置中添加一个子图。
函数的定义签名为:matplotlib.pyplot.subplot2grid(shape, loc, rowspan=1, colspan=1, fig=None, **kwargs)。
函数的调用签名为:
ax = subplot2grid((nrows, ncols), (row, col), rowspan, colspan)
函数的参数为:
shape:定义子图网格的行数和列数。整数二元组,(nrows, ncols)。loc:定义新增子图在子图网格中的位置(行、列索引)。整数二元组,(nrow, ncol)。rowspan:定义新增子图向下跨越的行数。可选参数。整数,默认值为1。colspan:定义新增子图向右跨越的列数。可选参数。整数,默认值为1。fig:用于设置添加子图的Figure对象。可选参数。Figure对象。默认值为当前Figure对象。subplot_kw:用于向创建子图时的底层函数~matplotlib.figure.Figure.add_subplot传递关键字参数。可选参数。字典。**kwargs:用于向~.Figure.add_subplot传递的关键字参数。可选参数。
函数的返回值为:
.axes.SubplotBase实例,或其他~.axes.Axes的子类实例。
函数原理
subplot2grid函数其实是fig.add_subplot方法的封装。源码为:
def subplot2grid(shape, loc, rowspan=1, colspan=1, fig=None, **kwargs):

    if fig is None:
        fig = gcf()

    rows, cols = shape
    gs = GridSpec._check_gridspec_exists(fig, rows, cols)

    subplotspec = gs.new_subplotspec(loc, rowspan=rowspan, colspan=colspan)
    ax = fig.add_subplot(subplotspec, **kwargs)
    bbox = ax.bbox
    axes_to_delete = []
    for other_ax in fig.axes:
        if other_ax == ax:
            continue
        if bbox.fully_overlaps(other_ax.bbox):
            axes_to_delete.append(other_ax)
    for ax_to_del in axes_to_delete:
        delaxes(ax_to_del)

    return ax
因此ax = subplot2grid((nrows, ncols), (row, col), rowspan, colspan)相当于
fig = gcf()
gs = fig.add_gridspec(nrows, ncols)
ax = fig.add_subplot(gs[row:row+rowspan, col:col+colspan])
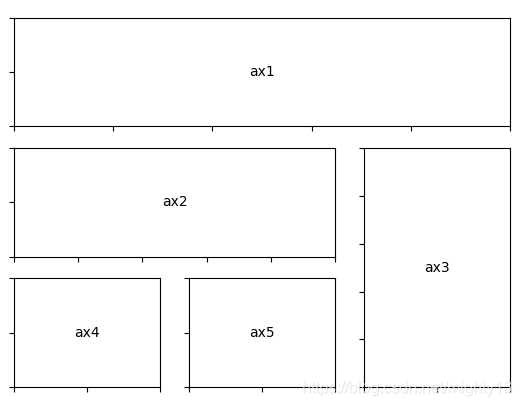
案例:简易应用
import matplotlib.pyplot as plt


def annotate_axes(fig):
    for i, ax in enumerate(fig.axes):
        ax.text(0.5, 0.5, "ax%d" % (i+1), va="center", ha="center")
        ax.tick_params(labelbottom=False, labelleft=False)


fig = plt.figure()
ax1 = plt.subplot2grid((3, 3), (0, 0), colspan=3)
ax2 = plt.subplot2grid((3, 3), (1, 0), colspan=2)
ax3 = plt.subplot2grid((3, 3), (1, 2), rowspan=2)
ax4 = plt.subplot2grid((3, 3), (2, 0))
ax5 = plt.subplot2grid((3, 3), (2, 1))

annotate_axes(fig)

plt.show()
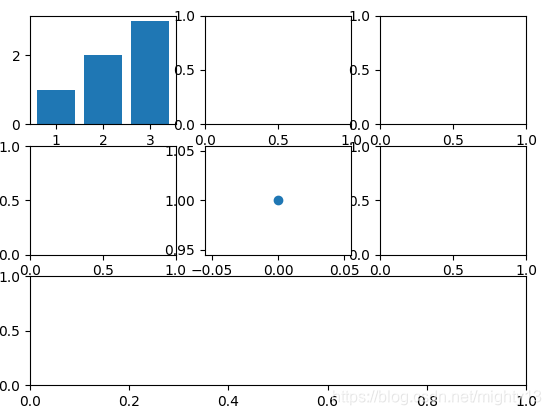
案例:混合应用subplot、subplots、subplot2grid函数
import matplotlib.pyplot as plt

# 添加3行3列子图9个子图
fig, axes = plt.subplots(3, 3)
# 为第1个子图绘制图形
axes[0, 0].bar(range(1, 4), range(1, 4))
# 使用subplot函数为第5个子图绘制图形
plt.subplot(335)
plt.plot(1,'o')
# 使用subplot2grid函数将第三行子图合并为1个
plt.subplot2grid((3,3),(2,0),colspan=3)
# 返回值为Axes对象列表,元素个数为7
print(fig.axes)
plt.show()
subplot、subplot2grid函数之间的比较
subplot函数和subplot2grid函数极其相似。
- 都可以向当前图像中添加一个子图。
- 返回值也都是一个
Axes实例。 - 都可以指定子图在子图网格中的位置。
不同之处在于指定子图网格中位置的方法,特别是不规则子图布局时。
subplot函数指定位置的方法相对比较隐晦,比如子图位置重叠时,隐含删除被覆盖子图。subplot2grid函数借助gridspec指定位置时相对清晰。
例如:
import matplotlib.pyplot as plt

# 绘制1行2列子图中的第1个子图
plt.subplot(121,facecolor='r')
# 绘制2行2列子图中的第2个子图
plt.subplot(222,facecolor='g')
# 绘制2行2列子图中的第4个子图
plt.subplot(224,facecolor='b')

plt.show()
等价于
import matplotlib.pyplot as plt

# 绘制1行2列子图中的第1个子图
plt.subplot2grid((2,2),(0,0),rowspan=2,facecolor='r')
# 绘制2行2列子图中的第2个子图
plt.subplot(222,facecolor='g')
# 绘制2行2列子图中的第4个子图
plt.subplot(224,facecolor='b')

plt.show()


 2226
2226


 被折叠的 条评论
为什么被折叠?
被折叠的 条评论
为什么被折叠?
 到【灌水乐园】发言


