


1.5. 对数或者其他非线性坐标轴
使用plt.xscal()来改变坐标轴的刻度
import numpy as np
import matplotlib.pyplot as plt
from matplotlib.ticker import NullFormatter # useful for `logit` scale
# Fixing random state for reproducibility
np.random.seed(19680801)
# make up some data in the interval ]0, 1[
y = np.random.normal(loc=0.5, scale=0.4, size=1000)
y = y[(y > 0) & (y < 1)]
y.sort()
x = np.arange(len(y))
# plot with various axes scales
plt.figure(1)
# linear
plt.subplot(221)
plt.plot(x, y)
plt.yscale('linear')
plt.title('linear')
plt.grid(True)
# log
plt.subplot(222)
plt.plot(x, y)
plt.yscale('log')
plt.title('log')
plt.grid(True)
# symmetric log
plt.subplot(223)
plt.plot(x, y - y.mean())
plt.yscale('symlog', linthreshy=0.01)
plt.title('symlog')
plt.grid(True)
# logit
plt.subplot(224)
plt.plot(x, y)
plt.yscale('logit')
plt.title('logit')
plt.grid(True)
# Format the minor tick labels of the y-axis into empty strings with
# `NullFormatter`, to avoid cumbering the axis with too many labels.
plt.gca().yaxis.set_minor_formatter(NullFormatter())
# Adjust the subplot layout, because the logit one may take more space
# than usual, due to y-tick labels like "1 - 10^{-3}"
plt.subplots_adjust(top=0.92, bottom=0.08, left=0.10, right=0.95, hspace=0.25,
wspace=0.35)
plt.show()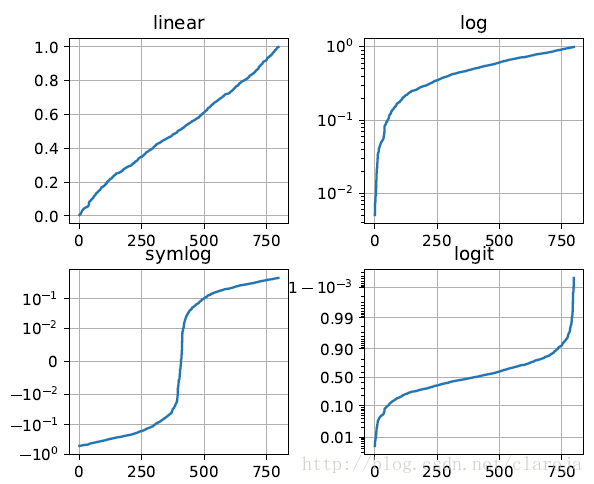


 5632
5632


 被折叠的 条评论
为什么被折叠?
被折叠的 条评论
为什么被折叠?
 到【灌水乐园】发言


