


目录
Node & Software & Docker Images Lists
Create ConfigMap and deployment
Expose the Logstash to Filebeats
Deploying Application and Sidecar-Filebeats
In this guide,I'll cover two methods to install ELK on Kubernetes.We will start by manually deploying individual components to Kubernetes and configuring which will give us a good understanding of how everything work.Then we will look at using Helm Charts that we define our configurtion with YAML files and deployed to Kubernetes just by one single comman.
Node & Software & Docker Images Lists
| HOSTNAME | IP | NODE TYPE | CONFIG |
| master1 | 192.168.1.100 | master | 4vCPU8G |
| Software Name | Version |
| kubeadm | v1.26.0 |
| kubectl | v1.26.0 |
| kubelet | v1.26.0 |
| cri-containerd-cni | 1.6.14 |
| Image Type | Version |
| k8s | registry.aliyuncs.com/google_containers/coredns:v1.9.3 registry.aliyuncs.com/google_containers/etcd:3.5.6-0 registry.aliyuncs.com/google_containers/kube-apiserver:v1.26.0 registry.aliyuncs.com/google_containers/kube-controller-manager:v1.26.0 registry.aliyuncs.com/google_containers/kube-proxy:v1.26.0 registry.aliyuncs.com/google_containers/kube-scheduler:v1.26.0 registry.aliyuncs.com/google_containers/pause:3.9 |
| calico | docker.io/calico/apiserver:v3.24.5 docker.io/calico/cni:v3.24.5 docker.io/calico/kube-controllers:v3.24.5 docker.io/calico/node:v3.24.5 docker.io/calico/pod2daemon-flexvol:v3.24.5 docker.io/calico/typha:v3.24.5 quay.io/tigera/operator:v1.28.5 |
| dashbord | docker.io/kubernetesui/dashboard:v2.7.1 |
| ELK+Filebeat | docker.io/library/elasticsearch:7.8.0 docker.io/library/kibana:7.8.0 docker.io/elastic/filebeat:7.8.0 |
| application | docker.io/sladesoftware/log-application:latest |
Prerequisites
Before we begin, there are a few things that you will need to make sure you have installed:
- Kubernetes Cluster
- Containerd
- Helm
If you haven't installed,you could refer to this guide:Install Kubernetes 1.26 on Centos 7.9(Contianerd as CRI )_JJH的创世纪的博客-CSDN博客
Install ELK Manually
Following below step to Install ELK manually. Please strictly follow the order of execution or you may fall into pits.
- Deploying ElasticSearch & Expose service
- Deploying Kibana & Expose service and accessing the Kibana UI
- Deploying Logstash & Expose the Logstash to Filebeats
- Deploying Application and Sidecar-Filebeats
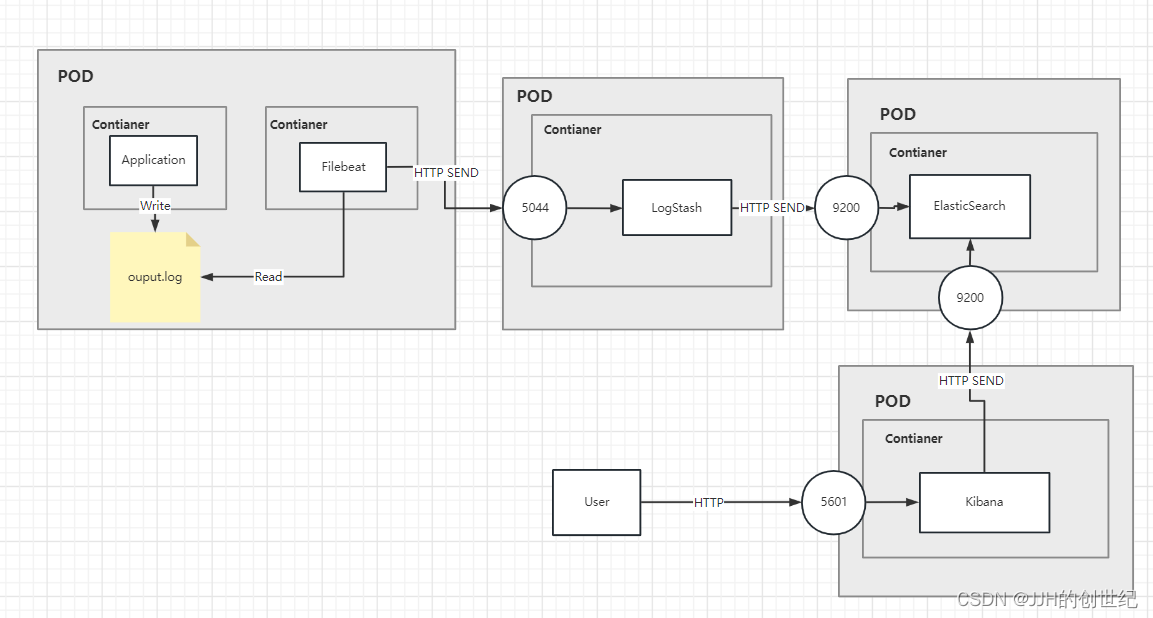
The below diagram show the architecture.As you can see, we deployed 4 pods and exposed LogStash, Kibana, ElasticSearch as services.
From left to right: Application generates logs, Filebeat collects it, sends it to LogStash via HTTP, processes it in LogStash and sends it to ElasticSearch via HTTP. Users can view all logs through Kibana.
Deploying ElasticSearch
Create deployment
First up, we need to deploy an Elasticsearch instance into our cluster.Normally, Elasticsearch would require 3 nodes to run within its own cluster.But in this guide,I'll show you how to configure Elasticsearch to run in single node mode.
Following below command to deploy Elasticsearch into our cluster.
kubectl create deployment es-single --image elasticsearch:7.8.0
Note: If you see a status of ContainerCreating on the Pod, then that is likely because kubectl is pulling the image still and this may take a few minutes. Wait until that is complete before proceeding.
Now we have a Deployment and Pod created. If you run the following commands, you can see those resources. And you will also see that the pod is failing to start and is restarted continuously.The STATUS is CrashLoopBackOff.
kubectl get deployments
[Output]
NAME        READY   UP-TO-DATE   AVAILABLE   AGE
es-manual   0/1     1            0          8s

kubectl get pods
[Output]
NAME                        READY  STATUS             RESTARTS    AGE
es-manual-d64d94fbc-dwwgz   0/1     CrashLoopBackOff   2          40s
For more information on the status of the Deployment or Pod, use the 'kubectl describe' or 'kubectl logs' commands:
kubectl describe deployment es-manual
[Output]
default            es-manual-b47f74c-b56wt                    0/1     CrashLoopBackOff   4 (47s ago)     8m40s

kubectl describe pod es-manual-d64d94fbc-dwwgz
[Output]
Events:
  Type     Reason     Age                  From               Message
  ----     ------     ----                 ----               -------
  Normal   Scheduled  7m58s                default-scheduler  Successfully assigned default/es-manual-b47f74c-b56wt to master1
  Normal   Pulling    7m57s                kubelet            Pulling image "elasticsearch:7.8.0"
  Normal   Pulled     2m33s                kubelet            Successfully pulled image "elasticsearch:7.8.0" in 5m24.865367602s (5m24.86537194s including waiting)
  Normal   Created    16s (x5 over 2m33s)  kubelet            Created container elasticsearch
  Normal   Started    16s (x5 over 2m32s)  kubelet            Started container elasticsearch
  Normal   Pulled     16s (x4 over 2m20s)  kubelet            Container image "elasticsearch:7.8.0" already present on machine
  Warning  BackOff    4s (x8 over 2m8s)    kubelet            Back-off restarting failed container elasticsearch in pod es-manual-b47f74c-b56wt_default(e9bb3793-6e1e-46f4-b812-11bcc44033bc

kubectl logs -f deployments/es-manual
[Output]
ERROR: [2] bootstrap checks failed
[1]: max virtual memory areas vm.max_map_count [65530] is too low, increase to at least [262144]
[2]: the default discovery settings are unsuitable for production use; at least one of [discovery.seed_hosts, discovery.seed_providers, cluster.initial_master_nodes] must be configured
ERROR: Elasticsearch did not exit normally - check the logs at /usr/share/elasticsearch/logs/docker-cluster.log
The error taken from the deployment logs that describes the reason for the failure.Ignore the frist item and we talk about the second.It's something about discovery strategy which i mentioned above.Since I don't have 3 servers configured now and the default strategy is required for 3 node.So we need change "discovery.type" as "single-node".We can run `kubectl edit` to edit Deployment manually.
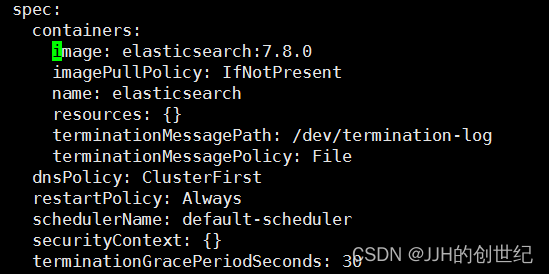
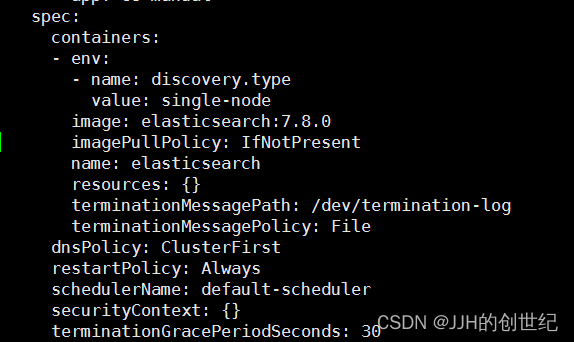
 kubectl edit deployment es-manual

- env:
  - name: discovery.type
    value: single-node
Before you edit,find the line of spec.containers and add it.
If you now look at the pods, you will see that the old Pod is being or has been terminated, and the new Pod (containing the new environment variable) will be created.Applying this change will cause the Pod created by the Deployment to be terminated, so that another Pod can be created in its place with the new environment variable.
kubectl get pods
[OUTPUT]
NAME                         READY   STATUS       RESTARTS    AGE
es-manual-b47f74c-b56wt      0/1     Terminating   6          10m
es-manual-8468bc99f6-l99xx   1/1     Running       0          20s
Expose deployment
Now that we have Elasticsearch running in our cluster, we need to expose it so that our other services can connect it. To do this, we will be using the `kubectl expose ` command . To briefly explain, this command will allow us to expose our Elasticsearch Deployment resource through a Service that will give us the ability to access our Elasticsearch HTTP API from other resources ( Logstash and Kibana). Run the following command to expose our Deployment:
kubectl expose deployment es-manual --type NodePort --port 9200This will have created a Kubernetes Service resource that exposes the port 9200 from our Elasticsearch Deployment resource: Elasticsearch’s HTTP port. This port will now be accessible through a port assigned in the cluster.
$ kubectl get services

[Output]
NAME         TYPE        CLUSTER-IP      EXTERNAL-IP   PORT(S)
es-manual    NodePort    10.96.114.186          9200:31110/TCP
kubernetes   ClusterIP  10.96.0.1               443/TCP
As you can see, our Elasticsearch HTTP port has been mapped to external port 31110(NodePort). We will use the LoaclHost IP address(NodeIP) and external port to check that our setup is working correctly.
[root@master1 ~]# curl http://192.168.1.100:31101
{
  "name" : "es-manual-8468bc99f6-l99xx",
  "cluster_name" : "docker-cluster",
  "cluster_uuid" : "_UDHGYTyS16m1V26Hnrs6w",
  "version" : {
    "number" : "7.8.0",
    "build_flavor" : "default",
    "build_type" : "docker",
    "build_hash" : "757314695644ea9a1dc2fecd26d1a43856725e65",
    "build_date" : "2020-06-14T19:35:50.234439Z",
    "build_snapshot" : false,
    "lucene_version" : "8.5.1",
    "minimum_wire_compatibility_version" : "6.8.0",
    "minimum_index_compatibility_version" : "6.0.0-beta1"
  },
  "tagline" : "You Know, for Search"
}
Deploying Kibana
Create deployment
Now that we have an Elasticsearch instance running and accessible via the Node IP and assigned port number, we will creater a Kibana instance and connect it to Elasticsearch. We will do this in the same way we have setup Elasticsearch: creating another Kubernetes Deployment resource.
kubectl create deployment kib-manual --image kibana:7.8.0Like with the Elasticsearch instance, our Kibana instance isn’t going to work straight away. The reason for this is that it doesn’t know where the Elasticsearch instance is running. By default, it will be trying to connect using the URL http://elasticsearch:9200. You can see this by checking in the logs for the Kibana pod.
kubectl get pod
[OUTPUT]
NAME                                 READY   STATUS    RESTARTS   AGE
es-manual-8468bc99f6-l99xx           1/1     Running   0          100m
kib-manual-99f4f9f89-mp2fh           1/1     Running   0          88m

kubectl logs -f kib-manual-99f4f9f89-mp2fh
[OUTPUT]
{"type":"log","@timestamp":"2023-05-22T13:56:49Z","tags":["warning","elasticsearch","admin"],"pid":7,"message":"Unable to revive connection: http://elasticsearch:9200/"}
The URL of the Elasticsearch instance is defined via an environment variable in the Kibana Docker Image, just like the mode for Elasticsearch. However, the actual key of the variable is ELASTICSEARCH_HOSTS, which contains all valid characters to use the kubectl command for changing an environment variable in a Deployment resource. Since we now know we can access Elasticsearch’s HTTP port via the http://NodeIP:NodePort(for me is http://192.168.1.100:31101), we can update Kibana Logstash to point to the Elasticsearch instance.
kubectl set env deployments/kib-manual ELASTICSEARCH_HOSTS=http://192.168.1.100:31101
[OUTPUT]
deployment.apps/kib-manual env updated
This will trigger a change in the deployment, which will result in the existing Kibana Pod being terminated, and a new Pod (with the new environment variable value) being spun up. If you run kubectl get pods again, you should be able to see this new Pod now. Again, if we check the logs of the new Pod, we should see that it has successfully connected to the Elasticsearch instance and is now hosting the web UI on port 5601.
kubectl logs -f kib-manual-99f4f9f89-mp2fh
[OUTPUT]
{"type":"log","@timestamp":"2023-05-22T14:00:02Z","tags":["listening","info"],"pid":7,"message":"Server running at http://0:5601"}
{"type":"log","@timestamp":"2023-05-22T14:00:02Z","tags":["info","http","server","Kibana"],"pid":7,"message":"http server running at http://0:5601"}
kubectl get services
NAME         TYPE        CLUSTER-IP      EXTERNAL-IP   PORT(S)          AGE
es-manual    NodePort    10.104.247.20   <none>        9200:31101/TCP   10m
kib-manual   NodePort    10.99.65.165    <none>        5601:32591/TCP   8s
kubernetes   ClusterIP   10.96.0.1       <none>        443/TCP          4d23h
Accessing the Kibana UI
Now that we have Kibana running and communicating with Elasticsearch, we need to access the web UI to allow us to configure and view logs. We have already seen that it is running on port 5601, but like with the Elasticsearch HTTP port, this is internal to the container running inside of the Pod. As such, we need to also expose this Deployment resource via a Service.
$ kubectl expose deployment kib-manual --type NodePort --port 5601

[Output]
service/kib-manual exposed
Then we should now be able to view the web UI via http://NodeIP:NodePort. Look at the new service to get the mapped port.
kubectl get services
NAME         TYPE        CLUSTER-IP      EXTERNAL-IP   PORT(S)          AGE
es-manual    NodePort    10.104.247.20   <none>        9200:31101/TCP   10m
kib-manual   NodePort    10.99.65.165    <none>        5601:32591/TCP   8s
kubernetes   ClusterIP   10.96.0.1       <none>        443/TCP          4d23h
Now navigate in the browser to the URL: http://192.168.1.100:32591/status to check that the web UI is running and Elasticsearch is connected properly.
Deploying Logstash
The next step is to get Logstash running within our setup. Logstash will operate as the tool that will collect logs from our application and send them through to Elasticsearch. It provides various benefits for filtering and re-formatting log messages, as well as collecting from various sources and outputting to various destinations. For this tutorial, we are only interested in using it as a pass-through log collector and forwarder.
In the above diagram, you can see our desired setup. We are aiming to deploy a Logstash container into a new Pod which listen on port 5044 for log entries being sent from a Filebeat which is looked like a sidecat and read the logs that application is writed . Those log messages will then be forwarded straight onto our Elasticsearch, Kibana, Logstash instance that we setup earlier, via the HTTP port that we have exposed.

Create ConfigMap and deployment
To achieve this setup, we are going to have to use the Kubernetes YAML files. The reason we need to use this here is that we need to configure a volume for our Logstash container to access, which is not possible through the CLI commands.
So, let’s begin – create a file called logstash.conf and enter the following:
input {
  beats {
    port => "5044"
  }
}

output {
  elasticsearch {
    hosts => ["http://192.168.1.100:31101"]
    index => "%{[@metadata][beat]}-%{[@metadata][version]}-%{+YYYY.MM.dd}"
  }
  stdout {
    codec => rubydebug
  }
}
Note: Replace the IP address and Port.The IP address you should replace to your Node IP,and about the Port you should run `kebectl get service` to find the Node Port of ElasticSearch.
Next, we need to create a new file called deployment.yml. Enter the following Kubernetes Deployment resource YAML contents to describe our Logstash Deployment.
---
kind: Deployment
apiVersion: apps/v1
metadata:
  name: log-manual
spec:
  replicas: 1
  selector:
    matchLabels:
      name: log-manual
  template:
    metadata:
      labels:
        name: log-manual
    spec:
      hostname: log-manual
      containers:
       - name: log-manual
         image: logstash:7.8.0
         ports:
         - containerPort: 5044
           name: filebeat
         volumeMounts:
         - name: log-manual-pipeline
           mountPath: /usr/share/logstash/pipeline/
         command:
          - logstash
      volumes:
       - name: log-manual-pipeline
         configMap:
          name: log-manual-pipeline
          items:
          - key: logstash.conf
            path: logstash.conf

---
Before we create the Deployment resource from this file, we need to create this ConfigMap. This volume will contain the logstash.conf file we have created, which will be mapped to the pipeline configuration folder within the Logstash container. This will be used to configure our required pass-through pipeline. So, run the following command:
kubectl create configmap log-manual-pipeline -f logstash.conf
[Output]
configmap/log-manual-pipeline created

kubectl create -f deployment.yml
[Output]
deployment.apps/log-manual created
To check that our Logstash instance is running properly, follow the logs from the newly created Pod.
$ kubectl get pods

[Output]
NAME                                 READY   STATUS    RESTARTS   AGE
es-manual-8468bc99f6-l99xx           1/1     Running   0          100m
kib-manual-99f4f9f89-mp2fh           1/1     Running   0          88m
log-manual-f5b865b8c-z6nbf           1/1     Running   0          48m


$ kubectl logs -f kib-manual-99f4f9f89-mp2fh

[Output]
[2023-05-22T14:43:37,025][INFO ][logstash.outputs.elasticsearch][main] Installing elasticsearch template to _template/logstash
[2023-05-22T14:43:37,789][INFO ][logstash.inputs.beats    ][main] Beats inputs: Starting input listener {:address=>"0.0.0.0:5044"}
[2023-05-22T14:43:37,802][INFO ][logstash.javapipeline    ][main] Pipeline started {"pipeline.id"=>"main"}
[2023-05-22T14:43:37,891][INFO ][logstash.agent           ] Pipelines running {:count=>1, :running_pipelines=>[:main], :non_running_pipelines=>[]}
[2023-05-22T14:43:37,909][INFO ][org.logstash.beats.Server][main][db8b1e3513250bbd55be5385fcbad17fbca1b38fa619191ca04f345e3ae4f846] Starting server on port: 5044
[2023-05-22T14:43:38,149][INFO ][logstash.agent           ] Successfully started Logstash API endpoint {:port=>9600}
[2023-05-22T14:46:35,257][ERROR][logstash.licensechecker.licensereader] Unable to retrieve license information from license server {:message=>"No Available connections"}Note: You may notice errors stating there are “No Available Connections” to the Elasticsearch instance endpoint with the URL http://elasticsearch:9200/. This comes from some default configuration within the Docker Image, but does not affect our pipeline, so can be ignored in this case.
[root@master1 filebeat]# kubectl get pod
NAME                                 READY   STATUS    RESTARTS   AGE
es-manual-8468bc99f6-l99xx           1/1     Running   0          100m
kib-manual-99f4f9f89-mp2fh           1/1     Running   0          88m
log-manual-f5b865b8c-z6nbf           1/1     Running   0          48m
logging-app-manual-d4f649876-q4kwq   2/2     Running   0          2m35s
Expose the Logstash to Filebeats
Now that Logstash is running and listening on container port 5044 and waitting for Filebeats log message entries. To achieve this, we need another Service resource to expose the port of Filebeats.
Run the following command to expose the Logstash Deployment through a Service resource.
$ kubectl expose deployment log-manual --type NodePort --port 5044

[Output]
service/log-manual exposed
Now check that the Service has been created and the port has been mapped properly.
kubectl get services
NAME         TYPE        CLUSTER-IP      EXTERNAL-IP   PORT(S)          AGE
es-manual    NodePort    10.104.247.20   <none>        9200:31101/TCP   10m
kib-manual   NodePort    10.99.65.165    <none>        5601:32591/TCP   5m
kubernetes   ClusterIP   10.96.0.1       <none>        443/TCP          4d23h
log-manual   NodePort    10.96.254.84    <none>        5044:31010/TCP   20s
As you can see, the container port 5044 has been mapped to port 31010 on the host. Now we can move onto the final step: configuring our application and a Sidecar Filebeats container to pump out log messages to be routed through our Logstash instance into Elasticsearch.
Deploying Application and Sidecar-Filebeats
Right, it’s time to setup the final component: our application. As I mentioned in the previous section, we will be using another Elastic Stack component called Filebeats, which will be used to monitor the log entries written by our application into a log file and then forward them onto Logstash.
There are a number of different ways we could structure this, but the approach I am going to walk through is by deploying both our application and the Filebeat instance as separate containers within the same Pod. We will then use a Kubernetes volume known as an Empty Directory to share access to the log file that the application will write to and Filebeats will read from. The reason for using this type of volume is that its lifecycle will be directly linked to the Pod. If you wish to persist the log data outside of the Pod, so that if the Pod is terminated and re-created the volume remains, then I would suggest looking at another volume type, such as the Local volume.
To begin with, we are going to create the configuration file for the Filebeats instance to use. Create a file named filebeat.yml and enter the following contents.
filebeat.inputs:
 - type: log
   paths:
    - /tmp/output.log

output:
  logstash:
    hosts: [ "192.168.1.100:31010" ]
This will tell Filebeat to monitor the file /tmp/output.log (which will be located within the shared volume) and then output all log messages to our Logstash instance (notice how we have used the IP address and port number for Minikube here).
kubectl create configmap beat-manual-config -f filebeat.yml

[Output]
configmap/beat-manual-config created
Next, we need to create our Pod with the double container setup. For this, similar to the last section, we are going to create a deployment.yml file. This file will describe our complete setup so we can build both containers together using a single command. Create the file with the following contents:
kind: Deployment
apiVersion: apps/v1
metadata:
  name: logging-app-manual
spec:
    replicas: 1
    selector:
      matchLabels:
        name: logging-app-manual
    template:
        metadata:
          labels:
            name: logging-app-manual
        spec:
          hostname: logging-app-manual
          containers:
            - name: beat-manual
              image: elastic/filebeat:7.8.0
              args: [
                "-c", "/etc/filebeat/filebeat.yml",
                "-e"
              ]
              volumeMounts:
                - name: beat-manual-config
                  mountPath: /etc/filebeat/
                - name: manual-log-directory
                  mountPath: /tmp/
            - name: logging-app-manual
              image: sladesoftware/log-application:latest
              volumeMounts:
                - name: manual-log-directory
                  mountPath: /tmp/
          volumes:
            - name: beat-manual-config
              configMap:
                name: beat-manual-config
                items:
                  - key: filebeat.yml
                    path: filebeat.yml
            - name: manual-log-directory
              emptyDir: {}
As we can see,both containers will share a folder mapped to the /tmp path, which is where the log file will be written to and read from. The Filebeat container will also use the ConfigMap volume that we have just created, which we have specified for the Filebeat instance to read the configuration file from; overwriting the default configuration.
You will also notice that our application container is using the Docker Image sladesoftware/log-application:latest. This is a simple Docker Image which runs an infinite loop command that appends a small JSON object to the output file every few seconds.
To create this Deployment resource, run the following command:
$ kubectl create -f deployment.yml
[Output]
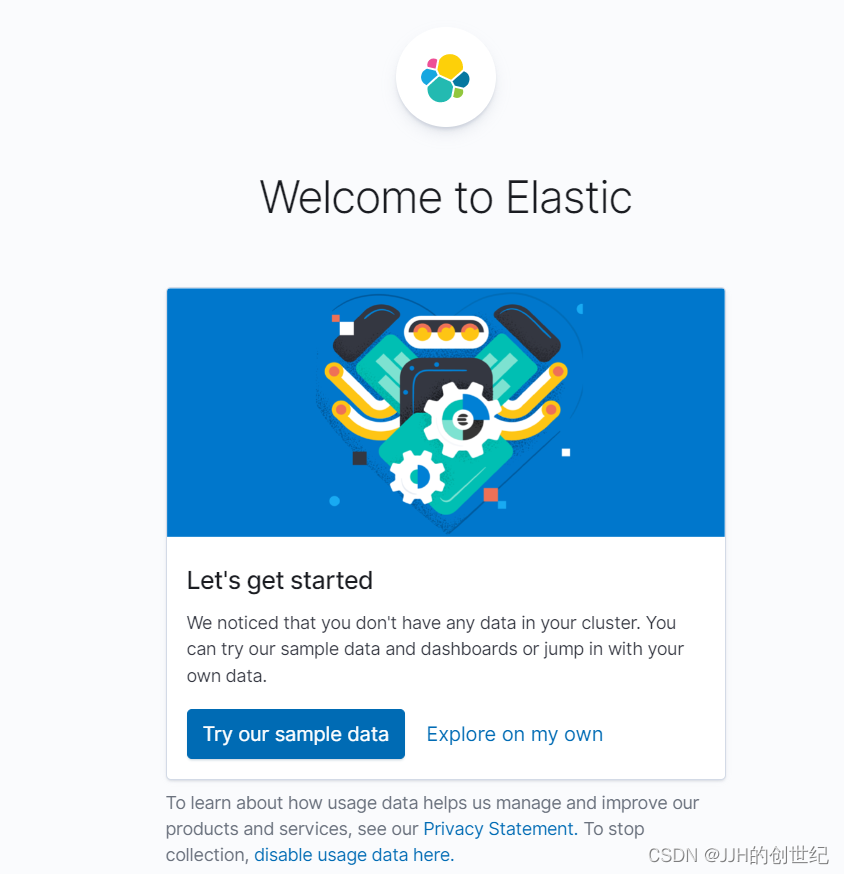
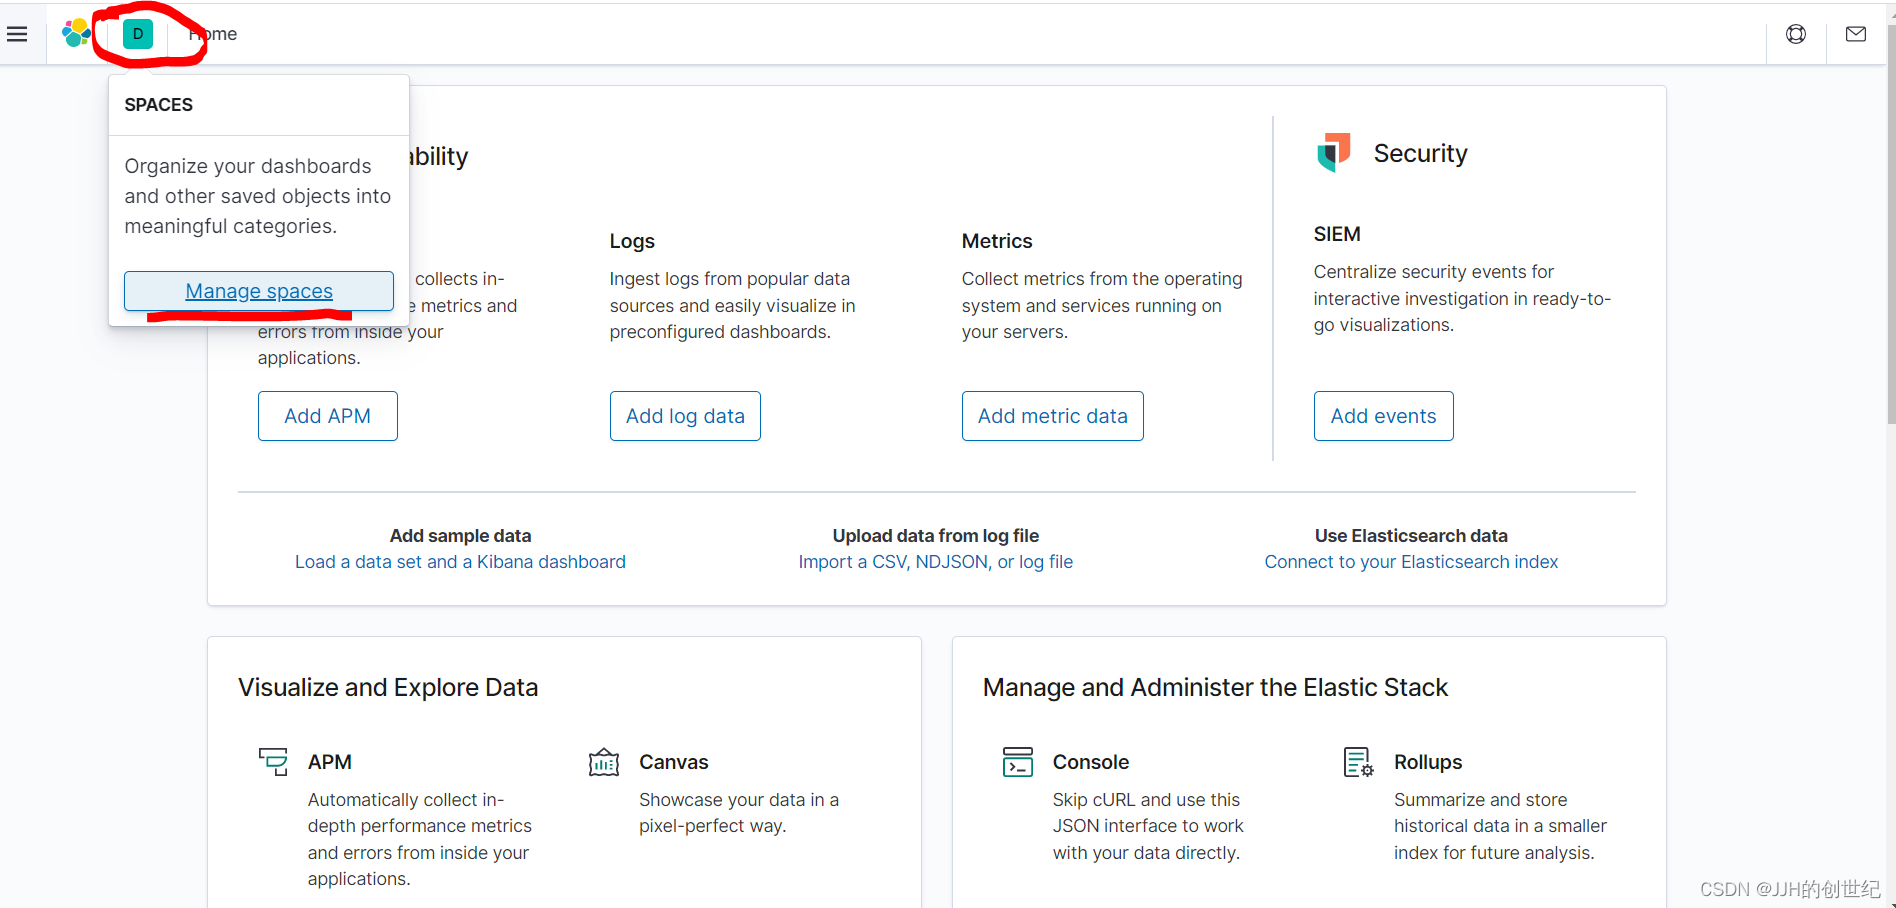
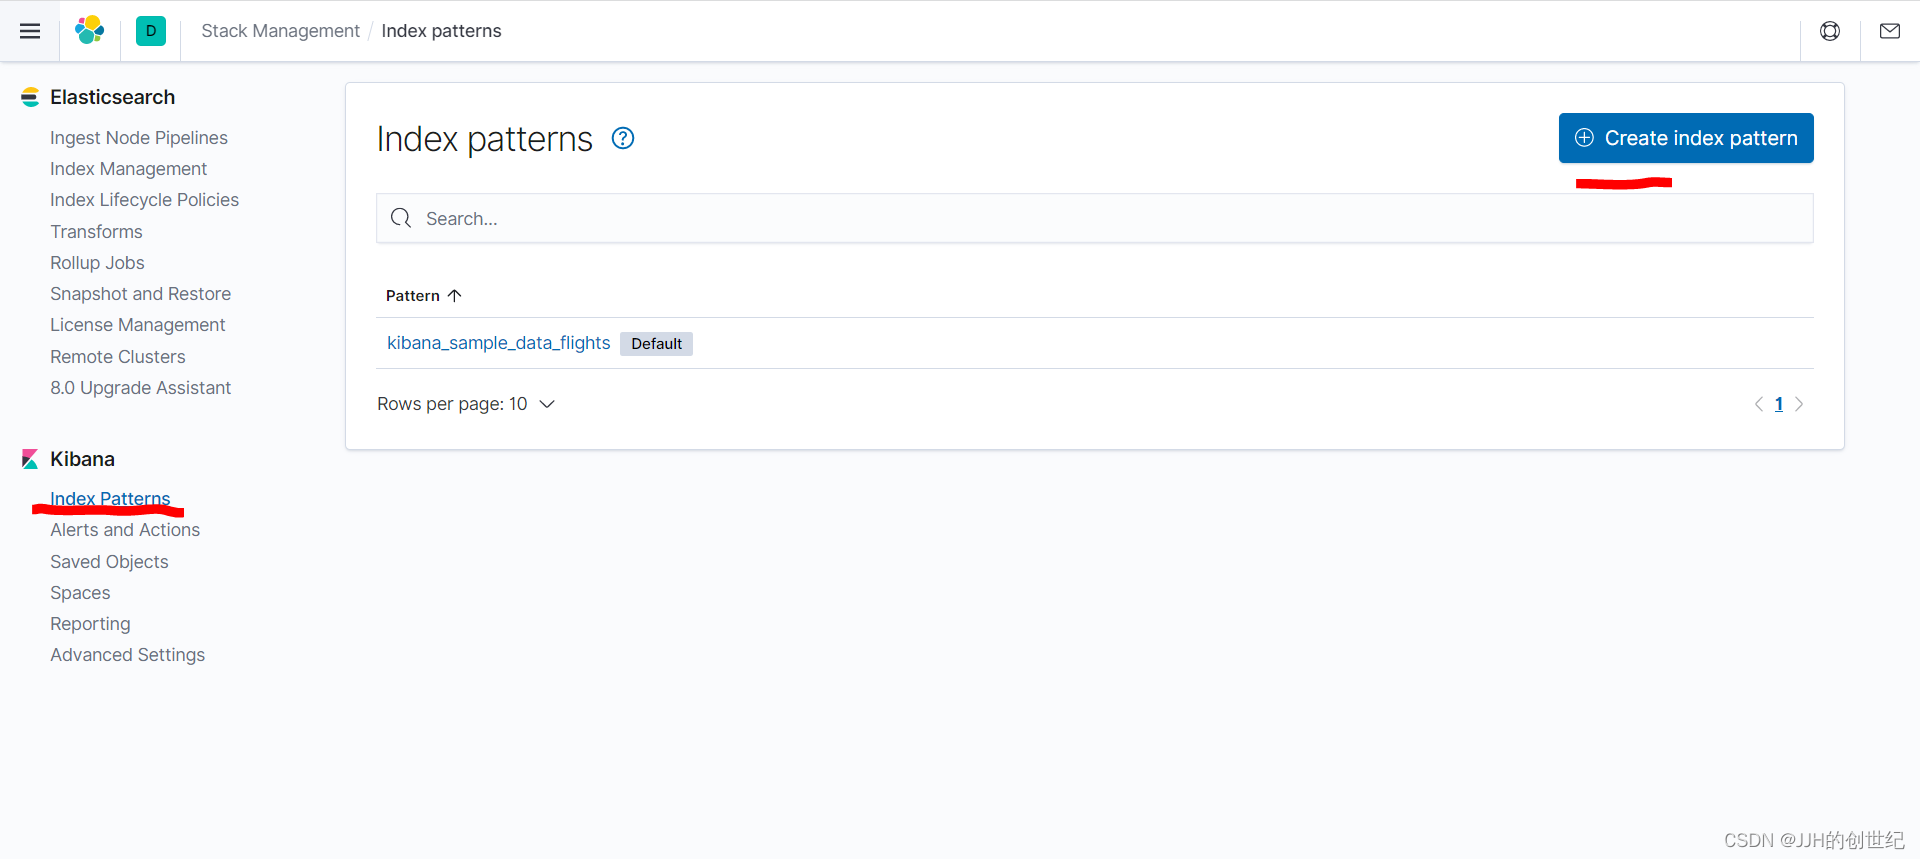
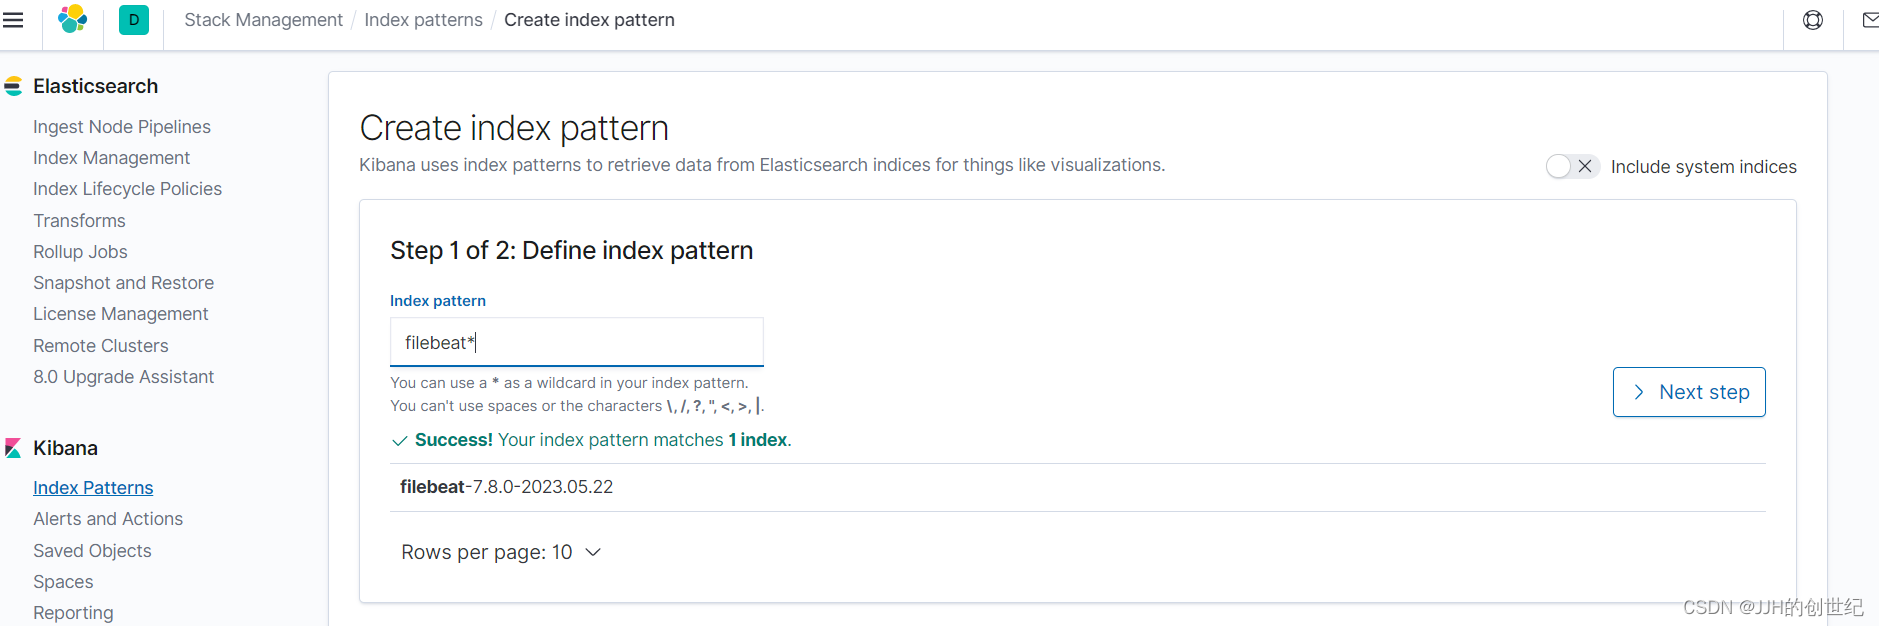
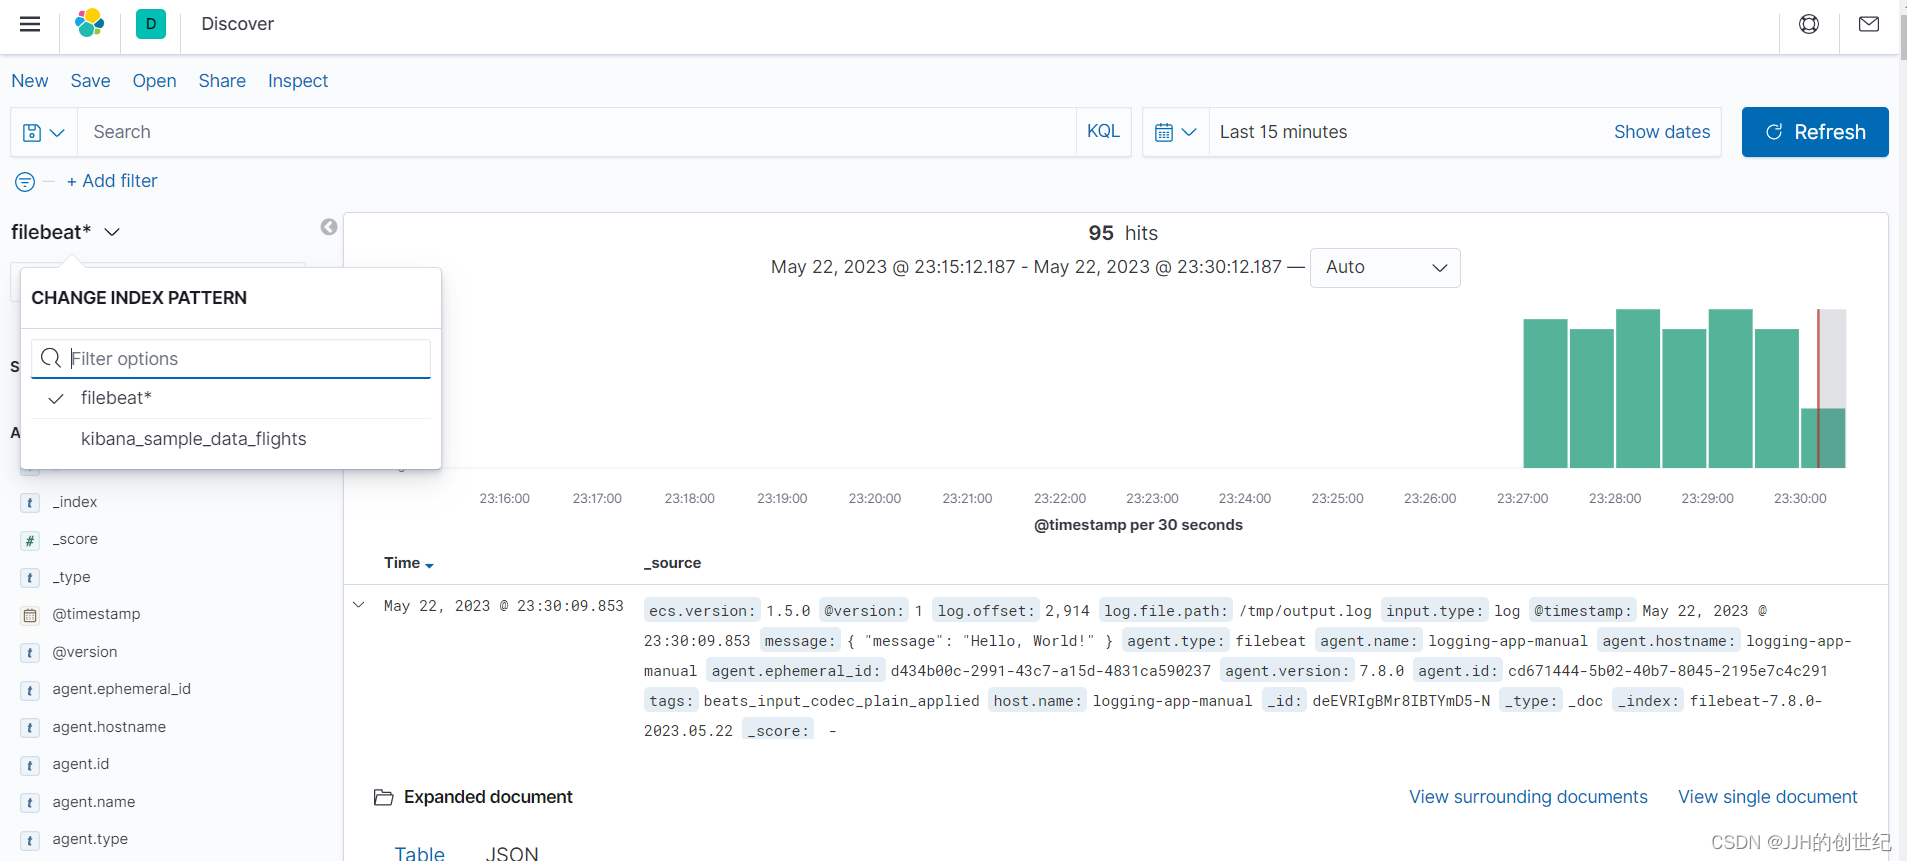
deployment.apps/logging-app-manual createdAnd that’s it! You should now be able to browse to the Kibana dashboard in your web browser to view the logs coming in. Make sure you first create an Index Pattern to read these logs – you should need a format like filebeat*.
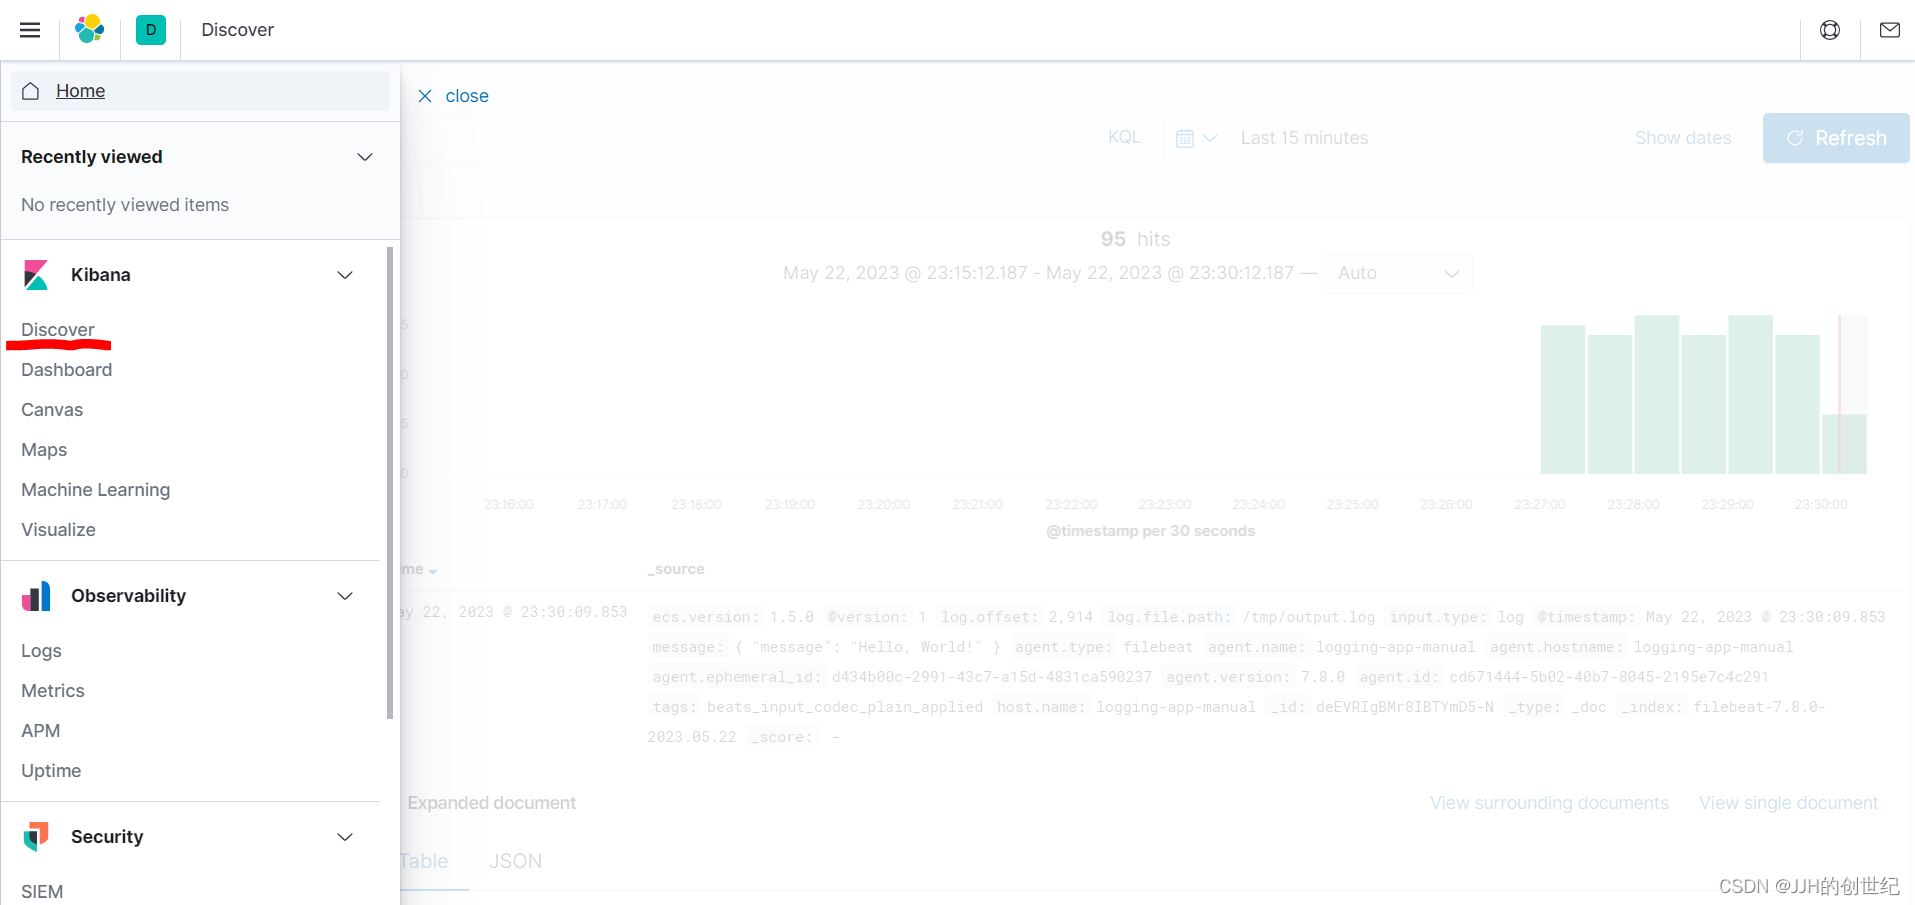
Once you have created this Index Pattern, you should be able to view the log messages as they come into Elasticsearch over on the Discover page of Kibana.
Following below photos:
Using Helm charts
If you have gone through the manual tutorial, you should now have a working Elastic Stack setup with an application outputting log messages that are collected and stored in Elasticsearch and viewable in Kibana. However, all of that was done through a series of commands using the Kubernetes CLI, and Kubernetes resource description files written in YAML. Which is all a bit tedious.
The aim of this section is to achieve the exact same Elastic Stack setup as before, only this time we will be using something called Helm. This is a technology built for making it easier to setup applications within a Kubernetes cluster. Using this approach, we will configure our setup configuration as a package known as a Helm Chart, and deploy our entire setup into Kubernetes with a single command!
I won’t go into a lot of detail here, as most of what will be included has already been discussed in the previous section. One point to mention is that Helm Charts are comprised of Templates. These templates are the same YAML files used to describe Kubernetes resources, with one exception: they can include the Helm template syntax, which allows us to pass through values from another file, and apply special conditions. We will only be using the syntax for value substitution here.
Let’s begin. Helm Charts take a specific folder structure. You can either use the Helm CLI to create a new Chart for you (by running the command helm create <NAME>), or you can set this up manually. Since the creation command also creates a load of example files that we aren’t going to need, we will go with the manual approach for now.
You can download all files throught Github:
GitHub - ck784101777/elk-helm-chart: elk-helm-chart
If you want to create Helm Chart by youself,following the below file structure:
tree elk-helm-chart/
elk-helm-chart/
├── Chart.yaml
├── filebeat.yaml
├── logstash.conf
├── templates
│   ├── elastisearch.yaml
│   ├── kibana.yaml
│   ├── logging-app-and-filebeat.yaml
│   └── logstash.yaml
└── values.yaml
Chart.yaml
This file defines the metadata for the Chart. Just a simply chart.yaml include some basis parameters.
apiVersion: v2
name: elk-auto
description: A Helm chart for Kubernetes
type: application
version: 0.1.0
filebeat.yml
This is the same Filebeat configuration file we used in the previous section. The only difference is that we have replaced the previously hard-coded Logstash URL with the environment variable: LOGSTASH_HOSTS. This will be set within the Filebeat template and resolved during Chart installation.
filebeat.inputs:
  - type: log
    paths:
      - /tmp/output.log

output:
  logstash:
    hosts: [ "${LOGSTASH_HOSTS}" ]
logstash.conf
This is the same Logstash configuration file we used previously. The only modification, is that we have replaced the previously hard-coded Elasticsearch URL with the environment variable: ELASTICSEARCH_HOSTS. This variable is set within the template file and will be resolved during Chart installation.
input {
  beats {
    port => "5044"
  }
}

output {
  elasticsearch {
    hosts => ["${ELASTICSEARCH_HOSTS}"]
    index => "%{[@metadata][beat]}-%{[@metadata][version]}-%{+YYYY.MM.dd}"
  }
  stdout {
    codec => rubydebug
  }
}
templates/elasticsearch.yaml
Here, we are creating 2 Kubernetes resources:
- A Deployment: set 1 replicas of Pod containing the Elasticsearch container replicas,and the discovery.type is still set to single-node mode.
- A Service: exposes the Elasticsearch port 9200,so Logstash and Kibana will use to communicate with Elasticsearch via HTTP
apiVersion: apps/v1
kind: Deployment
metadata:
  name: es-auto
  labels:
    name: es-auto
spec:
  replicas: 1
  selector:
    matchLabels:
      name: es-auto
  template:
    metadata:
      labels:
        name: es-auto
    spec:
      containers:
            - name: es-auto
              image: elasticsearch:7.8.0
              ports:
               - containerPort: 9200
                 name: http
              env:
               - name: discovery.type
                 value: single-node
---
apiVersion: v1
kind: Service
metadata:
  labels:
        name: es-auto
  name: es-auto
spec:
  selector:
    name: es-auto
  type: NodePort
  ports:
    - nodePort: {{ .Values.ports.elasticsearch }}
      port: 9200
      protocol: TCP
      targetPort: 9200
templates/kibana.yaml
Here, we are creating 2 Kubernetes resources:
- A Deployment:set 1 replicas of Pod containing the Kibana container; configured to point to our exposed Elasticsearch instance
- A Service: exposes the Kibana port 5601,so we can view the Kibana Dashboard via the web browser
apiVersion: apps/v1
kind: Deployment
metadata:
  name: kib-auto
  labels:
    name: kib-auto
spec:
  replicas: 1
  selector:
    matchLabels:
      name: kib-auto
  template:
    metadata:
      labels:
         name: kib-auto
    spec:
      containers:
        - name: kib-auto
          image: kibana:7.8.0
          ports:
             - containerPort: 5601
               name: http
          env:
            - name: ELASTICSEARCH_HOSTS
              value: http://{{ .Values.global.hostIp }}:{{ .Values.ports.elasticsearch }}
---
apiVersion: v1
kind: Service
metadata:
  name: kib-auto
  labels:
    name: kib-auto
spec:
  selector:
    name: kib-auto
  type: NodePort
  ports:
    - nodePort: {{ .Values.ports.kibana }}
      port: 5601
      protocol: TCP
      targetPort: 5601
templates/logging-app-and-filebeat.yaml
Here, we are creating 2 Kubernetes resources:
- A Deployment:set 1 replicas of Pod containing 2 containers: 1 for our application and another for Filebeat; Both there mount to /tmp/ directory,where is the output.log file will be written to from our application, and read from by Filebeat;And the Filebeat is configured to point to our exposed Logstash instance.
- A ConfigMap: containing the Filebeat configuration file
apiVersion: apps/v1
kind: Deployment
metadata:
  name: app-auto
  labels:
    name: app-auto
spec:
  replicas: 1
  selector:
    matchLabels:
      name: app-auto
  template:
    metadata:
      labels:
        name: app-auto
    spec:
      containers:
      - name: app-auto
        image: sladesoftware/log-application:latest
        volumeMounts:
         - name: log-output
           mountPath: /tmp/
      - name: beat-auto
        image: elastic/filebeat:7.8.0
        env:
         - name: LOGSTASH_HOSTS
           value: {{ .Values.global.hostIp }}:{{ .Values.ports.logstash }}
        args: [
           "-c", "/etc/filebeat/filebeat.yml",
           "-e"
         ]
        volumeMounts:
         - name: log-output
           mountPath: /tmp/
         - name: beat-config
           mountPath: /etc/filebeat/
      volumes:
       - name: log-output
         emptyDir: {}
       - name: beat-config
         configMap:
           name: beat-config
           items:
           - key: filebeat.yml
             path: filebeat.yml
---
apiVersion: v1
kind: ConfigMap
metadata:
  name: beat-config
data:
  filebeat.yml: |
{{ .Files.Get "filebeat.yml" | indent 4 }}
templates/logstash.yaml
Here, we can see that we have created 3 Kubernetes resources:
- A Deployment:set 1 replicas of Pod containing the Logstash container; configured to point to our exposed Elasticsearch instance
- A ConfigMap: containing the Logstash configuration file
- A Service: expose the Logstash port 5044 on the host so that Filebeat can access it via HTTP
apiVersion: apps/v1
kind: Deployment
metadata:
  name: log-auto
  labels:
    name: log-auto
spec:
  replicas: 1
  selector:
    matchLabels:
      name: log-auto
  template:
    metadata:
      labels:
        name: log-auto
    spec:
      containers:
        - name: log-auto
          image: logstash:7.8.0
          ports:
             - containerPort: 5044
               name: filebeat
          env:
             - name: ELASTICSEARCH_HOSTS
               value: http://{{ .Values.global.hostIp }}:{{ .Values.ports.elasticsearch }}
          volumeMounts:
             - name: log-auto-pipeline
               mountPath: /usr/share/logstash/pipeline/
          command:
             - logstash
      volumes:
        - name: log-auto-pipeline
          configMap:
            name: log-auto-pipeline
            items:
              - key: logstash.conf
                path: logstash.conf
---
apiVersion: v1
kind: ConfigMap
metadata:
  name: log-auto-pipeline
data:
  logstash.conf: |
{{ .Files.Get "logstash.conf" | indent 4 }}
---
apiVersion: v1
kind: Service
metadata:
  name: log-auto
  labels:
    name: log-auto
spec:
  selector:
    name: log-auto
  type: NodePort
  ports:
  - nodePort: {{ .Values.ports.logstash }}
    port: 5044
    protocol: TCP
    targetPort: 5044
values.yaml
This file contains the default values for all of the variables that are accessed in each of the template files. You can see that we have explicitly defined the ports we wish to map the container ports to on the host . The hostIp variable allows us to inject the Node IP when we install the Chart. You may take a different approach in production, but this satisfies the aim of this tutorial.
global:
  hostIp: 127.0.0.1

ports:
  elasticsearch: 31996
  kibana: 31997
  logstash: 31998
Now that you have created each of those files in the aforementioned folder structure, run the following Helm command to install this Chart into your Kubernetes cluster.
$ helm install elk-auto/ --set global.hostIp=$(Node ip)

[Output]
NAME: elk-auto
LAST DEPLOYED: Fri Jul 24 12:40:21 2020
NAMESPACE: default
STATUS: deployed
REVISION: 1
TEST SUITE: None
参考文档
Installing the Elastic Stack | Elastic Installation and Upgrade Guide [8.7] | Elastic


 2035
2035


 被折叠的 条评论
为什么被折叠?
被折叠的 条评论
为什么被折叠?
 到【灌水乐园】发言


