


下载loki promtail grafana
#loki promtail
https://github.com/grafana/loki/releases
#grafana
https://grafana.com/grafana/download?pg=get&plcmt=selfmanaged-box1-cta1
启动命令
./grafana-server web &
nohup /mnt/data/filebeat/filebeat -e > logs/stdout.log 2>&1 &
nohup ./loki-linux-amd64 -config.file=/mnt/loki-local-config.yaml > log-loki.file 2>&1 &
nohup ./promtail -config.file=/mnt/data/promtail-config.yaml > log-promtail.file 2>&1 &loki配置文件
auth_enabled: false
server:
http_listen_port: 8100
ingester:
lifecycler:
address: 127.0.0.1
ring:
kvstore:
store: inmemory
replication_factor: 1
final_sleep: 0s
chunk_idle_period: 5m
chunk_retain_period: 30s
max_transfer_retries: 0
schema_config:
configs:
- from: 2020-06-22
store: boltdb
object_store: filesystem
schema: v11
index:
prefix: index_
period: 168h
storage_config:
boltdb:
directory: /mnt/data/ELK/loki/data/index
filesystem:
directory: /mnt/data/ELK/loki/data/chunks
limits_config:
enforce_metric_name: false
reject_old_samples: true
reject_old_samples_max_age: 168h
chunk_store_config:
max_look_back_period: 0s
table_manager:
retention_deletes_enabled: true
retention_period: 336hpromtail配置文件
server:
http_listen_port: 9080
grpc_listen_port: 0
positions:
filename: /tmp/positions.yaml
clients:
- url: http://192.168.13.82:8100/loki/api/v1/push
scrape_configs:
- job_name: 28-home-log
static_configs:
- targets:
- localhost
labels:
job: 28-home-log
host: 192.168.13.28
env: prod
__path__: /mnt/data/iot-home/*/logs/*.log
- targets:
- 192.168.13.29
labels:
job: 29-home-log
host: 192.168.13.29
env: prod
__path__: /mnt/data/iot-home/*/logs/*.log
- targets:
- 192.168.13.29
labels:
job: 29-smart-log
host: 192.168.13.29
env: prod
__path__: /mnt/data/iot-smart/*/logs/*.log
- targets:
- 192.168.13.30
labels:
job: 30-smart-log
host: 192.168.13.30
env: prod
__path__: /mnt/data/iot-smart/*/logs/*.log
- targets:
- 192.168.13.42
labels:
job: 42-smart-log
host: 192.168.13.42
env: prod
__path__: /mnt/data/iot-smart/*/logs/*.log
- targets:
- 192.168.13.42
labels:
job: 42-home-log
host: 192.168.13.42
env: prod
__path__: /mnt/data/iot-home/*/logs/*.log
- targets:
- 192.168.13.75
labels:
job: 75-smart-log
host: 192.168.13.75
env: prod
__path__: /mnt/data/iot-smart/*/logs/*.log
- targets:
- 192.168.13.75
labels:
job: 75-home-log
host: 192.168.13.75
env: prod
__path__: /mnt/data/iot-home/*/logs/*.log
- targets:
- 192.168.13.77
labels:
job: 77-smart-log
host: 192.168.13.77
env: prod
__path__: /mnt/data/iot-smart/*/logs/*.log
- targets:
- 192.168.13.78
labels:
job: 78-home-log
host: 192.168.13.78
env: prod
__path__: /mnt/data/iot-home/*/logs/*.log
启停脚本
#!/bin/bash
start(){
pid=`ps -ef |grep promtail |grep -v grep |awk '{print $2}'`
if [ ! "$pid" ];then
nohup ./promtail -config.file=/mnt/data/promtail/promtail-config.yaml > promtail.log 2>&1 &
echo "Starting promtail success!"
else
echo "promtail is already start!"
echo -n "pid : $pid"
exit
fi
}
stop(){
echo -n $"Stopping promtail: "
pid=`ps -ef |grep promtail |grep -v grep |awk '{print $2}'`
if [ ! "$pid" ];then
echo "promtail is not running!"
else
echo "$pid"
kill $pid
echo "stop promtail success! pid : $pid"
fi
}
restart() {
stop
sleep 3s
start
}
status(){
pid=`ps -ef |grep promtail |grep -v grep |awk '{print $2}'`
if [ ! "$pid" ];then
echo "promtail is not running"
else
echo "promtail is running! pid: $pid"
fi
}
case "$1" in
start)
start
;;
stop)
stop
;;
restart)
restart
;;
status)
status
;;
*)
echo $"Usage: $0 {start|stop|restart|status}"
exit 1
esacgrafana配置
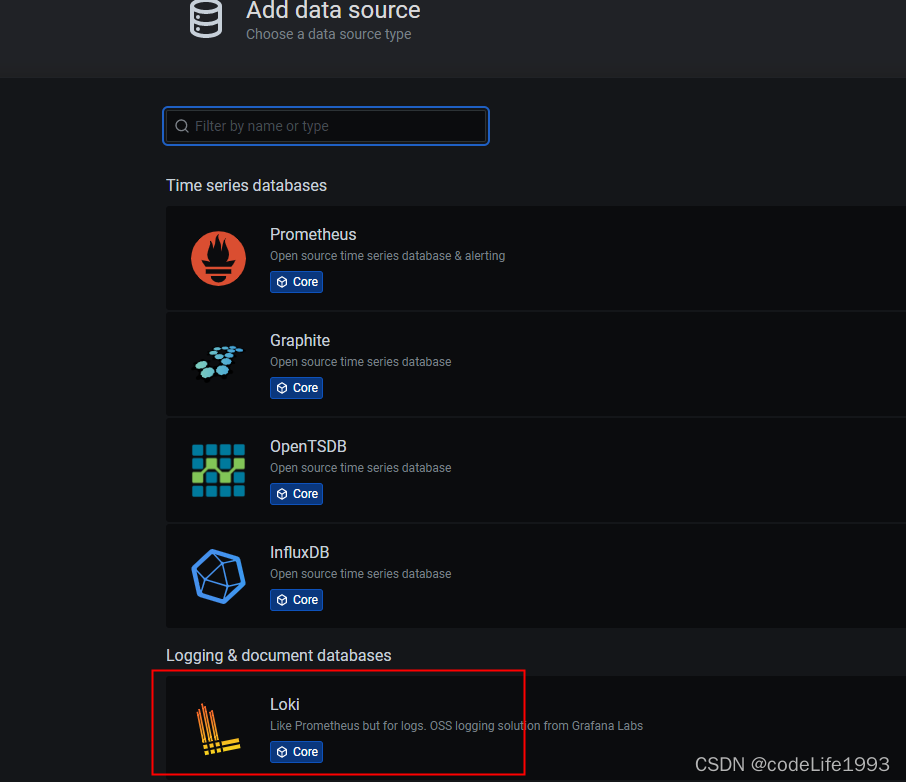
1.添加loki数据源
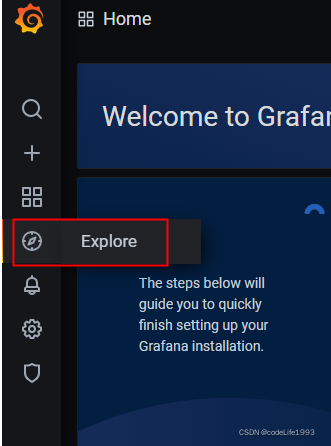
2.打开展示板 explore
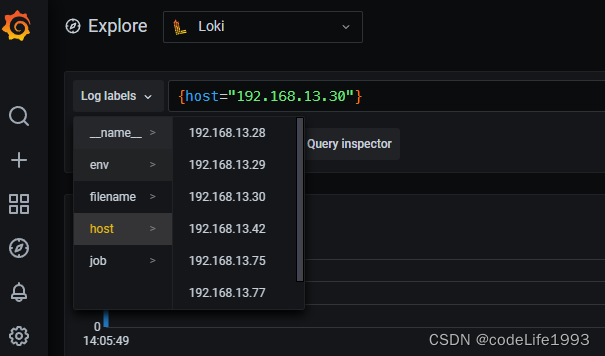
3.查看日志数据 选择标签 可以在配置文件自定义标签
4.查询语法

Loki Cheat Sheet See your logs Start by selecting a log stream from the Log labels selector. Alternatively, you can write a stream selector into the query field: {job="default/prometheus"} Combine stream selectors {app="cassandra",namespace="prod"} Returns all log lines from streams that have both labels. Filtering for search terms. {app="cassandra"} |~ "(duration|latency)s*(=|is|of)s*[d.]+" {app="cassandra"} |= "exact match" {app="cassandra"} != "do not match" LogQL supports exact and regular expression filters. Count over time count_over_time({job="mysql"}[5m]) This query counts all the log lines within the last five minutes for the MySQL job. Rate rate(({job="mysql"} |= "error" != "timeout")[10s]) This query gets the per-second rate of all non-timeout errors within the last ten seconds for the MySQL job. Aggregate, count, and group sum(count_over_time({job="mysql"}[5m])) by (level) Get the count of logs during the last five minutes, grouping by level


 6757
6757

 被折叠的 条评论
为什么被折叠?
被折叠的 条评论
为什么被折叠?
 到【灌水乐园】发言


