


3.1决策树的构造
3.1.1信息增益
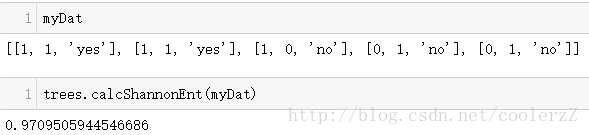
面对机器学习boss二代目——决策树,大多人应该不陌生,决策树的一些基本概念就不表了,下面直接贴上计算数据集的香农熵的代码:
from math import log

def calcShannonEnt(dataSet):
    numEntries = len(dataSet)
    labelCounts = {}
    for featVec in dataSet:
        currentLabel = featVec[-1]
        if currentLabel not in labelCounts.keys():
            labelCounts[currentLabel] = 0
        labelCounts[currentLabel] += 1
    shannonEnt = 0.0
    for key in labelCounts:
        prob = float(labelCounts[key])/numEntries
        shannonEnt -= prob * log(prob,2)
return shannonEntdef createDataSet():
dataSet = [[1,1,'yes'],
[1,1,'yes'],
[1,0,'no'],
[0,1,'no'],
[0,1,'no']]
labels = ['no surfacing','flippers']
return dataSet,labelsimport sys
sys.path.append('D:\xx\xxx')import trees
myDat,labels = trees.createDataSet()
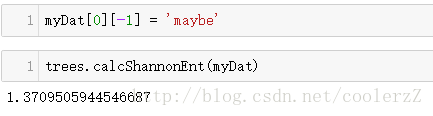
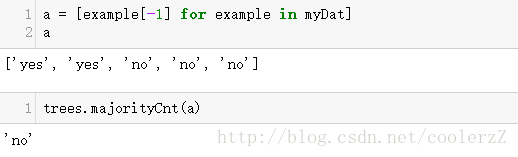
在数据集中添加分类,观察熵的变化:
3.1.2划分数据集
程序代码如下:
def splitDataSet(dataSet,axis,value):
    retDataSet = []
    for featVec in dataSet:
        if featVec[axis] == value:
            reducedFeatVec = featVec[:axis]
            reducedFeatVec.extend(featVec[axis + 1:])
            retDataSet.append(reducedFeatVec)
    return retDataSet
测试结果如下:

这个splitDataSet函数的作用就是根据axis位置上的value来划分数据集。
接下来将splitDataSet和calcShannonEnt函数结合起来,以此确定哪种数据集划分方式最好,代码如下:
def chooseBestFeatureToSplit(dataSet):
    numFeatures = len(dataSet[0]) - 1
    baseEntropy = calcShannonEnt(dataSet)
    bestInfoGain = 0.0; bestFeature = -1
    for i in range(numFeatures):
        featList = [example[i] for example in dataSet]
        uniqueVals = set(featList)
        newEntropy = 0.0
        for value in uniqueVals:
            subDataSet = splitDataSet(dataSet,i,value)
            prob = len(subDataSet)/float(len(dataSet))
            newEntropy += prob * calcShannonEnt(subDataSet)
        infoGain = baseEntropy - newEntropy
        if (infoGain > bestInfoGain):
            bestInfoGain = infoGain
            bestFeature = i
    return bestFeature
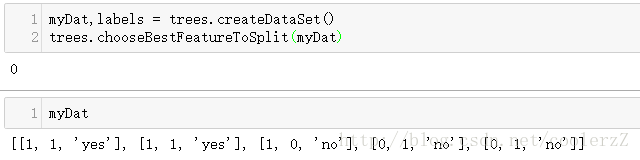
可见,将myDat的第0个特征作为划分数据集的特征最好。这段代码看起来很简单,可叹我绿豆大的脑容量,足足思考了两天才将这段代码和之前的代码结合起来,理解最终用途,真是惭愧 。
。
3.1.3 递归构建决策树
准备工作做完,现在开始最核心的部分,构建决策树。这里书上有一个划分数据集时的数据路径,初次看的时候没注意,回头再看这个图对理解后面代码很有帮助,整个代码的流程就是按照这个图来走的,所以还是要好好看图:
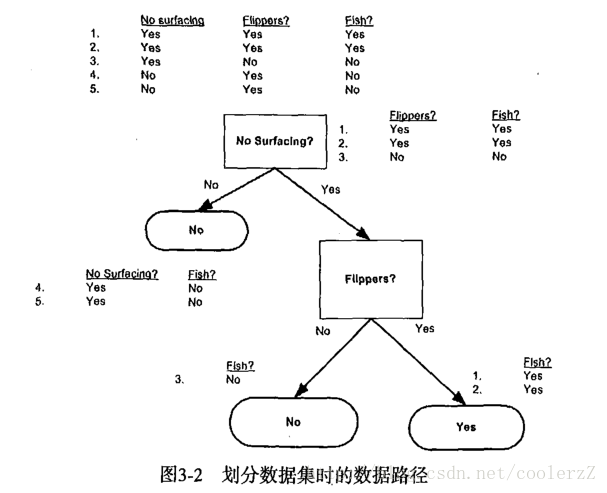
(看到这张图,第一感觉是自己就是鱼,被决策树这章炸的头昏脑胀,想到后面......不说了,这片池塘的水,我先干为敬,大家随意。)

接下来作者给到了一个majorityCnt的函数,如果你第一次读到这,你一定会像我一样懵,完全没有get到作者的意图,这个majorityCnt函数的作用得结合后面创建树的代码理解,先给出代码:
def majorityCnt(classList):
    classCount = {}
    for vote in classList:
        if vote not in classCount.keys():classCount[vote] = 0
        classCount[vote] += 1
    sortedClassCount = sorted(classCount.items(),\
                              key = operator.itemgetter(1),reverse = True)
    return sortedClassCount[0][0]
classList = [example[-1] for example in dataSet]
至于为什么这么处理,是因为”种树“过程中,作者说了:
if len(dataSet[0]) == 1
import operator最重要的”种树“代码:
def createTree(dataSet,labels):
    classList = [example[-1] for example in dataSet]
    if classList.count(classList[0]) == len(classList):
        return classList[0]
    if len(dataSet[0]) == 1:
        return majorityCnt(classList)
    bestFeat = chooseBestFeatureToSplit(dataSet)
    bestFeatLabel = labels[bestFeat]
    myTree = {bestFeatLabel:{}}
    subLabels = labels[:]
    del(subLabels[bestFeat])
    featValues = [example[bestFeat] for example in dataSet]
    uniqueVals = set(featValues)
    for value in uniqueVals:
        myTree[bestFeatLabel][value] = createTree(splitDataSet(dataSet, bestFeat, value),subLabels)
    return myTree
del(labels[bestFeat])
 subLabels = labels[:]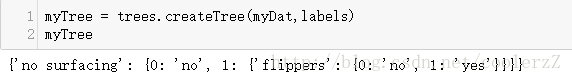
del(subLabels[bestFeat])测试下代码:
和原书上一样。
3.2 绘制树形图
3.2.1 Matplotlib 注解
直接贴代码:
import matplotlib.pyplot as plt

decisionNode = dict(boxstyle = 'sawtooth',fc = '0.8')
leafNode = dict(boxstyle = 'round4',fc = '0.8')
arrow_args = dict(arrowstyle = '<-')

def plotNode(nodeTxt,centerPt,parentPt,nodeType):
    createPlot.axl.annotate(nodeTxt,xy = parentPt,xycoords = 'axes fraction',\
                            xytext = centerPt,textcoords = 'axes fraction',\
                            va = 'center',ha = 'center',bbox = nodeType,arrowprops = arrow_args)


def createPlot():
    fig = plt.figure(1,facecolor = 'white')
    fig.clf()
    createPlot.axl = plt.subplot(111, frameon=False)
    plotNode('决策节点',(0.5,0.1),(0.1,0.5),decisionNode)
    plotNode('叶节点',(0.8,0.1),(0.3,0.8),leafNode)
    plt.show()
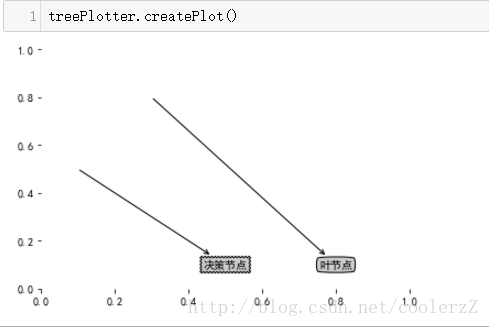
说实话,这段代码看不懂,照着敲的。可以看到图中的中文显示出错,这是由于默认字体中没有中文字体,措施是在treePlotter
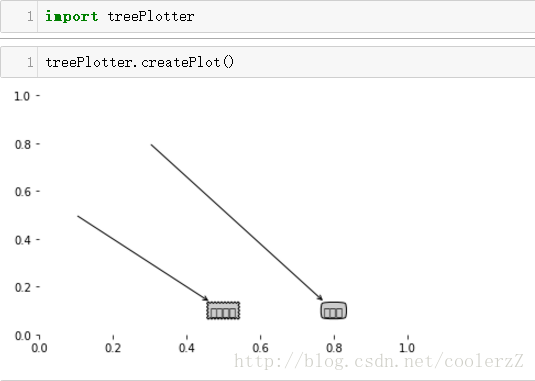
中添加以下代码:
from pylab import *
mpl.rcParams['font.sans-serif'] = ['SimHei']
3.2.2 构造注解树
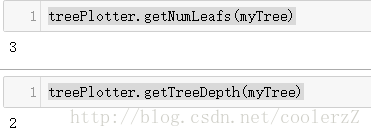
获取叶节点的数目和树的层数,代码:
def getNumLeafs(myTree):
    numLeafs = 0
    firstStr = myTree.keys()[0]
    secondDict = myTree[firstStr]
    for key in secondDict.keys():
        if type(secondDict[key]).__name__ == 'dict':
            numLeafs += getNumLeafs(secondDict[key])
        else:
            numLeafs += 1
    return numLeafs

def getTreeDepth(myTree):
    maxDepth = 0
    firstStr = myTree.keys()[0]
    secondDict = myTree[firstStr]
    for key in secondDict.keys():
        if type(secondDict[key]).__name__ == 'dict':
            thisDepth = 1 + getTreeDepth(secondDict[key])
        else:
            thisDepth = 1
        if thisDepth > maxDepth: maxDepth = thisDepth
return maxDepth原书作者为了节省大家的时间,在treePlotter.py中定义一个retrieveTree的函数来输出预先存储的额树信息,代码如下:
def retrieveTree(i):
    listOfTrees = [{'no surfacing': {0:'no',1:{'flippers': \
                                                   {0:'no',1:'yes'}}}},
                   {'no surfacing': {0:'no',1:{'flippers':\
                                                   {0:{'head':{0:'no',1:'yes'}},\
                                                    1:'no'}}}}
                   ]
return listOfTrees[i]myTree = treePlotter.retrieveTree(0)
treePlotter.getNumLeafs(myTree)
treePlotter.getTreeDepth(myTree) .......错误原因是:'dict_keys' object does not support indexing
 ,好吧好吧,多亏了@
chienchia 的普及:
在python2.x中,dict.keys()返回一个列表,在python3.x中,dict.keys()返回一个dict_keys对象,比起列表,这个对象的行为更像是set,所以不支持索引的。
,好吧好吧,多亏了@
chienchia 的普及:
在python2.x中,dict.keys()返回一个列表,在python3.x中,dict.keys()返回一个dict_keys对象,比起列表,这个对象的行为更像是set,所以不支持索引的。
解决方案:list(dict.keys())[index]
so,将获取叶节点数目和树的层数的代码更改为:
def getNumLeafs(myTree):
    numLeafs = 0
    firstStr = list(myTree.keys())[0]#修改行
    secondDict = myTree[firstStr]
    for key in secondDict.keys():
        if type(secondDict[key]).__name__ == 'dict':
            numLeafs += getNumLeafs(secondDict[key])
        else:
            numLeafs += 1
    return numLeafs

def getTreeDepth(myTree):
    maxDepth = 0
    firstStr = list(myTree.keys())[0] #修改行
    secondDict = myTree[firstStr]
    for key in secondDict.keys():
        if type(secondDict[key]).__name__ == 'dict':
            thisDepth = 1 + getTreeDepth(secondDict[key])
        else:
            thisDepth = 1
        if thisDepth > maxDepth: maxDepth = thisDepth
    return maxDepth
画图的的准备工作做完了,下面更新画图这部分的代码:
def plotMidText(cntrPt, parentPt, txtString):
    xMid = (parentPt[0] - cntrPt[0]) / 2.0 + cntrPt[0]
    yMid = (parentPt[1] - cntrPt[1]) / 2.0 + cntrPt[1]
    createPlot.axl.text(xMid,yMid,txtString)

def plotTree(myTree,parentPt,nodeTxt):
    numLeafs = getNumLeafs(myTree)
    depth = getTreeDepth(myTree)
    firstStr = list(myTree.keys())[0]
    cntrPt = (plotTree.xOff + (1.0 + float(numLeafs))/2.0/plotTree.totalW,\
              plotTree.yOff)
    plotMidText(cntrPt,parentPt,nodeTxt)
    plotNode(firstStr, cntrPt,parentPt,decisionNode)
    secondDict = myTree[firstStr]
    plotTree.yOff = plotTree.yOff - 1.0/plotTree.totalD
    for key in secondDict.keys():
        if type(secondDict[key]).__name__ == 'dict':
            plotTree(secondDict[key],cntrPt,str(key))
        else:
            plotTree.xOff = plotTree.xOff + 1.0/plotTree.totalW
            plotNode(secondDict[key],(plotTree.xOff,plotTree.yOff),\
                     cntrPt,leafNode)
            plotMidText((plotTree.xOff,plotTree.yOff),cntrPt,str(key))
    plotTree.yOff = plotTree.yOff + 1.0/plotTree.totalD

def createPlot(inTree):
    fig = plt.figure(1,facecolor='white')
    fig.clf()
    axprops = dict(xticks = [],yticks = [])
    createPlot.axl = plt.subplot(111,frameon = False, **axprops)
    plotTree.totalW = float(getNumLeafs(inTree))
    plotTree.totalD = float(getTreeDepth(inTree))
    plotTree.xOff = -0.5/plotTree.totalW
    plotTree.yOff = 1.0
    plotTree(inTree,(0.5,1.0),' ')
    plt.show()

3.3测试和存储分类器
3.3.1测试算法:使用决策树执行分类(这块的东西没看懂,不知道这块的处理目的是什么)
代码:
def classify(inpuTree,featLabels,testVec):
    firstStr = list(inputTree.keys())[0]
    secondDict = inpuTree[firstStr]
    featIndex = featLabels.index(firstStr)
    for key in secondDict.keys():
        if testVec[featIndex] == key:
            if type(secondDict[key]).__name__ == 'dict':
                classLabel = classify(secondDict[key],featLabels,testVec)
            else:
                classLabel = secondDict[key]
    return classLabel
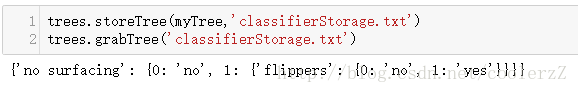
3.3.2使用算法:决策树的存储

这段代码基本上与原书一样,但是个别位置需要修改,否则程序会报错
代码如下:
def storeTree(inputTree,filename):
    import pickle
    fw = open(filename,'wb')
    pickle.dump(inputTree,fw)
    fw.close()

def grabTree(filename):
    import pickle
    fr = open(filename,'rb')
    return pickle.load(fr)
3.4 示例:使用决策树预测隐形眼镜类型
照旧敲代码:
import os
os.chdir('D:\xx\xx\MLiA_SourceCode')
os.listdir()

fr = open('lenses.txt')
lenses = [inst.strip().split('\t') for inst in fr.readlines()]
lensesLabels = ['age','prescript','astigmatic','tearRate']
lensesTree = trees.createTree(lenses,lensesLabels)
lensesTree
treePlotter.createPlot(lensesTree)
结果看起来挺像回事的。

我提一些自己的想法:
首先来看看lenses.txt文件的样子:
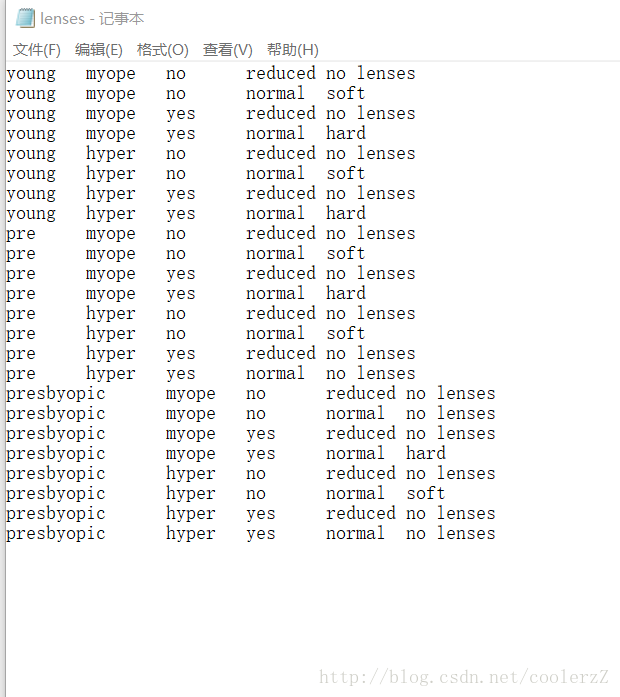
再回过头看看作者代码,代码都是针对具体数据结构写的,所以在具体现实决策树应用中,难点之一就是准备数据这一步骤。如何针对具体数据对代码进行优化,实际上需要丰富的经验。


 356
356

 被折叠的 条评论
为什么被折叠?
被折叠的 条评论
为什么被折叠?
 到【灌水乐园】发言


