


wordpress优化
P3 (Plugin Performance Profiler) is an extremely handy free WordPress plugin. It captures information on all of the plugins installed on your WordPress website, and then it measures, reports on, and visualizes their impact on the loading time of your site.
P3( Plugin Performance Profiler )是一个非常方便的免费WordPress插件。 它捕获有关您WordPress网站上安装的所有插件的信息,然后对其进行测量,报告并可视化它们对您网站加载时间的影响。
While the WordPress Plugin Directory is one of the biggest assets to the WordPress community, the truth is that some plugins can negatively impact the performance of your site. Plugins that are improperly configured, misused or poorly developed can hurt your site and, in some cases, slow it down to a snail’s pace. Luckily, P3 can quickly and easily pinpoint WordPress performance issues, help you test ways to make your site faster, and troubleshoot problematic plugins.
尽管WordPress插件目录是WordPress社区最大的资产之一,但事实是某些插件可能会对您网站的性能产生负面影响。 配置不当,使用不当或开发不当的插件会伤害您的网站,在某些情况下,它会降低蜗牛的速度。 幸运的是,P3可以快速,轻松地找出WordPress性能问题,帮助您测试使网站速度更快的方法以及对有问题的插件进行故障排除。
As web professionals, we are constantly faced with the challenge of optimizing a growing range of technologies, including richer content, and media designed for various devices and higher resolutions. As we strive to meet these challenges, performance (and performance monitoring tools like P3) become increasingly important.
作为网络专业人士,我们始终面临着优化不断增长的技术范围(包括更丰富的内容以及针对各种设备和更高分辨率设计的媒体)的挑战。 随着我们努力应对这些挑战,性能(以及性能监控工具,如P3)变得越来越重要。
关于P3 (About P3)
P3 was developed by Kurt Payne, a PHP developer at GoDaddy and a WordPress core contributor. P3 has been downloaded 266,502 times (as at the time of writing). It has a 4.6 star rating, was last updated just a week ago, and 14 out of 15 support threads have been resolved in the last two months.
P3是由GoDaddyPHP开发人员和WordPress核心贡献者Kurt Payne开发的。 P3已被下载266,502次(截至撰写时)。 它的评分为4.6星,最近一次更新是在一周前,过去15个月中解决了15个支持线程中的14个。
P3 works by monitoring the PHP function calls that WordPress makes when serving pages. It’s packed with an assortment of useful features, and deserves a place in the toolbox of every WordPress user and developer.
P3通过监视WordPress在提供页面时进行PHP函数调用来工作。 它包含各种有用的功能,并且在每个WordPress用户和开发人员的工具箱中都应有位置。
如何安装P3 (How to Install P3)
P3 is simple to install: use the same process as you would for any other WordPress plugin:
P3易于安装:使用与其他任何WordPress插件相同的过程:
- Open your WordPress Dashboard 打开您的WordPress仪表板
- Click on Plugins 点击插件
- Click on Add New 点击添加新
- Enter P3 into the search box 在搜索框中输入P3
- Click on Install Now on the P3 Plugin Performance Profiler result 在“ P3插件性能分析器”结果上单击“立即安装”
- Activate P3 激活P3
You can also manually download the P3 plugin here
Once P3 is installed and activated, you will be greeted with something that looks like this:
一旦安装并激活了P3,您将会收到类似以下内容的信息:

执行扫描 (Performing a Scan)
To perform a scan, all you need to do is click on the ‘Start Scan’ button. You will then be presented with two options:
要执行扫描,您所需要做的就是单击“开始扫描”按钮。 然后,您将看到两个选择:
Auto Scan: this option runs an automated scan of your website.
自动扫描 :此选项可对您的网站进行自动扫描。
Manual Scan: this option allows you to browse selected pages within your website, undertake your own performance testing, and stop the test at any time you like.
手动扫描 :此选项使您可以浏览网站中的选定页面,进行自己的性能测试,并在需要时随时停止测试。
自动扫描 (Auto Scan)
This is a quick and easy, simple option. Most of the time, an auto scan will detect any nasty issues. The downside to this type of scan is that it treats you as logged in, which may not be ideal.
这是一个快速,容易,简单的选择。 在大多数情况下,自动扫描会检测到任何令人讨厌的问题。 这种扫描的不利之处在于会将您视为已登录,这可能不是理想的选择。
手动扫描 (Manual Scan)
This option gives you much greater control on what you’re testing. Once you’ve selected the Manual Scan option, all you need to do is visit your site and, provided that you’re visiting from your IP address, P3 will start collecting data.
该选项使您可以更好地控制要测试的内容。 一旦选择了“手动扫描”选项,您要做的就是访问您的站点,并且只要您从IP地址访问,P3将开始收集数据。
It’s worth mentioning that you might want to open another browser or an Incognito tab/window and browse your site from there. This way, you can test your site as a regular user, not as a user logged into the Dashboard.
值得一提的是,您可能想打开其他浏览器或“隐身”标签/窗口,然后从那里浏览您的网站。 这样,您可以以普通用户(而不是以登录到仪表板的用户)测试站点。
There is an option (under Advanced Settings) to configure this IP address (or additional IP addresses). However, by default, this is set to your IP address.
(在“高级设置”下)有一个选项可配置此IP地址(或其他IP地址)。 但是,默认情况下,它设置为您的IP地址。
扫描特定页面 (Scanning Specific Pages)
You can also configure P3 to scan specific pages only. This is particularly useful if you’re troubleshooting one area of your site, like a shopping cart or an image gallery.
您也可以将P3配置为仅扫描特定页面。 如果您要对网站的某个区域(例如购物车或图片库)进行故障排除,则此功能特别有用。
To specify URLs to scan, add the following to your functions.php located in your theme directory.
要指定要扫描的URL,请将以下内容添加到位于主题目录中的functions.php中。
function my_p3_auto_scan_pages() {
    return array(
        'http://www.example.com/',
        'http://www.example.com/foo/',
        'http://www.example.com/foo/bar/',
    );
}
add_filter( 'p3_automatic_scan_urls', 'my_p3_auto_scan_pages' );
扫描结果 (Scan Results)
The results generated by P3 are very straightforward and presented quite intuitively. The image below shows the results of a scan.
P3生成的结果非常简单,而且直观直观。 下图显示了扫描结果。
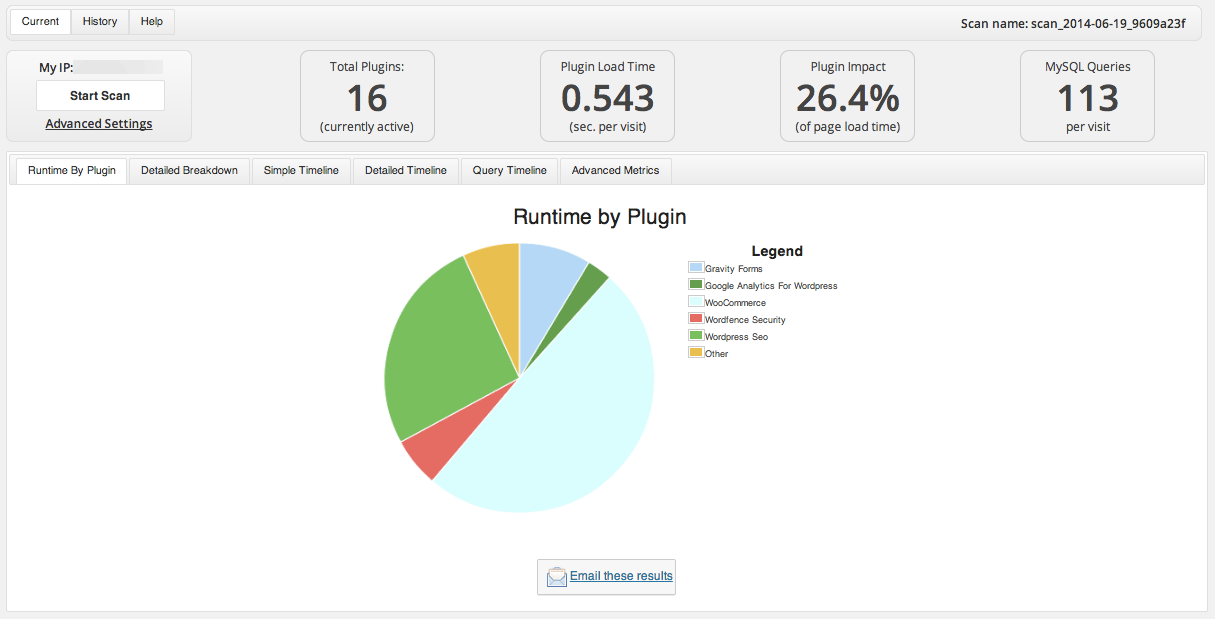
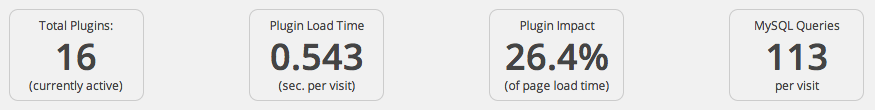
Most of the time, especially if you’re troubleshooting a performance issue, you’ll see a problem plugin stand out like a sore thumb. At a glance, you’ll also be able to see:
在大多数情况下,尤其是在对性能问题进行故障排除时,您会看到有问题的插件像拇指疼一样脱颖而出。 一目了然,您还可以看到:
- The total number of plugins installed on your site 您网站上安装的插件总数
- Plugin Load Time 插件加载时间
- Plugin Impact 插件影响
- MySQL Queries per visit 每次访问MySQL查询
These results will vary from site to site. There isn’t a hard and fast rule for a ‘target’ to aim for. The main thing is that you establish a baseline. The lower that all these numbers are, the better. Lower numbers generally mean quicker loading times for your website visitors. Kurt Payne has posted a good answer to this question at the P3 Support Forum.
这些结果因站点而异。 对于“目标”没有硬性规定。 最主要的是您建立基线。 所有这些数字越低越好。 较低的数字通常意味着网站访问者的加载时间更快。 Kurt Payne 在P3支持论坛上已经很好地回答了这个问题 。
The Scan Results tab displays the most important data, but there are also quite a few nifty features that you may not notice at first glance, including:
“扫描结果”选项卡显示了最重要的数据,但是也有很多漂亮的功能,乍一看您可能不会注意到,其中包括:
- Timelines 时间线
- Scan History 扫描记录
- Advanced Metrics 高级指标
- Email Scan Results 电子邮件扫描结果
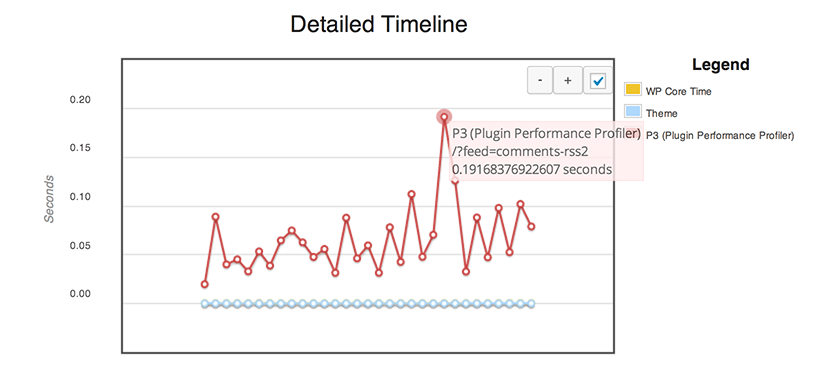
时间线 (Timelines)
There are several views that you can use to drill down into the results of your scans. The Detailed Timeline is definitely worth looking at. Below is a simple example.
您可以使用几种视图来深入了解扫描结果。 详细的时间表绝对值得一看。 以下是一个简单的示例。
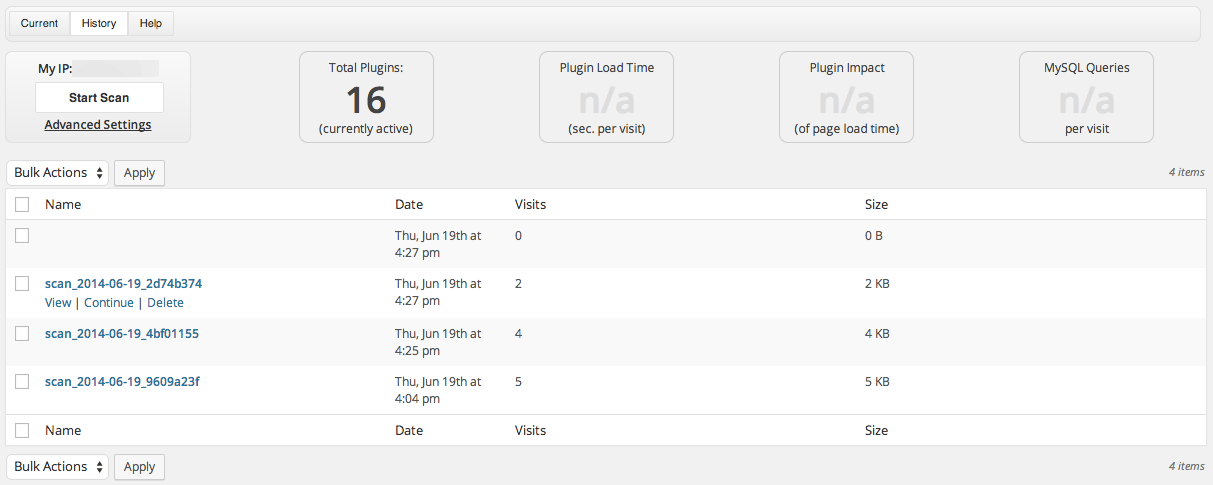
扫描记录 (Scan History)
Scan History is an online archive of all your plugin performance tests. It allows you to view old scan data, and compare it to new results, so that you can track plugin changes over time. It is not uncommon for plugins to run perfectly when first installed, but struggle as time goes by, particularly when dealing with more requests/data or as server resources change.
扫描历史记录是您所有插件性能测试的在线存档。 它允许您查看旧的扫描数据,并将其与新结果进行比较,以便您可以跟踪随时间变化的插件。 插件首次安装后完美运行的情况并不少见,但是随着时间的流逝,尤其是在处理更多请求/数据或服务器资源变化时,挣扎尤为困难。
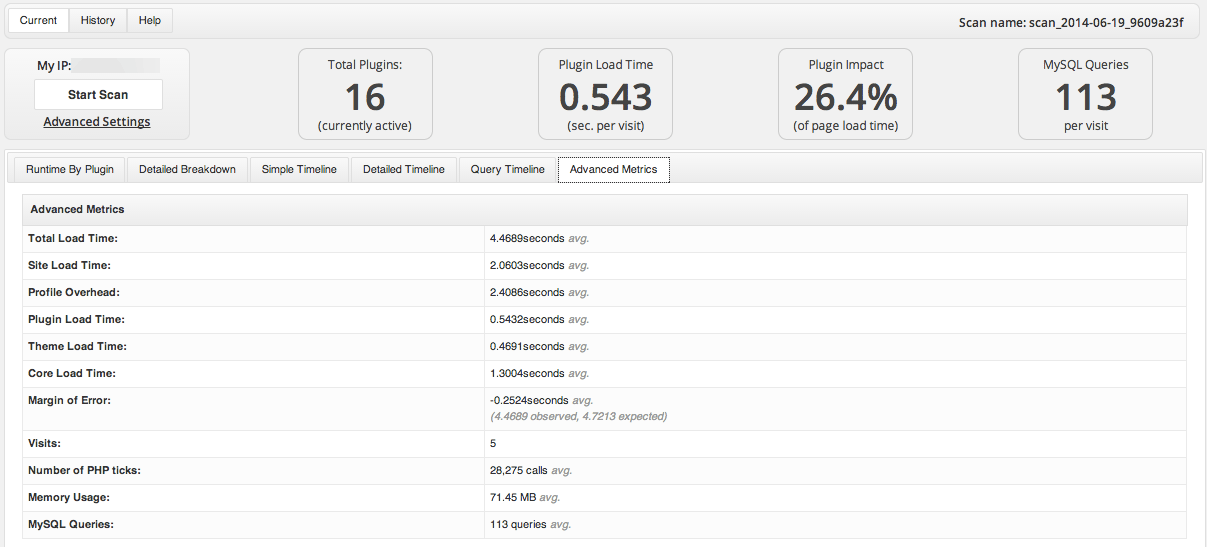
高级指标 (Advanced Metrics)
Advanced Metrics provides several visual views of your test results, including data on total load time, site load time, profile overhead, memory usage, margin of error, and MySQL queries.
Advanced Metrics提供了一些直观的测试结果视图,包括有关总加载时间,站点加载时间,配置文件开销,内存使用率,错误余量和MySQL查询的数据。
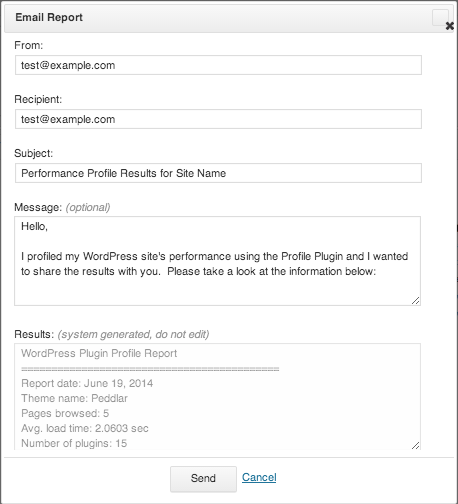
电子邮件扫描结果 (Email Scan Results)
As the name suggests, Email Scan Results allows you to email scan results directly out of the WordPress Dashboard, and into your inbox or share it with your team with just one little click.
顾名思义,“电子邮件扫描结果”使您可以将扫描结果直接从WordPress仪表板发送出去,并发送到收件箱中,或者只需单击一下即可与团队共享。
P3的精度如何? (How Accurate is P3?)
Given the very nature of what P3 is measuring, and the way in which this measurement is undertaken, P3 cannot possibly be 100% accurate. Results can, and do, change between scans. Numerous factors can affect the results of a P3 scan: the server environment, website traffic fluctuations at the time of scanning, activity in the plugin itself, and other activity on your server. Caching can also affect tests.
考虑到P3所测量的本质以及进行该测量的方式,P3可能不可能100%准确。 结果可以而且确实会在两次扫描之间发生变化。 许多因素都会影响P3扫描的结果:服务器环境,扫描时网站的流量波动,插件本身的活动以及服务器上的其他活动。 缓存也会影响测试。
However, you can view the margin of error in the Advanced Metrics section. Numerically speaking, the margin of error is relatively low.
但是,您可以在“高级指标”部分中查看误差范围。 从数值上讲,误差幅度相对较低。
The best way to ensure the most accurate results from P3 is to run more scans. The more scans you run, the better. Don’t assume that the results from one or two scans are 100% reliable.
确保从P3获得最准确结果的最佳方法是运行更多扫描。 您运行的扫描次数越多越好。 不要假设一两次扫描的结果是100%可靠的。
结论 (Conclusion)
P3 can be a useful tool in testing plugin performance, and the impact that plugins are having on your WordPress website. Used as a guide, P3 can help you pinpoint potential problems and keep your website running quickly and efficiently.
P3是测试插件性能以及插件对WordPress网站的影响的有用工具。 作为指导,P3可以帮助您查明潜在问题并保持网站快速有效地运行。
If you’re interested in learning more about WordPress performance optimization, check out our recent article How to Speed Up WordPress.
如果您有兴趣了解有关WordPress性能优化的更多信息,请查看我们最近的文章How to Speed WordPress 。
For more information on P3, visit the P3 project page at the WordPress Plugin Directory.
有关P3的更多信息,请访问WordPress插件目录中的P3项目页面 。
翻译自: https://www.sitepoint.com/optimizing-wordpress-performance-with-p3/
wordpress优化


 1613
1613

 被折叠的 条评论
为什么被折叠?
被折叠的 条评论
为什么被折叠?
 到【灌水乐园】发言


