excel显示多个窗口显示
Did you ever print and distribute pivot table reports in Excel, only to discover – too late – that they weren’t showing the correct information? To help save you from wasted time and paper, and possible embarrassment, AlexJ is sharing his Report Diagnostic Display technique today.
您是否曾经在Excel中打印并分发数据透视表报表,却发现(显示为时已晚)它们没有显示正确的信息? 为了帮助您避免浪费时间和纸张,并避免尴尬,AlexJ今天分享了他的报告诊断显示技术。
You might remember some of his other handy tips, such as
您可能还记得他的其他一些实用技巧,例如
Before you read the rest of this article, remember that the 20% discount ends today, Oct. 16th, for Mynda Treacy’s Excel Dashboard course. To get a bonus of one of my products, enter DebraD in the coupon code box.
在阅读本文的其余部分之前,请记住,针对Mynda Treacy的Excel Dashboard课程的20%折扣 今天即 10月16日结束 。 要获得我的一种产品的赠金 ,请在优惠券代码框中输入DebraD 。
多个报告和切片器 (Multiple Reports and Slicers)
AlexJ sends out several monthly reports that are pivot tables, all based on the same source data. Each pivot table is on a separate sheet, and each one has a unique layout and filters.
AlexJ发送了一些月度报告,这些月度报告是数据透视表,所有报告均基于相同的源数据。 每个数据透视表都位于单独的工作表上,每个数据透视表都有独特的布局和过滤器。
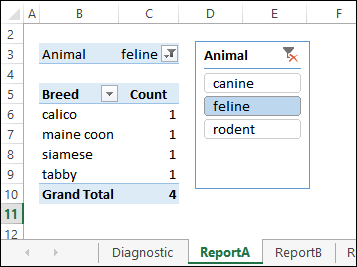
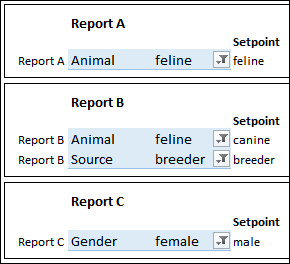
We’ll use a simpler version for this example, with 3 reports and a diagnostics sheet. In the screen shot below you can see Report A, and its Slicer for the Animal field.
在此示例中,我们将使用一个更简单的版本,其中包含3个报告和一个诊断表。 在下面的屏幕截图中,您可以看到“报告A”及其“动物”字段的“切片器”。
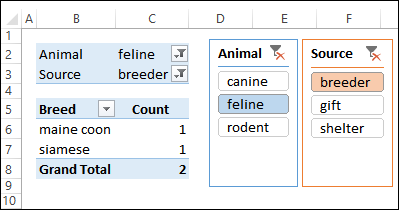
Report B is slightly different and has 2 Slicers – Animal and Source.
报告B略有不同,并且具有2个切片器-动物和来源。
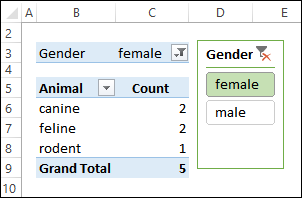
The final report – Report C – has one Slicer, and a different layout.
最终报告–报告C –具有一个切片器和不同的布局。
记录设定值 (Record the Setpoints)
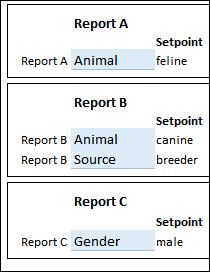
To create a standard set of reports each month, AlexJ needs to have specific items selected in the Slicers for each report. He created a master list of these settings, and typed them onto the Diagnostics sheet in the workbook, as Setpoints.
要每月创建一组标准报告,AlexJ需要在“切片器”中为每个报告选择特定的项目。 他创建了这些设置的主列表,并将它们作为设定值键入到工作簿的“诊断”表中。
显示当前选择 (Show the Current Selections)
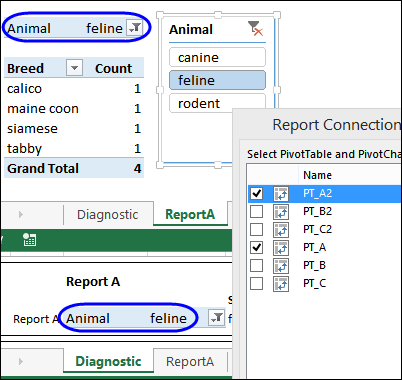
To avoid going to each sheet every month, and checking its pivot table Slicers, AlexJ put a copy of each pivot table onto the Diagnostics sheet. Then, he removed all the fields, except the Report Filters. All that’s left is a tiny pivot table, that almost looks like a regular data validation drop down list.
为了避免每月去每个工作表并检查其数据透视表切片器,AlexJ将每个数据透视表的副本放到了诊断表上。 然后,他删除了所有字段,但“报告过滤器”除外。 剩下的只是一个很小的数据透视表,几乎像一个常规数据验证下拉列表。
The pivot tables on the Diagnostics sheet are connected to the same Slicers that are on the Report sheets, so their filters show the same selections.
“诊断”表上的数据透视表连接到“报告”表上的相同“切片器”,因此它们的过滤器显示相同的选择。
查找不匹配的过滤器 (Find the Mismatched Filters)
With the current selections and the Setpoints on the Diagnostic sheet, it’s easy to identify the reports where the incorrect filters are selected.
使用“诊断”表上的当前选择和“设定点”,可以很容易地识别出选择了错误过滤器的报告。
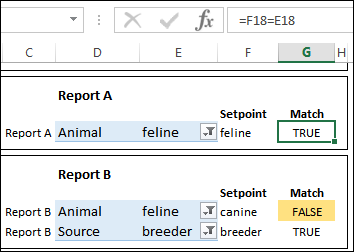
For example, the formula in cell G18 compares the selection and Setpoint in Report A: =F18=E18
例如,单元格G18中的公式将比较报告A中的选择和设定值: = F18 = E18
Those items are the same, so the result is TRUE. However, in Report B, there is a mismatch in the Animal field, so the result is FALSE. Conditional formatting highlights the cells that contain FALSE.
这些项目相同,因此结果为TRUE。 但是,在报告B中,“动物”字段中不匹配,因此结果为FALSE。 条件格式突出显示包含FALSE的单元格。
显示诊断摘要 (Show a Diagnostic Summary)
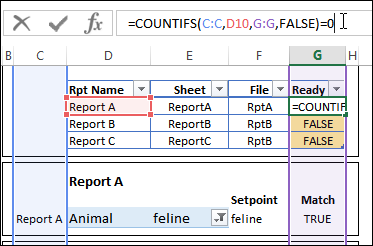
To show a quick summary of the report status, there is a Reports list at the top of the Diagnostics sheet. It uses a COUNTIFS formula, to check the number of FALSE matches for each report. The formula in cell G10 is:
要显示报告状态的快速摘要,“诊断”表顶部有一个“报告”列表。 它使用COUNTIFS公式来检查每个报告的FALSE匹配数。 G10单元格中的公式为:
=COUNTIFS(C:C,D10,G:G,FALSE)=0
= COUNTIFS(C:C,D10,G:G,FALSE)= 0
计算就绪报告 (Count the Ready Reports)
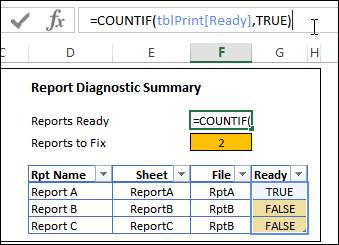
Finally, there are two formulas at the top of the sheet, to count the number of TRUE and FALSE results in the Reports List.
最后,工作表顶部有两个公式,用于计算“报告列表”中TRUE和FALSE结果的数量。
The formula in cell F5 counts the TRUE results, and F7 counts the FALSE results.
F5单元格中的公式计算TRUE结果,而F7则计算FALSE结果。
=COUNTIF(tblPrint[Ready],TRUE)
= COUNTIF(tblPrint [Ready],TRUE)
打印前修正报告 (Fix the Report Before Printing)
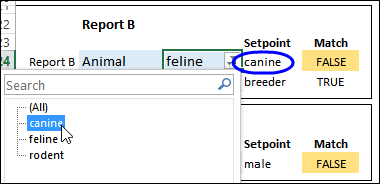
Before printing the reports, you can use the pivot tables on the Diagnostics sheet, to correct any mismatched selections.
在打印报告之前,您可以使用“诊断”表上的数据透视表来更正所有不匹配的选择。
For example, in Report B, select canine from the Animal field, to match its Setpoint.
例如,在报告B中,从“动物”字段中选择“犬”以匹配其设定值。
Then, after all the reports have been fixed, you can go ahead with the printing.
然后,在修复所有报告之后,您可以继续打印。
下载样本文件 (Download the Sample File)
To download the file, go to AlexJ’s Sample Files page on my Contextures website, and in the Pivot Tables section, look for PT0005 - Pivot Table Report Diagnostics
若要下载文件,请转到我的Contextures网站上的AlexJ的“示例文件”页面 ,然后在“数据透视表”部分中查找“ PT0005-数据透视表报告诊断”
The zipped file is in xlsx format, and does not contain macros.
压缩文件为xlsx格式,不包含宏。
翻译自: https://contexturesblog.com/archives/2014/10/16/excel-report-diagnostic-display/
excel显示多个窗口显示


 2156
2156

 被折叠的 条评论
为什么被折叠?


