excel图表配合下拉菜单
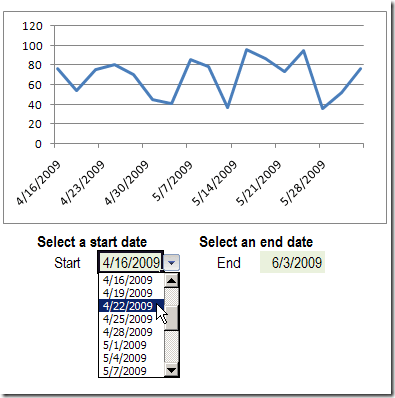
Instead of showing all the data in a chart, you can select a specific date range, and show only the data from that period. In this example, drop down lists of dates are created with data validation. Select Excel chart dates from a drop down list, and the chart changes to show the new range.
您可以选择一个特定的日期范围,而仅显示该期间的数据,而不是在图表中显示所有数据。 在此示例中,日期下拉列表是通过数据验证创建的。 从下拉列表中选择Excel图表日期,图表将更改以显示新范围。

To create this dynamic chart in Excel 2007, you can create a table from the chart data, then create named ranges, and use those names in the chart.
若要在Excel 2007中创建此动态图表,可以从图表数据中创建一个表,然后创建命名范围,并在图表中使用这些名称。
为图表数据创建Excel表 (Create an Excel Table for the Chart Data)
[Note: Please see the post, Problems With Dynamic Charts in Excel and ignore this step -- the Excel Table may cause problems.]
[ 注意 :请参阅“ Excel中的动态图表问题”一文,而忽略此步骤-Excel表可能会引起问题。]
- On the Chart sheet, select a cell in the chart data, e.g. cell A1 在图表工作表上,在图表数据中选择一个单元格,例如单元格A1
- On the Ribbon, click the Insert tab, then click Table 在功能区上,单击“插入”选项卡,然后单击“表”。
- In the Create Table dialog box, click OK, to create the table for the selected range. 在“创建表”对话框中,单击“确定”,以为所选范围创建表。


 本文介绍了如何在Excel中创建动态图表,通过下拉菜单选择日期范围,只显示特定时期的图表数据。首先,从图表数据创建Excel表格,然后命名开始和结束日期的单元格,接着定义图表日期范围。再创建开始和结束日期的下拉列表,并为X和Y值定义命名范围。最后,创建图表并使其动态响应下拉菜单的选择,用户可以轻松测试和下载示例文件。
 最低0.47元/天 解锁文章


 1240
1240

 被折叠的 条评论
为什么被折叠?


