


如何在word中制作流程图
Flowcharts are a very good way to get a new idea explained in a presentation. Office 2007 has some great new tools for creating a visual appealing flowchart which can be used from Excel, Word or PowerPoint. Here we will take a look at creating a simple flowchart in Word 2007.
流程图是获得演示文稿中解释的新想法的一种很好的方法。 Office 2007提供了一些很棒的新工具来创建吸引人的视觉流程图,可从Excel,Word或PowerPoint使用这些工具。 在这里,我们将看一下在Word 2007中创建一个简单的流程图。
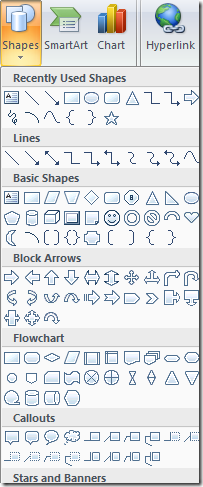
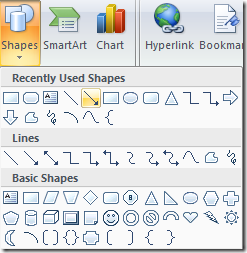
For the sake of this article I am going to start at the top of the document on the right side under the title. Then click Insert then Shapes on the Ribbon to select a shape from the Flowchart section. You can can then draw an outline for the size of this object on the document. You then will see how it will look right away.
为了本文的方便,我将从标题右侧的文档顶部开始。 然后单击功能区 插入 形状 ,然后选择从流程图部分的形状。 然后,您可以在文档上为此对象的大小绘制轮廓。 然后,您将立即看到它的外观。
To link the shapes on your flow chart there is a multitude of options. Here I am going to use an arrow. To efficiently create the flow chart, it is best to get the basic design first before worrying about the graphic effects. You can always add the effects later.
要链接流程图上的形状,有多种选择。 在这里,我将使用箭头。 为了有效地创建流程图,最好在担心图形效果之前首先获得基本设计。 您以后可以随时添加效果。
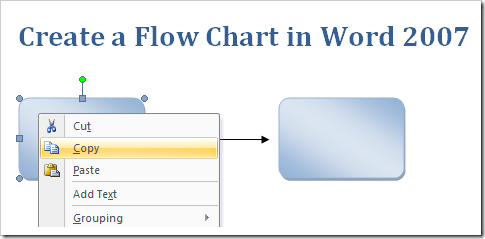
I choose a quick format for the first shapes, drawn the arrow, and am ready to set up more sections. I just copy and paste the first box and drag it to the appropriate position.
我为第一个形状选择了一种快速格式,绘制了箭头,并准备设置更多部分。 我只是复制并粘贴第一个框并将其拖动到适当的位置。
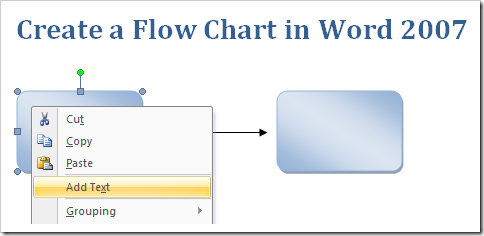
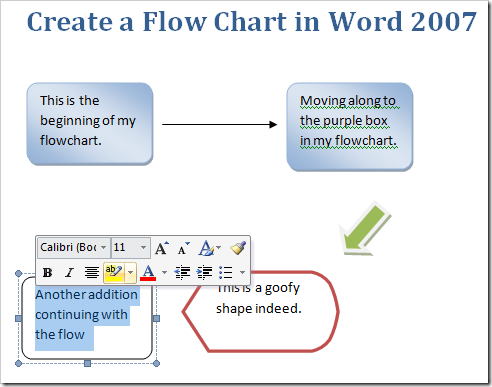
After getting accustomed to selecting shapes and adjusting their positions it’s probably a good idea to start adding text. To add text to the chart simply Right Click on a box and select Add Text from the menu and begin typing away.
在习惯了选择形状并调整其位置之后,开始添加文本可能是一个好主意。 只需在图表上单击鼠标右键 ,然后从菜单中选择“ 添加文本”即可向图表添加文本 然后开始打字。
The mini formatting toolbar is still available with any text you enter into the chart which comes in handy if you are use to it. If you are not a fan and want to stop it, you can make the mini formatting toolbar stop popping up.
迷你格式工具栏仍然可用,您在图表中输入的任何文本都会很方便,如果您习惯使用它的话。 如果您不是风扇,但想停止它,可以使迷你格式化工具栏停止弹出 。
Once you have the basic outline of the flowchart complete, it’s time to add some “pizzazz” to everything. This is done using the Format tab on the Ribbon. Here are a few shots of what you can do. This is the different colors you can make the shapes.
一旦完成了流程图的基本概述,就该向所有内容添加一些“ pizzazz”了。 使用功能区上的“ 格式”选项卡可以完成此操作。 以下是您可以做什么的一些快照。 这是您可以制作形状的不同颜色。

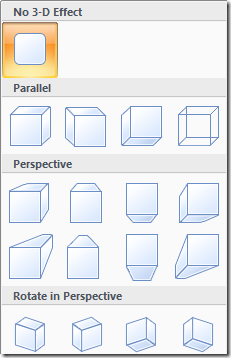
Here are Shadow and 3D effects. The cool thing with Office 2007 is you can just hover the mouse over the different effects and get a preview of how it will look in the document. This saves a lot of time rather than relying on a trial and error approach.
这是阴影和3D效果 。 Office 2007的优点是您可以将鼠标悬停在不同的效果上,并预览它在文档中的外观。 这样可以节省大量时间,而不必依靠反复试验的方法。

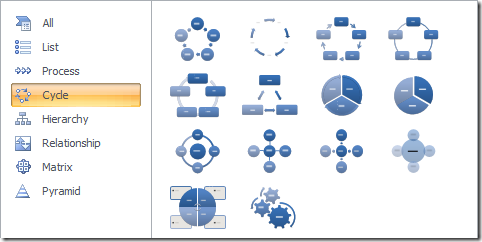
Another feature is inserting Smart Art. This allows you to insert nice pre-designed graphic layouts. You do not need to be graphic design expert to insert professional looking content.
另一个功能是插入Smart Art 。 这使您可以插入漂亮的预先设计的图形布局。 您无需成为图形设计专家即可插入具有专业外观的内容。
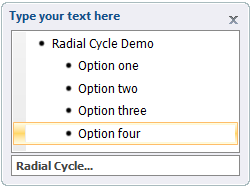
A handy window opens up where you can insert text into the chart which in this case is Radial Cycle. You will see the text as it would appear in the smart art at the same time it’s entered.
随即打开一个方便的窗口,您可以在其中向图表中插入文本,本例中为“ 径向循环” 。 输入的同时,您将看到在智能艺术品中显示的文字。
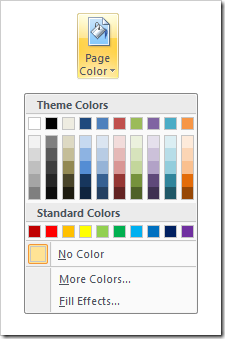
A good way to help the graphics in your chart stand out better is to change the background color of the document. This is done from Page Layout and Page Background sections on the Ribbon.
帮助您更好地突出图表中图形的一种好方法是更改文档的背景颜色。 这是通过功能区上的“ 页面布局”和“ 页面背景”部分完成的。
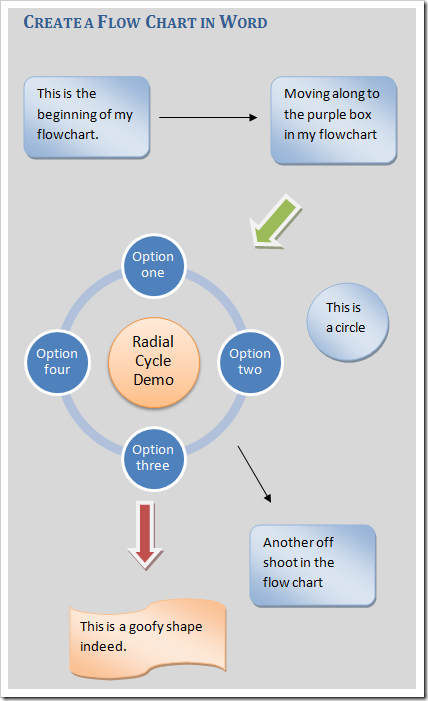
This is a simple flowchart made with the steps and different options shown above.
这是使用上面显示的步骤和不同选项制作的简单流程图。
Now you should have a basic grasp on how to create a flow chart and begin experimenting with the different options available in 2007. Have fun, experiment, and please leave feedback on how you impressed your boss! There has to be a better way to organize those TPS Reports!
现在,您应该对如何创建流程图并开始尝试使用2007年可用的各种选项有了基本的了解。玩得开心,尝试一下,请留下您对老板印象深刻的反馈! 必须有更好的方法来组织这些TPS报告!

翻译自: https://www.howtogeek.com/80014/create-a-flow-chart-in-word-2007-2/
如何在word中制作流程图


 3984
3984


 被折叠的 条评论
为什么被折叠?
被折叠的 条评论
为什么被折叠?
 到【灌水乐园】发言


