


epsg:欧洲石油调查组织
About David: David Asboth is a Data Scientist with a software development background. He’s had many different job titles over the years, with a common theme: he solves human problems with computers and data. This post originally appeared on his blog, davidasboth.com
关于David :David Asboth是一位具有软件开发背景的数据科学家。 这些年来,他拥有许多不同的职位,并具有一个共同的主题:他用计算机和数据解决人为问题。 该帖子最初出现在他的博客davidasboth.com上
介绍 (Introduction)
When you learn about machine learning techniques, you usually get a selection of the usual suspects. Something like: Support Vector Machines, decision trees/random forests, and logistic regression for classification, linear regression for regression, k-means for clustering and perhaps PCA for dimensionality reduction.
当您了解机器学习技术时,通常会选择一些通常的可疑对象。 诸如此类:支持向量机,决策树/随机森林,以及用于分类的逻辑回归,用于回归的线性回归,用于聚类的k均值以及可能用于降维的PCA。
In fact, KDNuggets has a good post about the 10 machine learning algorithms you should know.
实际上,KDNuggets很好地介绍了您应该了解的10种机器学习算法 。
If you want to learn about machine learning techniques, you should start there. The point is, on the subject of these algorithms the internet has you covered.
如果您想学习机器学习技术,则应该从这里开始。 关键是,在这些算法的主题上,互联网已经为您覆盖。
In this post I want to talk about a less prevalent algorithm, but one that I like and that can be useful for different purposes.
在这篇文章中,我想谈一谈一种不太流行的算法,但是我喜欢并且可以用于不同目的的算法。
It’s called a Self-Organising Map (SOM).
这称为自组织地图(SOM)。
历史简介 (Brief History)
SOMs are a type of artificial neural network. Some of the concepts date back further, but SOMs were proposed and became widespread in the 1980s, by a Finnish professor named Teuvo Kohonen. Unsurprisingly SOMs are also referred to as Kohonen maps.
SOM是一种人工神经网络。 一些概念可以追溯到更远,但SOM是由芬兰教授Teuvo Kohonen提出并于1980年代广泛传播的。 毫不奇怪,SOM也称为Kohonen映射。
人工神经网络 (Artificial Neural Networks)
Artifical neural networks (ANNs) were designed initially to be a computational representation of what is believed to happen in the brain. The way signals are passed along an ANN is based on how signals pass between neurons in the brain.
人工神经网络(ANN)最初被设计为被认为在大脑中发生的事情的计算表示。 信号沿ANN传递的方式基于信号在大脑神经元之间的传递方式。
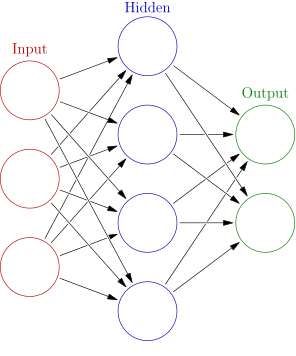
ANNs are constructed as a series of layers of connected nodes. The first layer consists of your inputs, the last layer consists of your outputs, and there are any number of so-called hidden layers in between.
ANN被构造为一系列的连接节点层。 第一层由您的输入组成,最后一层由您的输出组成,并且它们之间有任意数量的所谓隐藏层。
The broad idea of an ANN is that you give it a dataset and a set of desired outputs, and it learns to map the inputs to the outputs. A classic example is teaching an ANN to recognise handwritten characters by giving it pixel values as inputs and the correct digit (say a number from 0-9) as the output.
人工神经网络的广泛思想是给它一个数据集和一组所需的输出,并且它学会将输入映射到输出。 一个经典的例子是,通过给ANN提供像素值作为输入,并为其提供正确的数字(例如0到9之间的数字),来教导ANN识别手写字符。
During the training phase it learns the associations between pixel values and the digits. Then, you can give it a new set of inputs, digits it hasn’t seen before, and it will be able to recognise them.
在训练阶段,它学习像素值和数字之间的关联。 然后,您可以为其提供一组新的输入,即以前从未见过的数字,它将能够识别它们。
Here is such a system recognising characters in real time. It was built by Yann LeCun in the 1990s.
这是一种实时识别字符的系统 。 它由Yann LeCun于1990年代建造。
The way most ANNs “learn” a particular problem is by error-correcting. That is, during the training phase they adapt and improve based on the errors they make, and incrementally get better at solving the problem.
大多数人工神经网络“学习”特定问题的方式是通过纠错。 也就是说,在培训阶段,他们会根据自己所犯的错误进行调整和改进,并逐步解决问题。
This is a supervised machine learning problem because you are telling the algorithm the desired answer for each set of inputs it’s trained on, so it knows if it makes errors.
这是有监督的机器学习问题,因为您要告诉算法对其进行训练的每个输入集所需的答案,因此它知道是否会出错。
SOM作为人工神经网络 (The SOM as an ANN)
There are three main ways in which a Self-Organising Map is different from a “standard” ANN:
自组织地图与“标准”人工神经网络的区别主要有以下三种:
- A SOM is not a series of layers, but typically a 2D grid of neurons
- They don’t learn by error-correcting, they implement something called competitive learning
- They deal with unsupervised machine learning problems
- SOM不是一系列层,而是通常是2D神经元网格
- 他们不是通过纠错来学习,而是实施称为竞争性学习的方法
- 他们处理无人监督的机器学习问题
Competitive learning in the case of a SOM refers to the fact that when an input is “presented” to the network, only one of the neurons in the grid will be activated. In a way the neurons on the grid “compete” for each input.
在SOM的情况下,竞争性学习是指以下事实:当将输入“呈现”到网络时,只会激活网格中的一个神经元。 以某种方式,网格上的神经元会为每个输入“竞争”。
The unsupervised aspect of a SOM refers to the idea that you present your inputs to it without associating them with an output. Instead, a SOM is used to find structure in your data.
SOM的不受监督的方面是指您向其呈现输入而不将它们与输出关联的想法。 而是使用SOM在数据中查找结构。
SOM的作用是什么? (What is a SOM used for?)
This last point about unsupervised learning brings me to an important question, because abstract concepts like neural networks are great to talk about but I’m a practical kind of guy.
关于无监督学习的最后一点使我提出了一个重要问题,因为诸如神经网络之类的抽象概念值得讨论,但是我是一个实用的人。
In that spirit then, what is a SOM used for?
那么,按照这种精神,SOM的作用是什么?
寻找结构 (Finding Structure)
A classic example of what clustering algorithms are used for is finding similar customers in your customer base. SOMs can also do this. In fact, a SOM is meant to be a 2D representation of your multi-dimensional dataset. In this 2D representation, each of your original inputs, e.g. each of your customers, maps to one of the nodes on the 2D grid. Most importantly, similar (high-dimensional) inputs will map to the same 2D node, or at least the same region in 2D space. This is how the SOM finds and groups similar inputs together.
关于群集算法用于什么的经典示例是在您的客户群中找到相似的客户。 SOM也可以做到这一点。 实际上,SOM就是多维数据集的2D表示。 在这种2D表示中,每个原始输入(例如每个客户)都映射到2D网格上的一个节点。 最重要的是,相似(高维)输入将映射到同一2D节点,或者至少映射到2D空间中的同一区域。 这就是SOM查找和将相似输入分组的方式。
降维 (Dimensionality Reduction)
Related to finding structure is the fact that by finding this structure a SOM finds a lower-dimensional representation of your dataset while preserving the similarity between your records.
与查找结构相关的事实是,通过查找此结构,SOM可以找到数据集的低维表示形式,同时保留记录之间的相似性。
That is, data points that are “nearby” in high-dimensional space will also be nearby in the SOM.
也就是说,高维空间中“附近”的数据点也将在SOM中。
可视化 (Visualisation)
By creating a (typically) 2D representation of your dataset you can also more easily visualise it, which you can’t do if your data has more than 3 dimensions.
通过创建(通常)数据集的2D表示,您还可以更轻松地对其进行可视化,如果数据的维度超过3个,则无法实现。
摘要 (Summary)
To summarise, I’ll quote an answer I gave on StackOverflow to a question about SOMs:
总而言之,我将引用我在StackOverflow上给出的有关SOM的问题的答案:
The idea behind a SOM is that you’re mapping high-dimensional vectors onto a smaller dimensional (typically 2D) space. You can think of it as clustering, like in K-means, with the added difference that vectors that are close in the high-dimensional space also end up being mapped to nodes that are close in 2D space.
SOM的思想是将高维向量映射到较小的维(通常是2D)空间。 您可以将其视为聚类(就像在K均值中一样),不同之处在于,高维空间中接近的向量最终也将映射到二维空间中接近的节点。
SOMs therefore are said to “preserve the topology” of the original data, because the distances in 2D space reflect those in the high-dimensional space. K-means also clusters similar data points together, but its final “representation” is hard to visualise because it’s not in a convenient 2D format.
因此,SOM被称为“保留原始数据的拓扑”,因为2D空间中的距离反映了高维空间中的距离。 K-means还可以将相似的数据点聚集在一起,但是其最终的“表示形式”很难直观显示,因为它不是方便的2D格式。
A typical example is with colours, where each of the data points are 3D vectors that represent R,G,B colours. When mapped to a 2D SOM you can see regions of similar colours begin to develop, which is the topology of the colour space.
一个典型的例子是颜色,其中每个数据点都是代表R,G,B颜色的3D向量。 映射到2D SOM时,您可以看到相似颜色的区域开始发展,这是颜色空间的拓扑。
色彩 (Colors)
I hope that sounds interesting, because in Part 2 of this post (coming on Thursday) I’ll discuss some concrete examples and walk through a Python implementation of Self-Organising Maps.
我希望这听起来很有趣,因为在这篇文章的第2部分(将于周四发布)中,我将讨论一些具体示例,并逐步介绍自组织地图的Python实现。
The example we’ll be working with is using a 3D dataset of colours (where the 3 dimensions are R, G and B) and producing a 2D SOM where we visualise the “topology” of the 3D colour space.
我们将使用的示例使用3D颜色数据集(其中3个维度分别为R,G和B)并生成2D SOM,在此我们可以可视化3D颜色空间的“拓扑”。
翻译自: https://www.pybloggers.com/2017/03/self-organising-maps-an-introduction/
epsg:欧洲石油调查组织


 355
355

 被折叠的 条评论
为什么被折叠?
被折叠的 条评论
为什么被折叠?
 到【灌水乐园】发言


