


precision plot图
类似如下图:
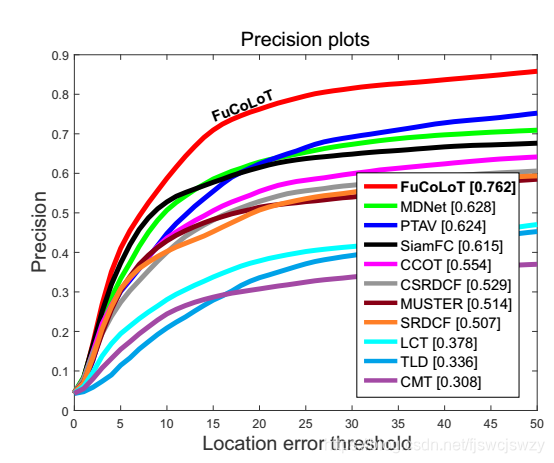
其含义为:跟踪算法估计的目标位置(bounding box)的中心点与人工标注(ground-truth)的目标的中心点,这两者的距离小于给定阈值的视频帧的百分比。不同的阈值,得到的百分比不一样,因此可以获得一条曲线。
该评估方法的缺点:无法反映目标物体大小与尺度的变化。
简单来说:横坐标代表阈值,阈值范围是1到50,纵坐标代表 跟踪算法估计的目标位置(bounding box)的中心点与人工标注(ground-truth)的目标的中心点的距离小于给定阈值的视频帧的百分比。(比如:横坐标阈值为10,对应纵坐标百分比为0.6,就代表当前跟踪视频序列有60%的视频帧是满足bounding box的中心与ground-truth的中心的距离是小于10个像素)
其matlab代码为:
function [precisions, distances, averageLocationError] = precision_plot(positions, ground_truth,colortype,show)
%PRECISION_PLOT
%   Calculates precision for a series of distance thresholds (percentage of
%   fra
最低0.47元/天 解锁文章


 3357
3357

 被折叠的 条评论
为什么被折叠?
被折叠的 条评论
为什么被折叠?
 到【灌水乐园】发言


