


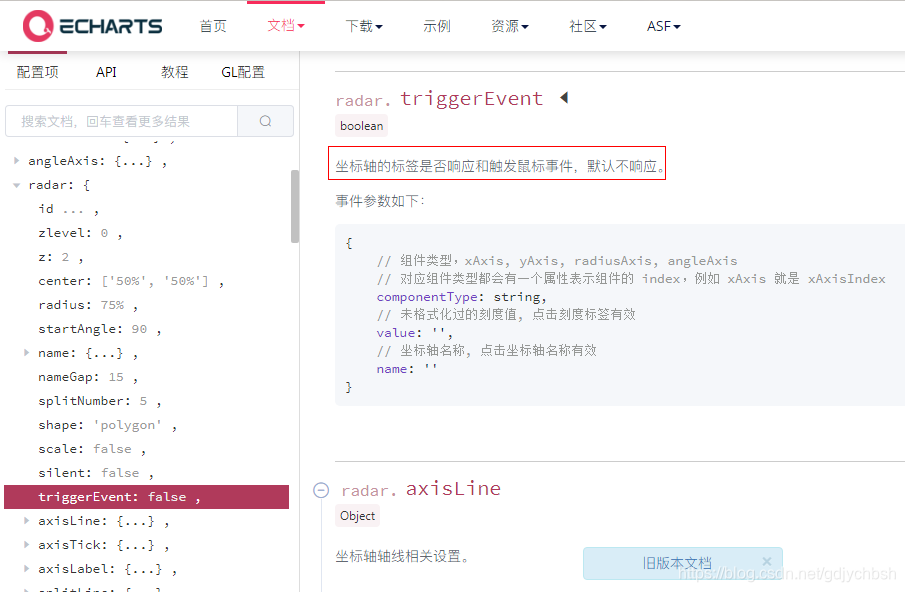
问题:echart雷达图的坐标轴标签默认是不响应点击事件的
知识:
解决:
this.chart.setOption({
tooltip: {
trigger: 'axis',
axisPointer: { // 坐标轴指示器,坐标轴触发有效
type: 'shadow' // 默认为直线,可选为:'line' | 'shadow'
}
},
radar: {
radius: '50%',
center: ['50%', '50%'],
indicator: this.raddarData1,
name: {
textStyle: {
color: 'rgb(52, 148, 136)'
}
},
splitLine: {
lineStyle: {
color: [
'rgba(52, 148, 136, 0.3)', 'rgba(52, 148, 136, 0.4)',
'rgba(52, 148, 136, 0.5)', 'rgba(52, 148, 136, 0.7)',
'rgba(52, 148, 136, 0.8)', 'rgba(52, 148, 136, 1)'
].reverse()
}
},
axisLine: {
lineStyle: {
color: 'rgba(52, 148, 136, 0.5)'
}
},
triggerEvent: true
},
legend: {
left: 'center',
bottom: '10',
data: ['事件数量'],
show: false
},
series: [{
type: 'radar',
tooltip: {
trigger: 'item',
position: ['30%', '20%']
},
emphasis: {
areaStyle: {
color: 'rgba(215,41,58,0.3)'
}
},
data: this.raddarData2,
animationDuration: animationDuration
}]
})
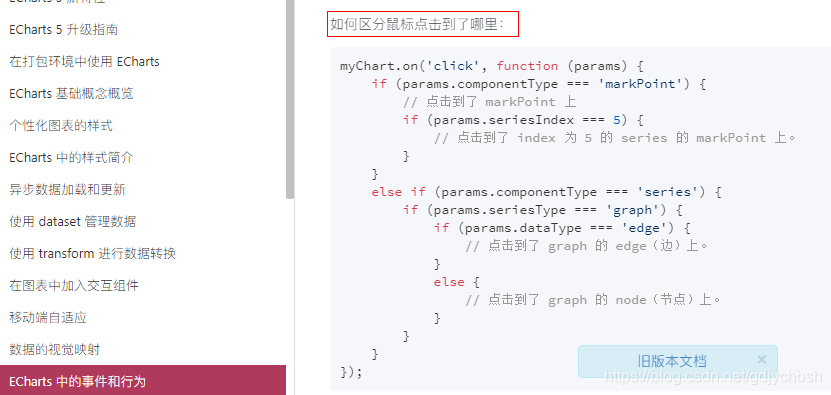
this.chart.on('click', function(params) {
if (params.componentType === 'radar') {
// 点击到了 radar坐标轴标签 上
that.echartClick(params.name)
} else if (params.componentType === 'series') {
that.echartClick('')
}
})


 4846
4846


 被折叠的 条评论
为什么被折叠?
被折叠的 条评论
为什么被折叠?
 到【灌水乐园】发言


