


 本文分享了在uni-app中接入腾讯地图的经验。先介绍准备工作,包括注册账号获取Key。接着详细讲解导入地图、点击坐标定位、自定义标点、自定义信息框体和区域绘制等功能的代码及实现,还对比了与高德地图的异同,文末给出项目地址。
一、前言
之前做过一个 高德地图 接入,功能基本一致,本文使用腾讯地图完成了相关功能,比高德地图多了一个区域的绘制功能。本文除了功能使用外还会讲解一些两者的异同。
在文末会有该
demo的项目地址,希望大家看完可以多多点赞👍收藏⭐一下。
二、准备工作
1、参考博客以及相关地址
腾讯位置服务:平台地址
【Uniapp】高德地图的接入、定位、自定义标点与信息窗体使用:文档地址
2、注册腾讯位置服务账号
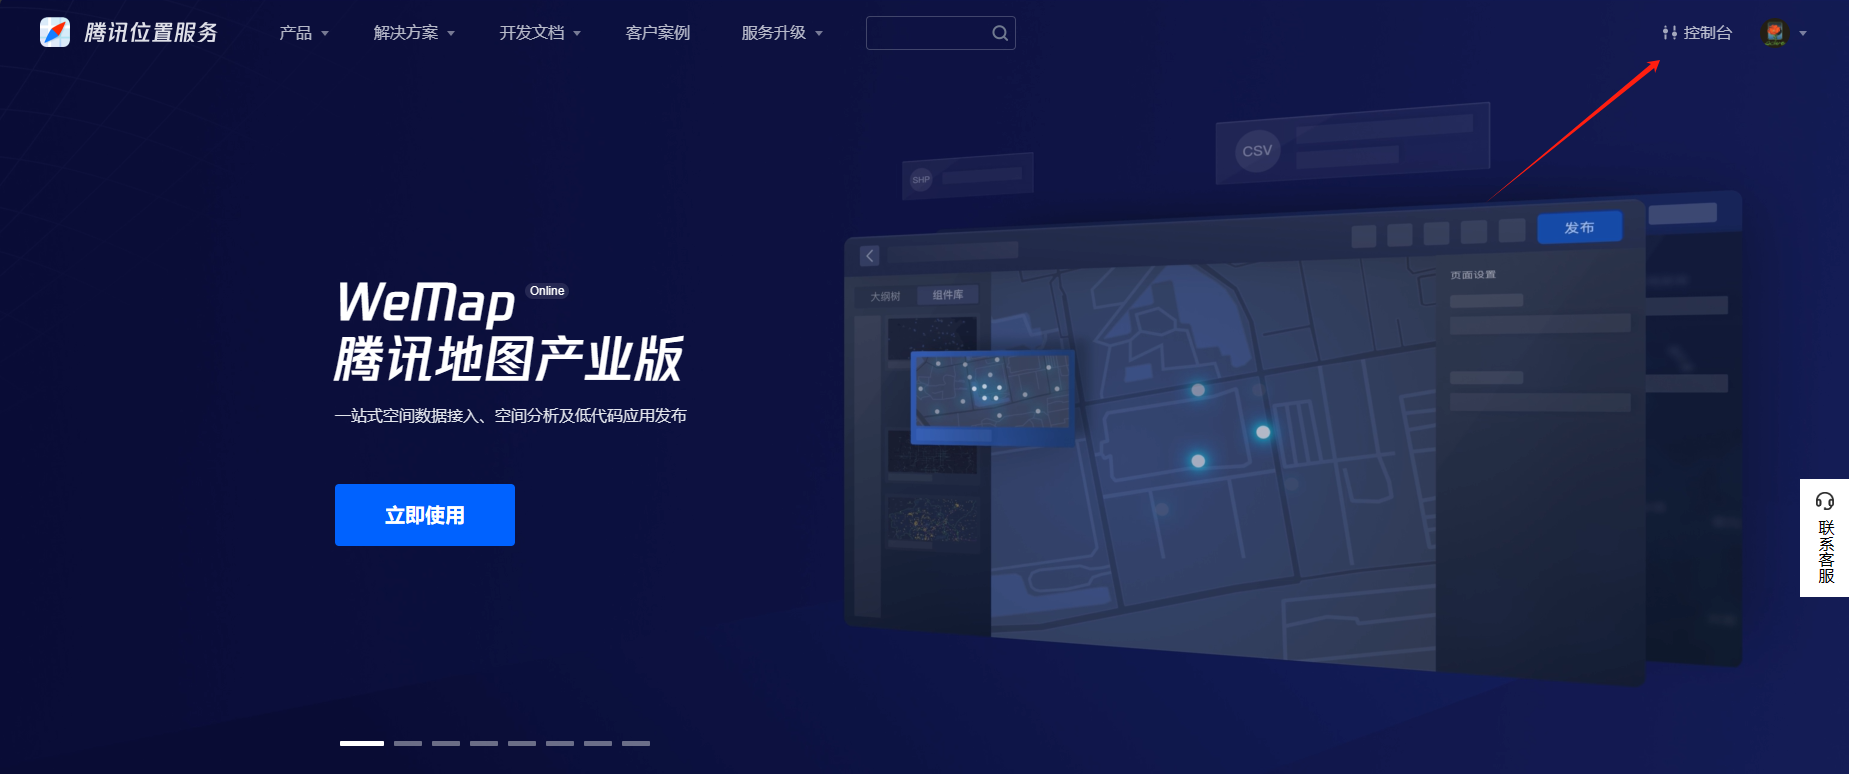
我们需要先在腾讯位置服务注册一个账号,以申请获取 key 等权限信息。注册流程很简单,就不赘述了,获取成功后点击此处:
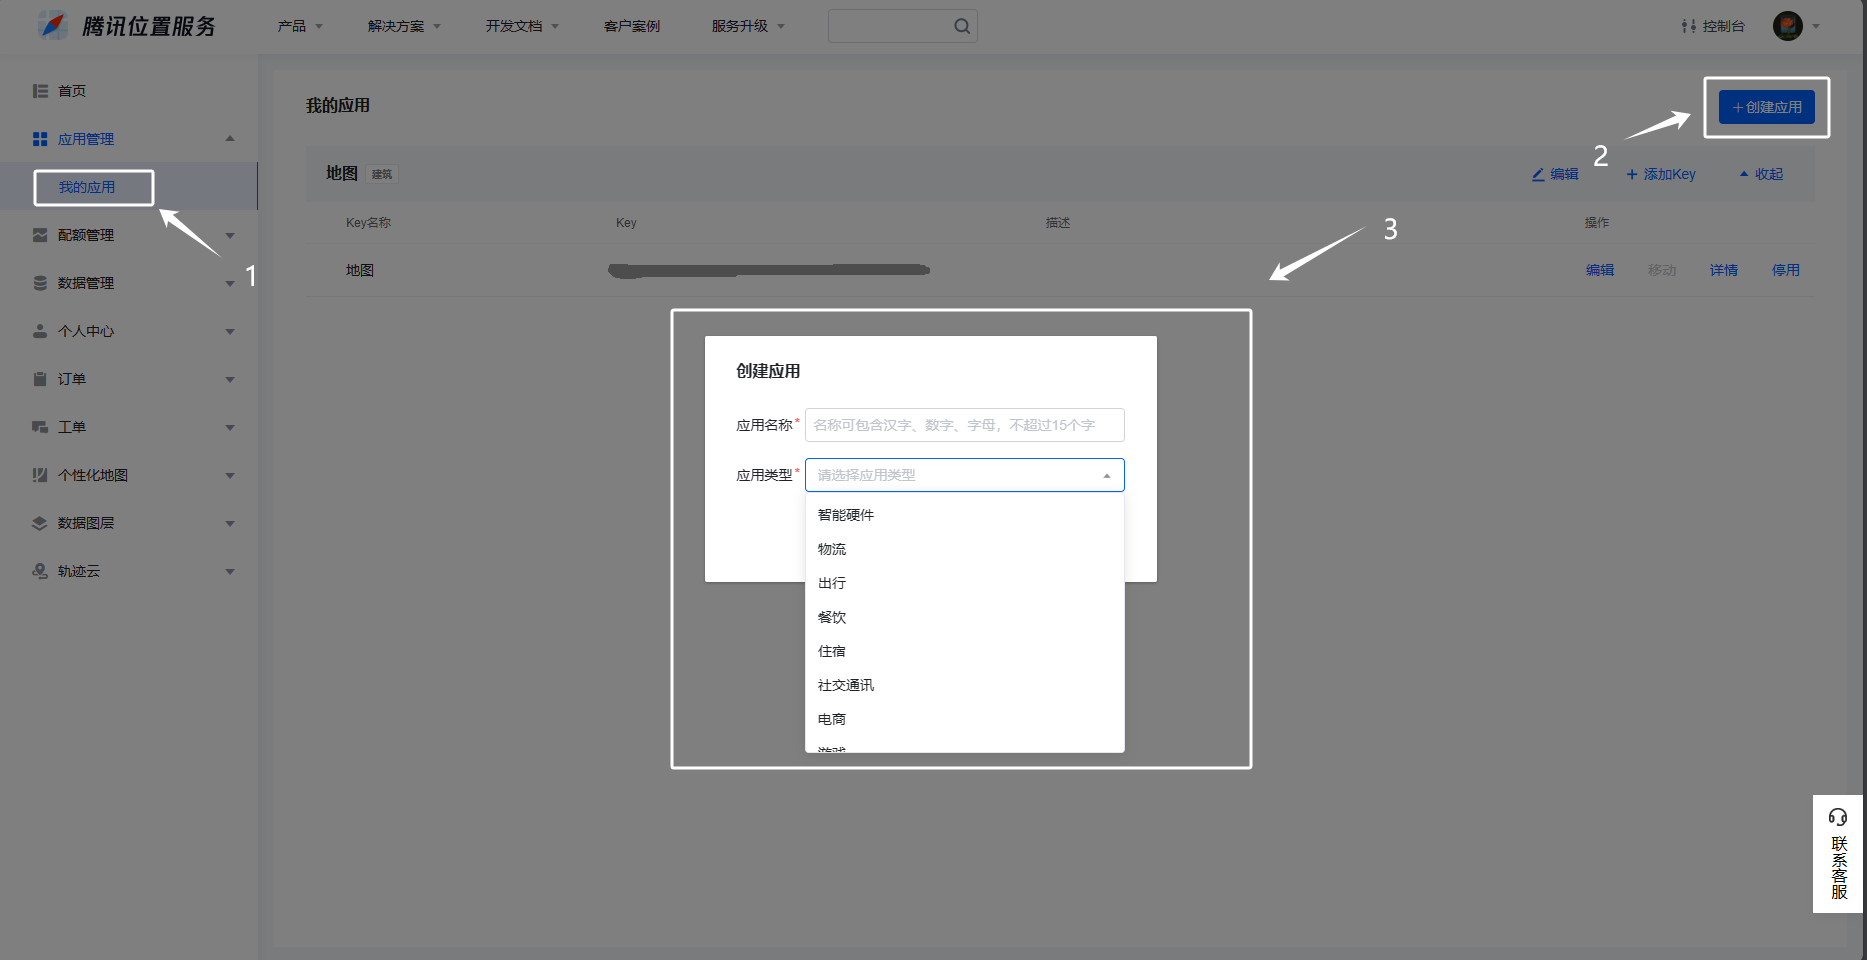
点击创建新应用,至于里面的内容就是随便填都可以:
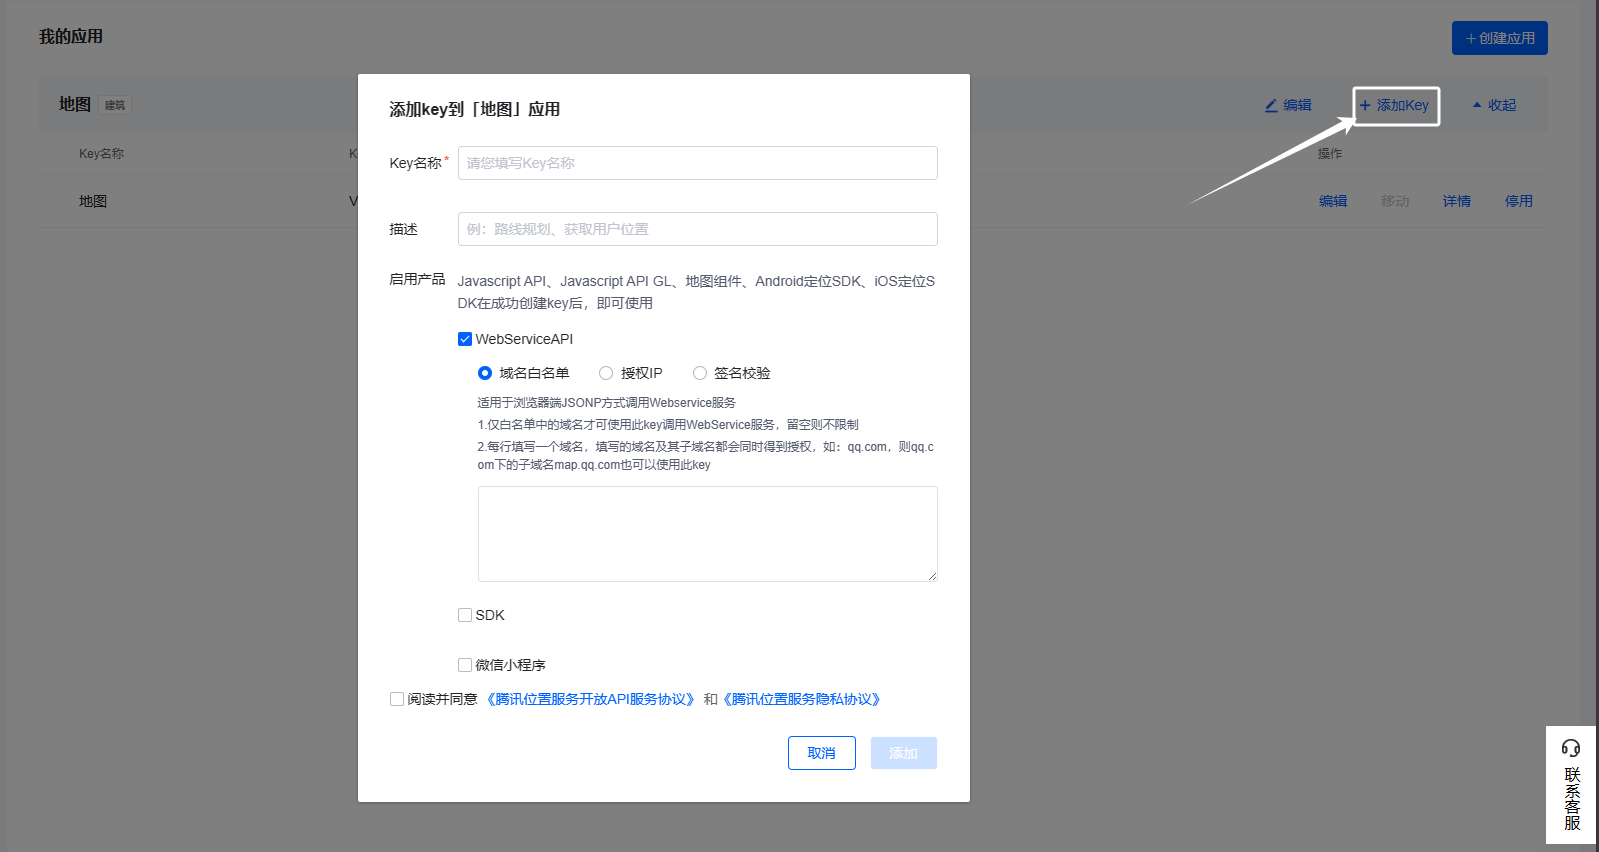
点击添加 Key ,创建你的 Key 值,我们后面都需要使用,具体你是哪个开发平台就勾选哪一个:
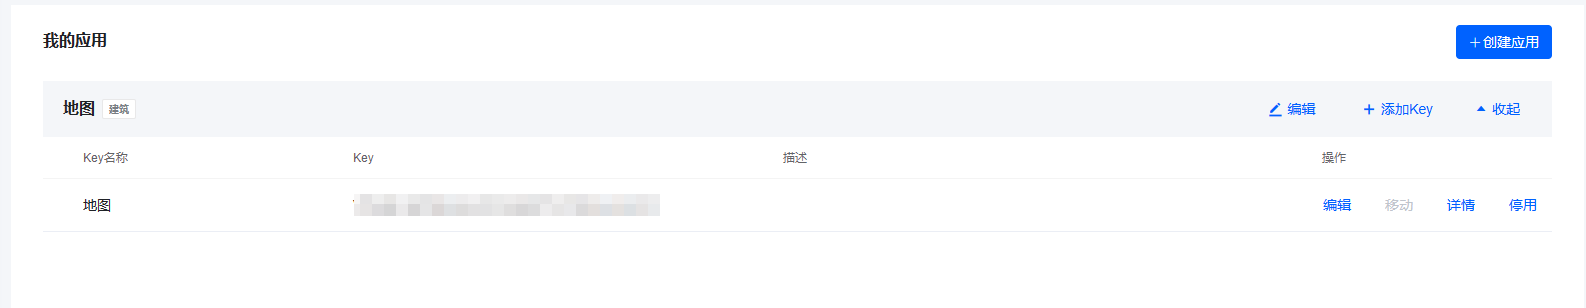
下面是最后生成的 Key。我使用的是动态导入,但是也有人使用的是本地导入下载的SDK,大家可以尝试一下哪个更适合你的开发。
三、导入以及使用
以下内容较多篇幅较长,大家可以根据目录选择阅读,我会结合官方文档以及参考文档详细说明每一个方法的使用以及具体实现,但最好还是按顺序看下去。
1、参考博客与文档以及相关地址
腾讯官方文档:地址
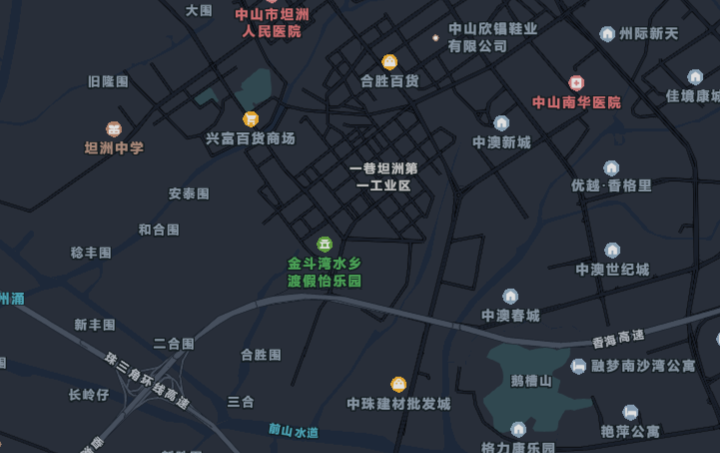
2、导入地图
这个导入方法和高德地图的导入基本一致,定义一个全局的地图实例供我们调用腾讯地图的API。
效果
代码
<!-- 导入地图 -->
<template>
	<view class="content">
		<view class="wrapperBox">
			<view id="wrapper"></view>
		</view>
	</view>
</template>

<script>
	let mapObj = null; // 生成组件实例

	window.mapInit = function() { // 挂载地图实例
		mapObj = new TMap.Map("wrapper", {
			center: new TMap.LatLng(22.254515, 113.469689), // 地图初始坐标
			zoom: 14, // 缩放等级
			mapStyleId: 'style1', // 地图样式
			zoomControl: false, // 设置是否启用缩放控件
		});

		mapObj.on("click", function(evt) { // 地图全局事件
            // 这里是通过获取地图点击的位置,将该位置移动至中心点,后面会用上
			mapObj.setCenter(new TMap.LatLng(evt.latLng.getLat().toFixed(6), evt.latLng.getLng().toFixed(6)))
		})
	}

	export default {
		data() {
			return {
				key: '00000-00000-00000-00000-00000-00000', // 换你自己的key
			}
		},
		onLoad() {
			// #ifdef H5
			this.loadScrpit();
			// #endif
		},
		created() {},
		methods: {
			// 初始化
			loadScrpit() { // 挂载js
				var script = document.createElement('script');
				script.src =
					`https://map.qq.com/api/gljs?v=1.exp&key=${this.key}&libraries=visualization&callback=mapInit`;
				document.body.appendChild(script);
			},
		}
	}
</script>

<style>
	.content {
		position: fixed;
		top: 0;
		left: 0;
		display: flex;
		flex-direction: column;
		align-items: center;
		justify-content: center;
	}

	.wrapperBox {
		position: relative;
		width: 100vw;
		height: 100vh;
		z-index: 1;
	}

	#wrapper {
		z-index: 20;
		width: 120vw;
		height: 120vh;
		top: -10vh;
		left: -10vw;
		position: absolute;
	}
</style>
代码讲解
首先是在 onLoad() 在页面加载阶段内调用动态挂载函数,熟悉原生 JavaScript 的朋友都应该可以明白这是一个创建 <script></script> 标签,并把它插入 body 内的操作。关键是在标签的属性上,我们需要传入 Key 值和回调函数。
📌 此处的回调函数可以取任意名,但需要注意的是在
window.function()接收函数时需要同名,否则无法成功接收回调函数。
mapObj = new TMap.Map("wrapper", {
	center: new TMap.LatLng(Longitude, Latitude), // 地图初始坐标
	zoom: 14, // 缩放等级
	mapStyleId: 'style1', // 地图样式
	zoomControl: false, // 设置是否启用缩放控件
});
在本文中我使用 mapObj 全局存储地图的实例, new TMap.Map('id',Object) 的参数:
-
id:地图将会渲染在同名 id 的 view 或 div 内。
📍 需要注意的是,如果你想要在地图上自定义一些控件或展示框,最好不在该标签内添加,因为当你定位到一个新的地点时,它将刷新整个地图,你所定义的界面将会全部消失。正确的做法应该是建立一个同级的标签,通过 z-index 属性置于地图的上层。
<template> <view> <!-- 地图底框 --> <view id="wrapper"></view> <!-- 你的界面 --> <view id="box"></view> </view> </template> -
Object:你可以通过该对象决定你的地图需要哪些图层与初始定位,还有缩放的级数等功能。
-
center: new TMap.LatLng(22.254515, 113.469689) ,设置中心点的位置;
-
zoom:初始地图的缩放级数,同样也是根据你的业务需求设置就好了;
-
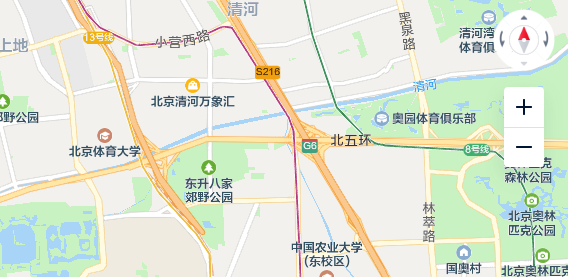
zoomControl:这个控件看个人的业务需求,不关就会是这个效果:
-
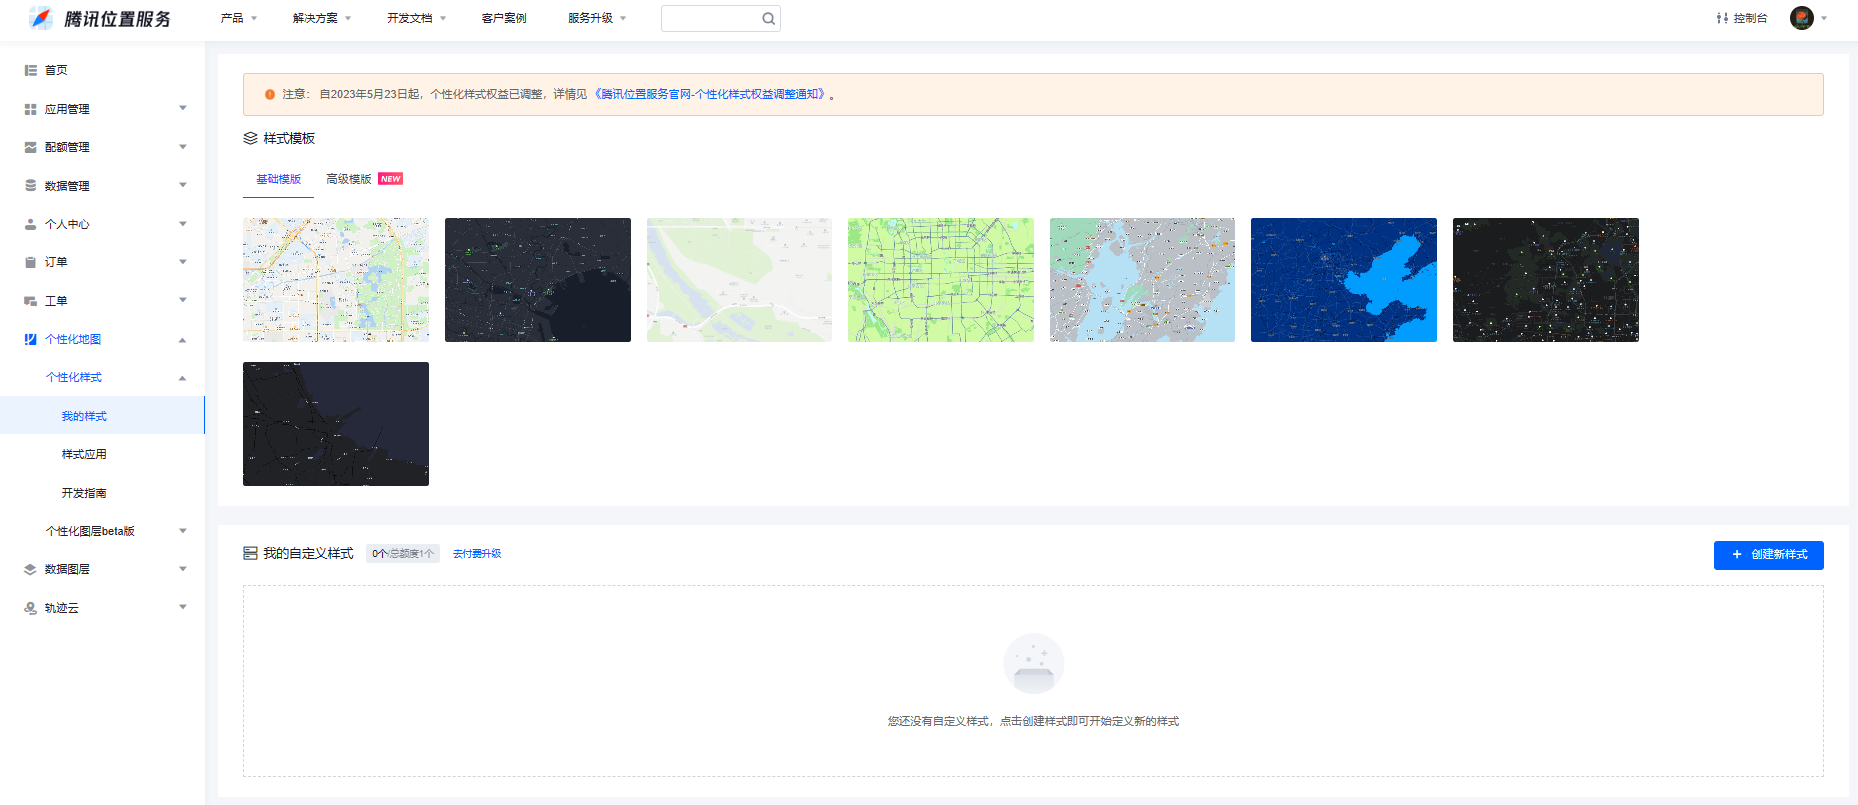
mapStyleId:style1,这个设置的是地图样式,需要先在腾讯位置服务配置相关的样式文件:
进入该页面选择基础的样式模板(免费),高级模板就需要付费了
点击绑定相关的样式,这里需要你选择是使用哪个的,然后绑定到key上

已绑定的样式就会显示在这个的地方
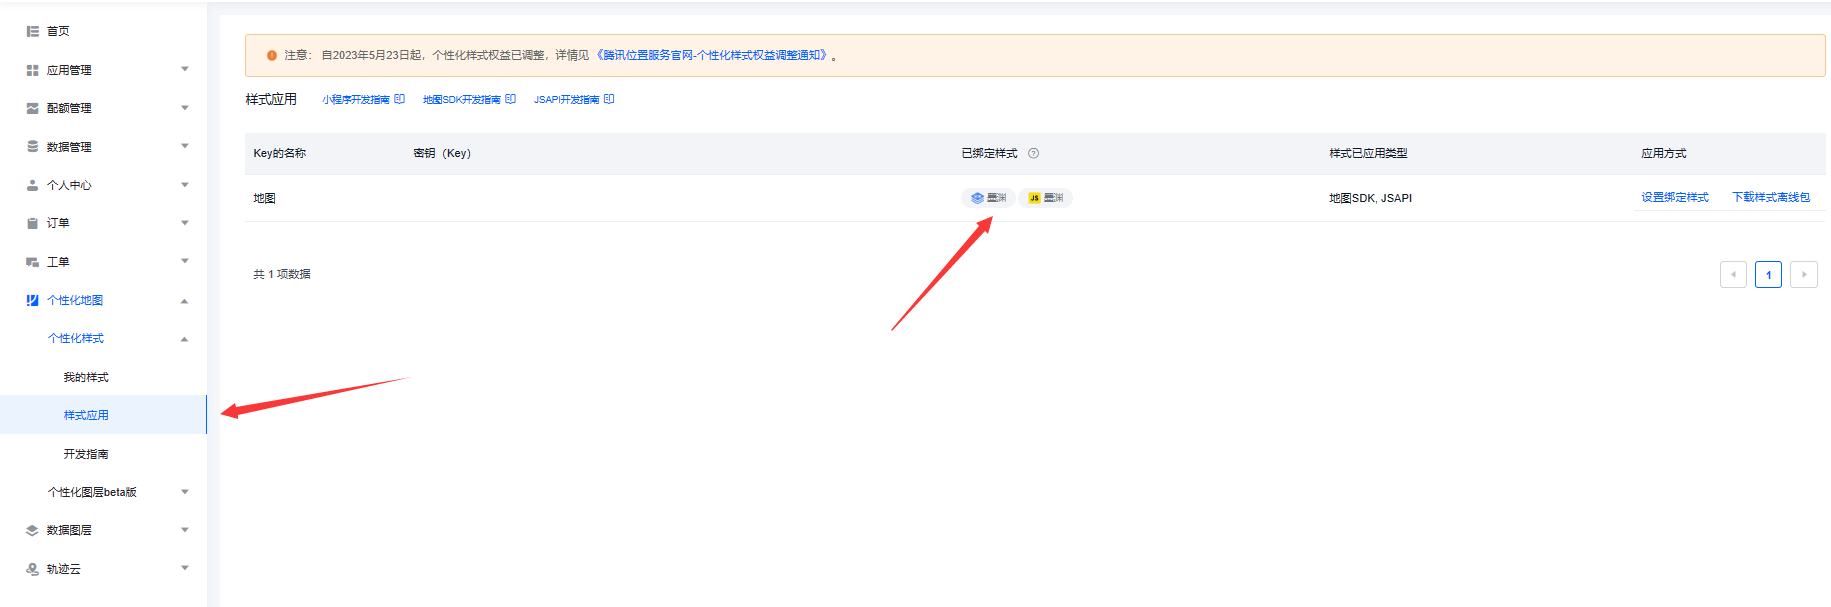
鼠标移动上去即可查看对应的样式名,也就是上文对应的
style1: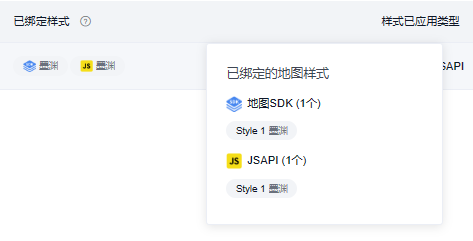
-
3、点击坐标定位
这里点击和高德的定位不太一样,设置起来相对简单一点,只需要传入坐标点。一般需要和标点一起使用,在下文会再做讲解。
mapObj.setCenter(new TMap.LatLng(Latitude, Longitude))
代码讲解
腾讯地图提供了 setCenter() 方法可供设置中心点,不会像高德一样重置标点和信息窗体,无需重新挂载。
4、自定义标点
自定义标点主要是定义图标的图像以及大小、图片地址等参数。需要注意的是,标点自定义必须在地图实例挂载之后,否则无法定义成功。自定义标点信息成功后再挂载标点,本文使用了多个标点图标,可以根据同样的方法设置,最后实现的就是下图效果。
效果

代码
<!-- 添加标点 -->
<template>
	<view class="content">
		<view class="wrapperBox">
			<view id="wrapper"></view>
		</view>
	</view>
</template>

<script>
	let mapObj = null; // 生成地图实例
    // ------------------------------ 更新内容1 ----------------------------- //
	// 创建多个标点
	let agriculture = []; // 生成图标实例1
	let property = []; // 生成图标实例2
	let construction = []; // 生成图标实例3
	let noRented = []; // 生成图标实例4
	let marker = []; // 生成标点实例
    // ---------------------------------------------------------------------- //

	window.mapInit = function() { // 挂载地图实例
		mapObj = new TMap.Map("wrapper", {
			center: new TMap.LatLng(22.254515, 113.469689), // 地图初始坐标
			zoom: 14, // 缩放等级
			mapStyleId: 'style1', // 地图样式
			zoomControl: false, // 设置是否启用缩放控件
		});

		mapObj.on("click", function(evt) { // 地图全局事件
			mapObj.setCenter(new TMap.LatLng(evt.latLng.getLat().toFixed(6), evt.latLng.getLng().toFixed(6)))
		})
	}

	export default {
		data() {
			return {
				key: 'OB4BZ-D4W3U-B7VVO-4PJWW-6TKDJ-WPB77',
                // ------------------------------ 更新内容2 ----------------------------- //
				iconItem: [{ // 模拟数据
					name: 'agriculture', // 样式类型
					src: require("@/static/dot-01.png"), // 图片路径
					position: [22.227959, 113.459589], // 标点中心坐标
					markerUrl: require("@/static/dot-01.png"), // 标点图片样式
				}, {
					name: 'property',
					src: require("@/static/dot-02.png"),
					position: [22.253496, 113.477076],
					markerUrl: require("@/static/dot-02.png"),
				}, {
					name: 'construction',
					src: require("@/static/dot-03.png"),
					position: [22.237834, 113.463987],
					markerUrl: require("@/static/dot-03.png"),
				}, {
					name: 'noRented',
					src: require("@/static/dot-04.png"),
					position: [22.253692, 113.498333],
					markerUrl: require("@/static/dot-04.png"),
				}]
                // ---------------------------------------------------------------------- //
			}
		},
		onLoad() {
			// #ifdef H5
			this.loadScrpit();
			// #endif

            // ------------------------------ 更新内容3 ----------------------------- //
			let time = setInterval(() => { // 等待地图挂载
				if (mapObj != null) {
					clearInterval(time);
					this.setIcon(); // 挂载坐标图片信息
				}
			}, 100)
            // ---------------------------------------------------------------------- //
		},
		methods: {
			// 初始化
			loadScrpit() { // 挂载js
				var script = document.createElement('script');
				script.src =
					`https://map.qq.com/api/gljs?v=1.exp&key=${this.key}&libraries=visualization&callback=mapInit`;
				document.body.appendChild(script);
			},
            // ------------------------------ 更新内容4 ----------------------------- //
			setIcon() { // 创建标点图标
				let that = this;
				// 创建 AMap.Icon 实例
				agriculture = new TMap.MarkerStyle({
					"width": 75, // 定义宽,单位:PX
					"height": 90, // 定义高,单位:PX
					"src": that.iconItem[0].markerUrl, // 标点图片链接:本地图片
				})
				property = new TMap.MarkerStyle({
					"width": 75,
					"height": 90,
					"src": that.iconItem[1].markerUrl,
				})
				construction = new TMap.MarkerStyle({
					"width": 75,
					"height": 90,
					"src": that.iconItem[2].markerUrl,
				})
				noRented = new TMap.MarkerStyle({
					"width": 75,
					"height": 90,
					"src": that.iconItem[3].markerUrl,
				})
				this.setMapMarker(); // 调用创建标点
			},
			setMapMarker() { // 创建标点实例
				let geometries = [];

				for (let i = 0; i < this.iconItem.length; i++) {
					let obj = { // 点标记数据
						"id": i, //点标记唯一标识,后续如果有删除、修改位置等操作,都需要此id
						"styleId": this.iconItem[i].name, // 对应标点实例的style的名称
						"position": new TMap.LatLng(this.iconItem[i].position[0], this.iconItem[i].position[1]), // 标点的坐标
						"properties": { // 自定义属性
							"title": this.iconItem[i].name
						}
					}
					geometries.push(obj);
				}

				marker = new TMap.MultiMarker({ // 构造函数创建标点实例
					id: 'marker-layer', // 定义的ID名称
					map: mapObj, // 挂载的地图实例
					styles: { // 加入标点的样式
						"agriculture": agriculture,
						"property": property,
						"construction": construction,
						"noRented": noRented,
					},
					geometries: geometries // 点标记数据数组
				});
			},
            // ---------------------------------------------------------------------- //
		}
	}
</script>

<style>
	.content {
		position: fixed;
		top: 0;
		left: 0;
		display: flex;
		flex-direction: column;
		align-items: center;
		justify-content: center;
	}

	.wrapperBox {
		position: relative;
		width: 100vw;
		height: 100vh;
		z-index: 1;
	}

	#wrapper {
		z-index: 20;
		width: 120vw;
		height: 120vh;
		top: -10vh;
		left: -10vw;
		position: absolute;
	}
</style>
代码讲解
更新内容1:本地图创建了多个标点样式
agriculturepropertyconstructionnoRented,在创建标点时对应相应的样式。创建marker在下文挂载标点实例。
// 创建多个标点
let agriculture = []; // 生成图标实例1
let property = []; // 生成图标实例2
let construction = []; // 生成图标实例3
let noRented = []; // 生成图标实例4
let marker = []; // 生成标点实例
更新内容2:此处为后台返回的模拟数据,有需要可参考该数据。
iconItem: [{ // 模拟数据
	name: 'agriculture', // 样式类型
	src: require("@/static/dot-01.png"), // 图片路径
	position: [22.227959, 113.459589], // 标点中心坐标
	markerUrl: require("@/static/dot-01.png"), // 标点图片样式
}]
更新内容3:在
onLoad()里设置定时器监听地图是否挂载成功,没挂载地图实例前无法挂载标点图片与坐标标点。一旦监听到地图组件挂载便取消对应的定时器监听。
let time = setInterval(() => { // 等待地图挂载
	if (mapObj != null) {
		clearInterval(time);
		this.setIcon(); // 挂载坐标图片信息
	}
}, 100)
更新内容4:
setIcon(): 设置自定义标点图片的参数,具体的参数看下面介绍,按照对应的测试一下就可以调整为自己想要的效果了。src这里的地址我是使用的模拟数据中的地址,实际使用需要更换一下。
setMapMarker():geometries点标记数据数组,此处和高德地图不一致,无需循环生成单个标点,而是通过一个数组直接生成所有的标点。但标点数据的参数需和以下对象一致,具体的的参考注释,没有描述清楚可在评论指出,我会持续更新。
geometries的数据格式如下:geometries = [{ // 点标记数据 "id": i, //点标记唯一标识,后续如果有删除、修改位置等操作,都需要此id "styleId": this.iconItem[i].name, // 对应标点实例的style的名称 "position": new TMap.LatLng(this.iconItem[i].position[0], this.iconItem[i].position[1]), // 标点的坐标 "properties": { // 自定义属性,可以根据属性获取参数 "title": this.iconItem[i].name }]
id:这里我选择使用了循环的 i 值,当然你们可以使用后台返回标点本身的id。styleId:这里给的是每个标点对应的标点样式名,需要提前规范好样式名称,后台返回数据的时候带上方便处理。position:这里有个比较有意思的事,腾讯地图的坐标参数和高德的坐标参数是相反的,但腾讯地图又通过这个new TMap.LatLng()方法把坐标倒转过来👈🤣,大家记得看清楚高德和腾讯的经纬度是相反的。properties:这个自定义属性就看你需要什么,你就直接定义了塞进去就好。
setIcon() { // 创建标点图标
	let that = this;
	// 创建 AMap.Icon 实例
	agriculture = new TMap.MarkerStyle({
		"width": 75, // 定义宽,单位:PX
		"height": 90, // 定义高,单位:PX
		"src": that.iconItem[0].markerUrl, // 标点图片链接:本地图片
	})
},
setMapMarker() { // 创建标点实例
	let geometries = [];

	for (let i = 0; i < this.iconItem.length; i++) {
		let obj = { // 点标记数据
			"id": i, //点标记唯一标识,后续如果有删除、修改位置等操作,都需要此id
			"styleId": this.iconItem[i].name, // 对应标点实例的style的名称
			"position": new TMap.LatLng(this.iconItem[i].position[0], this.iconItem[i].position[1]), 			// 标点的坐标
			"properties": { // 自定义属性,可以根据属性获取参数
				"title": this.iconItem[i].name
			}
		}
		geometries.push(obj);
	}

	marker = new TMap.MultiMarker({ // 构造函数创建标点实例
		id: 'marker-layer', // 定义的ID名称
		map: mapObj, // 挂载的地图实例
		styles: { // 加入标点的样式
			"agriculture": agriculture,
			"property": property,
			"construction": construction,
			"noRented": noRented,
		},
		geometries: geometries // 点标记数据数组
	});
},
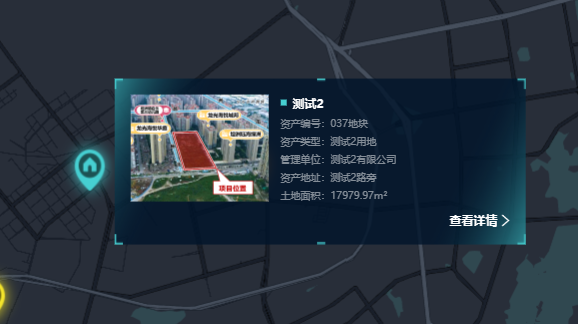
5、自定义信息框体
实现信息框体功能,实际上就是为标点绑定一个点击事件,点击后再对相应的标点进行渲染。难点主要在如何渲染信息窗体数据并且在信息窗体内绑定点击事件。
效果
代码
<!-- 自定义信息窗体 -->
<template>
	<view class="content">
		<view class="wrapperBox" style="position: relative;width: 100vw;height: 100vh;z-index: 1;">
			<view style="width: 120vw;height: 120vh;top: -10vh;left: -10vw;position: absolute;" id="wrapper"></view>
		</view>
	</view>
</template>

<script>
	let mapObj = null; // 生成组件实例
	let area = null; // 生成区域
	let agriculture = []; // 生成图标实例
	let property = []; // 生成图标实例
	let construction = []; // 生成图标实例
	let noRented = []; // 生成图标实例
	let marker = []; // 生成标点实例

    // ------------------------------ 更新内容1 ----------------------------- //
	let infoWindow = null; // 自定义信息窗体
	let isShowText = false; // 窗体是否打开
    // ---------------------------------------------------------------------- //

	window.mapInit = function() { // 挂载地图实例
		mapObj = new TMap.Map("wrapper", {
			center: new TMap.LatLng(22.254515, 113.469689), // 地图初始坐标
			zoom: 14, // 缩放等级
			mapStyleId: 'style1', // 地图样式
			baseMap: { //设置底图样式
				type: 'vector', //设置底图为矢量底图
				features: [ //设置矢量底图要素类型
					'base',
					'point'
				]
			},
			zoomControl: false, // 设置是否启用缩放控件
		});

        // ------------------------------ 更新内容2 ----------------------------- //
        infoWindow = new TMap.InfoWindow({ // 设置信息窗体
			map: mapObj, // 挂载的地图实例
			enableCustom: true, // 是否自定义窗体
			position: new TMap.LatLng(22.254515, 113.469689), // 初始标点坐标
			offset: { // 信息窗体的偏移量
				y: 30,
				x: 230
			},
			content: `<div style="width: 379px;height: 134px;padding:16px;"></div>`, // 必须设置一个底边的dom,否则会出现白边
		});

		mapObj.removeControl(TMap.constants.DEFAULT_CONTROL_ID.ZOOM);

		mapObj.on("click", function(evt) { // 地图全局事件
			//设置infoWindow
			if (isShowText) { // 控制是否打开窗体
				isShowText = false;
			} else {
				infoWindow.close();
			}
		})
        // ---------------------------------------------------------------------- //
	}

	export default {
		data() {
			return {
				key: 'OB4BZ-D4W3U-B7VVO-4PJWW-6TKDJ-WPB77',
                // ------------------------------ 更新内容2 ----------------------------- //
				iconItem: [{
					name: 'agriculture',
					src: require("@/static/dot-01.png"),
					position: [22.227959, 113.459589],
					markerList: [
						[
							22.22839, 113.460787, 22.227644, 113.460801, 22.227582, 113.45945, 22.228346,
							113.459423
						]
					],
					fillColor: 'rgba(35, 181, 29, 0.6)',
					fillColorHover: 'rgba(35, 181, 29, 0.8)',
					strokeColor: 'rgba(35, 181, 29, 1)',
					markerUrl: require("@/static/dot-01.png"),
					background: require("@/static/bg-01.png"),
					titleUrl: require("@/static/title-01.png"),
				}, {
					name: 'property',
					src: require("@/static/dot-02.png"),
					position: [22.253496, 113.477076],
					markerList: [
						[
							22.253749, 113.475984, 22.254632, 113.477205, 22.253963, 113.477805, 22.252339,
							113.477209
						]
					],
					fillColor: 'rgba(70, 207, 209, .6)',
					fillColorHover: 'rgba(70, 207, 209, .8)',
					strokeColor: 'rgba(70, 207, 209, 1)',
					markerUrl: require("@/static/dot-02.png"),
					background: require("@/static/bg-02.png"),
					titleUrl: require("@/static/title-02.png"),
				}, {
					name: 'construction',
					src: require("@/static/dot-03.png"),
					position: [22.237834, 113.463987],
					markerList: [
						[
							22.23646, 113.461873, 22.23978, 113.463196, 22.238951, 113.465657, 22.236101,
							113.464483
						]
					],
					fillColor: 'rgba(243, 228, 43, .6)',
					fillColorHover: 'rgba(243, 228, 43, .8)',
					strokeColor: 'rgba(243, 228, 43, 1)',
					markerUrl: require("@/static/dot-03.png"),
					background: require("@/static/bg-03.png"),
					titleUrl: require("@/static/title-03.png"),
				}, {
					name: 'noRented',
					src: require("@/static/dot-04.png"),
					position: [22.253692, 113.498333],
					markerList: [
						[
							22.255189, 113.497027, 22.255364, 113.499003, 22.255099, 113.500223, 22.25156,
							113.498393, 22.252291, 113.49612, 22.254841, 113.495819
						]
					],
					fillColor: 'rgba(253, 143, 33, .6)',
					fillColorHover: 'rgba(253, 143, 33, .8)',
					strokeColor: 'rgba(253, 143, 33, 1)',
					markerUrl: require("@/static/dot-04.png"),
					background: require("@/static/bg-04.png"),
					titleUrl: require("@/static/title-04.png"),
				}]
                // ---------------------------------------------------------------------- //
			}
		},
		onLoad() {
			...
		},
         // ------------------------------ 更新内容3 ----------------------------- //
		created() {
			let that = this;
			window.getParkDetail = function(res) { // 设置信息窗体触发事件
				if (res == 0) {
					that.isDetail1 = true;
				}
				if (res == 2) {
					that.isDetail2 = true;
				}
			};
		},
        // ---------------------------------------------------------------------- //
		methods: {
			// 初始化
			loadScrpit() { // 挂载js
				...
			},
			setIcon() { // 创建标点图标
				...
			},
             // ------------------------------ 更新内容4 ----------------------------- //
			setMapMarker() { // 创建标点实例
				...

				let that = this;

				marker.on("click", function(evt) { // 给标点绑定事件打开信息窗体
					that.setInfoWindow(evt)
				})
			},
			setInfoWindow(evt) {
				let that = this;
				// 信息窗体模拟数据,需要使用接口
				let imageIcon = require("@/static/icon-22.png");
				let background = this.iconItem[0].background;
				let titleUrl = this.iconItem[0].titleUrl;
				let index = 0;
				let titleName = '';
				let assetName = '';
				let assetNumber = '';
				let managementUnit = '';
				let assetAddress = '';
				let landArea = '';
				let backgroundColor = '';

				//设置infoWindow
				infoWindow.open(); //打开信息窗
				infoWindow.setPosition(evt.geometry.position); // 根据当前坐标设置信息窗位置
				// console.log(evt.geometry.position);
				// 设置点击后的地图偏移的中心点
				mapObj.setCenter(new TMap.LatLng((evt.geometry.position.lat + 0.01), (evt.geometry.position
					.lng + 0.02)))

				if (evt.geometry.properties.title == 'agriculture') { // 根据不同的类型设置标点信息,需要接口代替
					background = that.iconItem[0].background;
					titleUrl = that.iconItem[0].titleUrl;
					index = 0;
					titleName = '测试1';
					assetName = '农地';
					assetNumber = '076地块';
					managementUnit = '测试1发展有限公司';
					assetAddress = '测试1地块';
					landArea = '240072.40m²';
					backgroundColor = 'rgba(35, 181, 29, 1)';
				}
				if (evt.geometry.properties.title == 'property') {
					background = that.iconItem[1].background;
					titleUrl = that.iconItem[1].titleUrl;
					index = 1;
					titleName = '测试2';
					assetName = '测试2用地';
					assetNumber = '037地块';
					managementUnit = '测试2有限公司';
					assetAddress = '测试2路旁';
					landArea = '17979.97m²';
					backgroundColor = 'rgba(70, 207, 209, 1)';
				}
				if (evt.geometry.properties.title == 'construction') {
					background = that.iconItem[2].background;
					titleUrl = that.iconItem[2].titleUrl;
					index = 2;
					titleName = '测试3';
					assetName = '测试3用地';
					assetNumber = '044地块';
					managementUnit = '测试3有限公司';
					assetAddress = '测试3路旁';
					landArea = '14488.01m²';
					backgroundColor = 'rgba(243, 228, 43, 1)';
				}
				if (evt.geometry.properties.title == 'noRented') {
					background = that.iconItem[3].background;
					titleUrl = that.iconItem[3].titleUrl;
					index = 3;
					titleName = '测试3';
					assetName = '测试3用地';
					assetNumber = '099地块';
					managementUnit = '测试3有限公司';
					assetAddress = '测试3路旁';
					landArea = '30667.61m²';
					backgroundColor = 'rgba(253, 143, 33, 1)';
				}
				// 设置信息窗体的样式,通过模板字符串赋值
				infoWindow.setContent(`
				<div style="width: 379px;height: 134px;position:relative;padding:16px;z-index:90;">
					<div style="">
						<div style="display: flex;align-items: center;justify-content: flex-start;">
							<image style="width:138px;height:107px;" src="${titleUrl}"></image>
							<div style="display: flex;align-items: flex-start;justify-content: space-between;flex-flow: column;height:107px;margin-left:12px">
								<div style="display: flex;align-items: center;justify-content: flex-start;width:220px">
									<div style="width: 6px;height: 6px;background: ${backgroundColor};margin-right:6px;"></div>
									<div style="font-size: 12px;font-family: PingFang SC-Semibold, PingFang SC;font-weight: 600;color: #FFFFFF;">${titleName}</div>
								</div>
								<div style="display: flex;align-items: center;justify-content: flex-start;width:220px;color:rgba(255, 255, 255, .5);font-weight: 400;font-size: 10px;">
									<div>资产编号:</div><div>${assetNumber}</div>
								</div>
								<div style="display: flex;align-items: center;justify-content: flex-start;width:220px;color:rgba(255, 255, 255, .5);font-weight: 400;font-size: 10px;">
									<div>资产类型:</div><div>${assetName}</div>
								</div>
								<div style="display: flex;align-items: center;justify-content: flex-start;width:220px;color:rgba(255, 255, 255, .5);font-weight: 400;font-size: 10px;">
									<div>管理单位:</div><div style="width: 160px;display: block;	overflow: hidden;text-overflow: ellipsis;white-space: nowrap;">${managementUnit}</div>
								</div>
								<div style="display: flex;align-items: center;justify-content: flex-start;width:220px;color:rgba(255, 255, 255, .5);font-weight: 400;font-size: 10px;">
									<div>资产地址:</div><div>${assetAddress}</div>
								</div>
								<div style="display: flex;align-items: center;justify-content: flex-start;width:220px;color:rgba(255, 255, 255, .5);font-weight: 400;font-size: 10px;">
									<div>土地面积:</div><div>${landArea}</div>
								</div>
							</div>
						</div>
						<div οnclick="(function (){this.window.getParkDetail(${index});isShowText=${true};})()"  style="cursor:pointer;margin-top:10px;display: flex;align-items: center;justify-content: flex-end;font-size: 12px;font-family: PingFang SC-Medium, PingFang SC;font-weight: 600;color: #FFFFFF;">
							<div>查看详情</div>
							<image src="${imageIcon}" style="width:8px;height:12px;margin-left:4px;margin-top:1px;"></image>
						</div>
					</div>
					<image src="${background}" style="position:absolute;width:100%;height:100%;top:0;left:0;z-index: -1;"></image>
				</div>`, )
				isShowText = true; // 设置打开
			},
             // ---------------------------------------------------------------------- //
		}
	}
</script>

<style>
	.content {
		position: fixed;
		top: 0;
		left: 0;
		display: flex;
		flex-direction: column;
		align-items: center;
		justify-content: center;
	}
	#wrapper {
		z-index: 20;
	}
	.content .tmap-scale-text {
		display: none;
	}
	.content .tmap-scale-control {
		display: none;
	}
</style>
代码讲解
更新内容1:创建全局的的实例
infoWindow,也是只要挂载一次即可。主要用于信息窗体的打开与关闭。
isShowText是用于判断当前的窗体是否打开,在点击或移动地图时关闭窗体。
let infoWindow = null; // 自定义信息窗体
let isShowText = false; // 窗体是否打开
更新内容2:
mapObj是地图实例,可以给它绑定点击事件,根据isShowText的状态来判定是否开启了窗体。infoWindow.close()方法用于关闭当前窗体。
removeControl():是移除控件的方法,这里移除的是缩放组件。
mapObj.removeControl(TMap.constants.DEFAULT_CONTROL_ID.ZOOM);

mapObj.on("click", function(evt) { // 地图全局事件
	//设置infoWindow
	if (isShowText) { // 控制是否打开窗体
		isShowText = false;
	} else {
		infoWindow.close();
	}
})
窗体的方法调用不用等待
new TMap.InfoWindow()创建实例,因为没有也触发不了关闭🤣。
infoWindow:可以在地图后就挂载,且只用挂载一次,不同的信息窗体样式可以通过下文的infoWindow.setContent()方法重新定义。
map:挂载的地图实例;enableCustom:如果用的是自定义的窗体一定需要开启;position:这个参数是必传的,不然无法显示信息窗体;offset:这个标点是相对于所点的标点坐标的偏移量,看需求是在哪个位置展示;content:必须设置一个底层的dom边框,否则会启用默认的样式,导致样式边框出现白边。而且通过infoWindow.setContent()方法也无法消除。
infoWindow = new TMap.InfoWindow({ // 设置信息窗体
	map: mapObj, // 挂载的地图实例
	enableCustom: true, // 是否自定义窗体
	position: new TMap.LatLng(22.254515, 113.469689), // 初始标点坐标
	offset: { // 信息窗体的偏移量
		y: 30,
		x: 230
	},
	content: `<div style="width: 379px;height: 134px;padding:16px;"></div>`, // 必须设置一个底边的dom,否则会出现白边
});
更新内容3:这个方法是直接挂载在window对象上,这样才可以被信息窗体内的事件所触发。主要用于关闭当前的信息窗体、打开某个界面或是跳转到某个链接网址。
res内携带的可以是对应信息窗体内的一些参数,用做区分不同的窗体类型对应的详情页面。需要的操作就写在这里面
getParkDetail()这个函数名不是固定的,你可以根据自己的业务功能重新命名。
created() {
	let that = this;
	window.getParkDetail = function(res) { // 设置信息窗体触发事件
		if (res == 0) {
			that.isDetail1 = true;
		}
		if (res == 2) {
			that.isDetail2 = true;
		}
	};
},
更新内容4:模拟数据部分就不详细描述了,到时候根据接口数据返回做调整即可。当创建了标点实例后即可为标点绑定点击事件。
evt内携带了标点的全部信息,用于在信息窗体内展现数据。
let that = this;
marker.on("click", function(evt) { // 给标点绑定事件打开信息窗体
	that.setInfoWindow(evt) // 信息窗体处理函数
})
infoWindow.open():每次点击标点时触发这个方法,打开信息窗体。infoWindow.setPosition():根据当前坐标设置信息窗体位置,evt.geometry.position就是携带过来的标点坐标。mapObj.setCenter():这里有个需求就是点击信息标点后移动到屏幕的中心,所以使用了这个方法,如果你们的需求没有的话,不需要这个也是可以的。
//设置infoWindow
infoWindow.open(); //打开信息窗
infoWindow.setPosition(evt.geometry.position); // 根据当前坐标设置信息窗位置

// 设置点击后的地图偏移的中心点
mapObj.setCenter(new TMap.LatLng((evt.geometry.position.lat + 0.01), (evt.geometry.position
					.lng + 0.02)))
infoWindow.setContent()的内容:
infoWindow.setContent(`
<div style="width: 379px;height: 134px;">
	<div οnclick="(function (){this.window.getParkDetail(${index});isShowText=${true};})()">
		<div>查看详情</div>
		<image src="${imageIcon}"></image>
	</div>
</div>`)
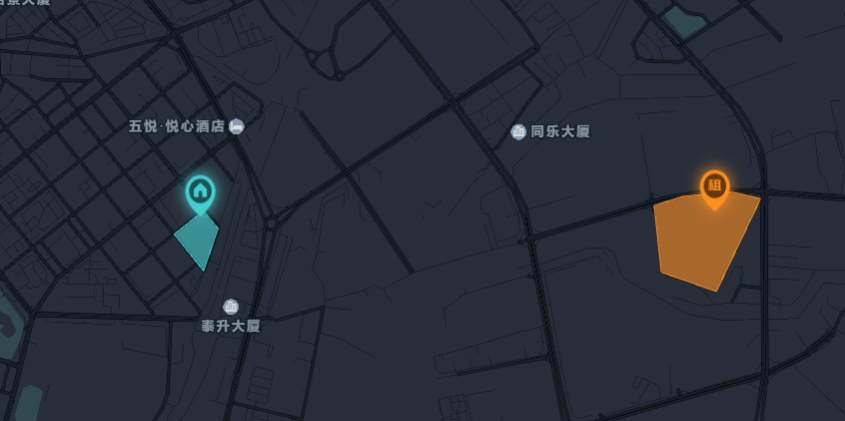
6、区域绘制
区域绘制和标点与信息窗体不一样,后两者的关系更为紧密,需要绑定触发,而区域绘制是独立出来仅受区域坐标影响,可以适当分出一个接口用于区域绘制。本文为了方便介绍把数据处理在了一起,请自行分辨。
效果
代码
<!-- 绘制区域轮廓 -->
<template>
	<view class="content">
		<view class="wrapperBox" style="position: relative;width: 100vw;height: 100vh;z-index: 1;">
			<view style="width: 120vw;height: 120vh;top: -10vh;left: -10vw;position: absolute;" id="wrapper"></view>
		</view>
	</view>
</template>

<script>
	let mapObj = null; // 生成组件实例
	let area = null; // 生成区域
	let agriculture = []; // 生成图标实例
	let property = []; // 生成图标实例
	let construction = []; // 生成图标实例
	let noRented = []; // 生成图标实例
	let marker = []; // 生成标点实例
	let infoWindow = null; // 自定义信息窗体
	let isShowText = false; // 窗体是否打开

	let paths = []; // 路径坐标

	window.mapInit = function() { // 挂载地图实例
		...
	}
	export default {
		data() {
			return {
				key: 'OB4BZ-D4W3U-B7VVO-4PJWW-6TKDJ-WPB77',
                // ------------------------------ 更新内容1 ----------------------------- //
				iconItem: [{
					name: 'agriculture', // 样式类型
					src: require("@/static/dot-01.png"), // 图片路径
					position: [22.227959, 113.459589], // 标点中心坐标
					markerList: [ // 区域坐标,必须以数组的这种形式
						[
							22.22839, 113.460787, 22.227644, 113.460801, 22.227582, 113.45945, 22.228346,
							113.459423
						]
					],
					fillColor: 'rgba(35, 181, 29, 0.6)', // 默认的区域样式
					fillColorHover: 'rgba(35, 181, 29, 0.8)', // 鼠标放上去的区域样式
					strokeColor: 'rgba(35, 181, 29, 1)', // 边框颜色
					markerUrl: require("@/static/dot-01.png"), // 标点图片样式
					background: require("@/static/bg-01.png"), // 信息窗体的背景图
					titleUrl: require("@/static/title-01.png"), // 信息窗体内的图片
				}, {
					name: 'property',
					src: require("@/static/dot-02.png"),
					position: [22.253496, 113.477076],
					markerList: [
						[
							22.253749, 113.475984, 22.254632, 113.477205, 22.253963, 113.477805, 22.252339,
							113.477209
						]
					],
					fillColor: 'rgba(70, 207, 209, .6)',
					fillColorHover: 'rgba(70, 207, 209, .8)',
					strokeColor: 'rgba(70, 207, 209, 1)',
					markerUrl: require("@/static/dot-02.png"),
					background: require("@/static/bg-02.png"),
					titleUrl: require("@/static/title-02.png"),
				}, {
					name: 'construction',
					src: require("@/static/dot-03.png"),
					position: [22.237834, 113.463987],
					markerList: [
						[
							22.23646, 113.461873, 22.23978, 113.463196, 22.238951, 113.465657, 22.236101,
							113.464483
						]
					],
					fillColor: 'rgba(243, 228, 43, .6)',
					fillColorHover: 'rgba(243, 228, 43, .8)',
					strokeColor: 'rgba(243, 228, 43, 1)',
					markerUrl: require("@/static/dot-03.png"),
					background: require("@/static/bg-03.png"),
					titleUrl: require("@/static/title-03.png"),
				}, {
					name: 'noRented',
					src: require("@/static/dot-04.png"),
					position: [22.253692, 113.498333],
					markerList: [
						[
							22.255189, 113.497027, 22.255364, 113.499003, 22.255099, 113.500223, 22.25156,
							113.498393, 22.252291, 113.49612, 22.254841, 113.495819
						]
					],
					fillColor: 'rgba(253, 143, 33, .6)',
					fillColorHover: 'rgba(253, 143, 33, .8)',
					strokeColor: 'rgba(253, 143, 33, 1)',
					markerUrl: require("@/static/dot-04.png"),
					background: require("@/static/bg-04.png"),
					titleUrl: require("@/static/title-04.png"),
				}]
                // ---------------------------------------------------------------------- //
			}
		},
		onLoad() {
			// #ifdef H5
			this.loadScrpit();
			// #endif
			// ------------------------------ 更新内容2 ----------------------------- //
			let time = setInterval(() => { // 等待地图挂载
				if (mapObj != null) {
					clearInterval(time);
					this.setIcon(); // 挂载坐标图片信息
					for (let i = 0; i < 4; i++) { // 循环生成区域
						this.setArea(this.iconItem[i].markerList, this.iconItem[i].fillColor, this.iconItem[i].fillColorHover, this.iconItem[i].strokeColor );
					}
				}
			}, 100)
            // ---------------------------------------------------------------------- //
		},
		created() {
			...
		},
		methods: {
			// 初始化
			loadScrpit() { // 挂载js
				...
			},
			setIcon() { // 创建标点图标
				...
			},
             // ------------------------------ 更新内容2 ----------------------------- //
			setArea(list, fillColor, fillColorHover, strokeColor) { // 设置地区
				let paths = []; // 标点列表
				let areaDatas = list; // 区域数据

				areaDatas.forEach(item => { // 设置样式
					paths.push({
						path: item, //设置区域边界线经纬度点串
						styleId: 'styel1' //设置区域样式id
					})
				})

				let area = new TMap.visualization.Area({
					styles: { //设置区域图样式
						styel1: {
							fillColor: fillColor, //设置区域填充颜色
							strokeColor: strokeColor, //设置区域边线颜色
							strokeWidth: 1, // 区域边框宽度
						}
					},
					selectOptions: { //设置拾取配置
						action: 'hover',
						style: {
							fillColor: fillColorHover, //设置区域填充颜色
							strokeColor: strokeColor, //设置区域边线颜色
							strokeWidth: 1, //区域边线宽度
							strokeDashArray: [0, 0] //边线虚线展示方式
						},
					}
				}).setData(paths).addTo(mapObj);
			},
             // ---------------------------------------------------------------------- //
			setMapMarker() { // 创建标点实例
				...
			},
			setInfoWindow(evt) { // 设置窗体
				...
			},
		}
	}
</script>

<style>
	...
</style>
更新内容1:样式数据比较简单就不赘述了,需要注意的是本文中使用了四个类型,才需要多个样式处理。同一类型的区域绘制坐标,以数组的方式添加至
markerList中即可,坐标数据越多绘制的区域也更精细。💬 获取区域标点个人使用的是腾讯的点图拾取坐标:点图拾取坐标 ,大家有好用的工具欢迎在评论区分享一下,我会更新上来。
iconItem: [{
	markerList: [ // 区域坐标,必须以数组的这种形式
		[
			22.22839, 113.460787, 22.227644, 113.460801, 22.227582, 113.45945, 22.228346,
			113.459423
		]
	],
	fillColor: 'rgba(35, 181, 29, 0.6)', // 默认的区域样式
	fillColorHover: 'rgba(35, 181, 29, 0.8)', // 鼠标放上去的区域样式
	strokeColor: 'rgba(35, 181, 29, 1)', // 区域边框颜色
}]
更新内容2:循环触发区域绘制函数,分别处理不同类型的区域样式,如果是单样式直接调用即可。
for (let i = 0; i < 4; i++) { // 循环生成区域
	this.setArea(this.iconItem[i].markerList, this.iconItem[i].fillColor, this.iconItem[i].fillColorHover, this.iconItem[i].strokeColor );
}
更新内容3:设置区域绘制和设置标点的流程基本差不多,都是先处理标点数据,再挂载区域实例。
因为是同一个函数就在注释里详讲,其中有一些可以封装为另一个函数的,例如标点处理这些,有需要就自行处理了。
setArea(list, fillColor, fillColorHover, strokeColor) { // 设置地区
	let paths = []; // 标点列表
	let areaDatas = list; // 区域标点数据
	// 同一类型的区域样式可能存在多个,需要遍历处理,item 就是具体的坐标
    // styleId这里不做区分也可以,只需要和下文的样式名对上即可
	areaDatas.forEach(item => { // 设置样式
		paths.push({
			path: item, //设置区域边界线经纬度点串
			styleId: 'styel1' //设置区域样式id
		})
	})
	// 挂载区域实例
	let area = new TMap.visualization.Area({
		styles: { //设置区域图样式
			styel1: { // 这里的 styel1 就是和上面的区域样式id对应,用于生效
				fillColor: fillColor, //设置区域填充颜色
				strokeColor: strokeColor, //设置区域边线颜色
				strokeWidth: 1, // 区域边框宽度
			}
		},
		selectOptions: { //设置拾取配置
			action: 'hover',
			style: {
				fillColor: fillColorHover, //设置区域填充颜色
				strokeColor: strokeColor, //设置区域边线颜色
				strokeWidth: 1, //区域边线宽度
				strokeDashArray: [0, 0] //边线虚线展示方式
			},
		}
	}).setData(paths).addTo(mapObj);
    // setData(paths):设置标点坐标
    // addTo(mapObj):挂载到地图上
}
四、结尾
本文仅记录我个人的解决思路,在封装或是调用等方面上会有所欠缺,欢迎大佬指正补充相关方面的技术博客与文档。如果有什么疑问也欢迎大家评论区或是私信我,我看见就会回复。
如果本文有帮助到你,可否给我一个赞,你的支持就是我创作的动力👍。


 5786
5786

 被折叠的 条评论
为什么被折叠?
被折叠的 条评论
为什么被折叠?
 到【灌水乐园】发言


