


今天来简单分享下如何在GEE合成长时序的月NDVI与LST,并进行分析
目标:
利用MODIS为数据源,在GEE计算某一地区对月NDVI与LST,并制作统计图
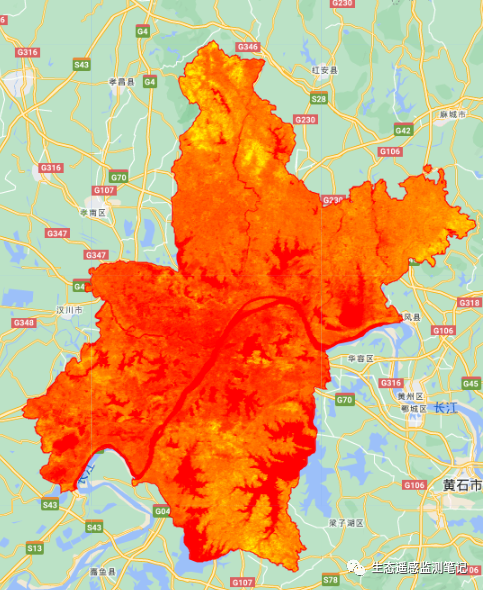
以武汉市为研究区
GEE实现代码:
首先确定研究区和使用的数据集
var roi = ee.FeatureCollection("users/lilei655123/WUhan");
Map.centerObject(roi,7)
var styling = {color:"red",fillColor:"00000000"};
Map.addLayer(roi.style(styling),{},"geometry")
//添加MODIS植被指数16天全球250米
var Coll_NDVI = ee.ImageCollection("MODIS/006/MOD13Q1")
//MODIS/006/MOD13A1
var Coll_LST = ee.ImageCollection("MODIS/006/MOD11A2")
//MODIS/006/MOD11A1
确定起止时间和月份
var startYear = 2010;
var endYear = 2020;
var startDate = ee.Date.fromYMD(startYear, 1, 1);
var endDate = ee.Date.fromYMD(endYear, 12, 31);
合成NDVI和LST
Coll_NDVI = Coll_NDVI.filterDate(startDate, endDate).select("NDVI");
Coll_NDVI = ee.ImageCollection(ee.Algorithms.If(Coll_NDVI.size().eq(0),
      ee.ImageCollection(ee.Image(0).selfMask().rename('NDVI')),
      Coll_NDVI
    ));
Coll_LST = Coll_LST.filterDate(startDate, endDate).select("LST_Day_1km");
Coll_LST = ee.ImageCollection(ee.Algorithms.If(Coll_LST.size().eq(0),
      ee.ImageCollection(ee.Image(0).selfMask().rename('LST_Day_1km')),
      Coll_LST
    ));
// MOD12Q1数据的NDVI比例为0.0001 [ 最小值=-2000,最大值=10000]
var Coll_NDVI = Coll_NDVI.map(function(img) {
  return img
    .divide(10000).float().set("system:time_start", img.get("system:time_start")); // keep time info
    });


var Coll_LST = Coll_LST.map(function(img) {
  return img
    .multiply(0.02).subtract(273.15).float().set("system:time_start", img.get("system:time_start")); // keep time info
});


print(Coll_NDVI);
print(Coll_LST);
合成月NDVI
var monthlyNDVI =  ee.ImageCollection.fromImages(
  years.map(function (y) {
    return months.map(function(m) {
      var monthly = Coll_NDVI
        .filter(ee.Filter.calendarRange(y, y, "year"))
        .filter(ee.Filter.calendarRange(m, m, "month"))
        .mean();
      return monthly
        .set("year", y)
        .set("month", m)
        .set('date', ee.Date.fromYMD(y,m,1))
        .set("system:time_start", ee.Date.fromYMD(y, m, 1));}); })
  .flatten());
print('monthlyNDVI',monthlyNDVI)
//最大合成NDVI
var MonthlyMAX =  ee.ImageCollection.fromImages(months
  .map(function (m) {
    var maxNDVI = monthlyNDVI.filter(ee.Filter.eq("month", m))
      .reduce(ee.Reducer.percentile({percentiles: [90]}));
  return maxNDVI
    .set("month", m);})
  .flatten());
//print (MonthlyMAX, 'MonthlyMAX');
Map.addLayer (MonthlyMAX.first().clip(roi),  {min:0, max:1,  'palette': ['red','yellow', 'green']}, 'MonthlyMAX');


var MonthlyMIN =  ee.ImageCollection.fromImages(months
  .map(function (m) {
    var minNDVI = monthlyNDVI.filter(ee.Filter.eq("month", m))
      .reduce(ee.Reducer.percentile({percentiles: [10]}));
  return minNDVI
    .set("month", m);})
  .flatten());
//print (MonthlyMIN, 'MonthlyMIN');
Map.addLayer (MonthlyMIN.first().clip(roi),  {min:0, max:1,  'palette': ['red','yellow', 'green']}, 'MonthlyMIN');
同样的方法合成月LST
var monthlyLST =  ee.ImageCollection.fromImages(
  years.map(function (y) {
    return months.map(function(m) {
      var monthly = Coll_LST
        .filter(ee.Filter.calendarRange(y, y, "year"))
        .filter(ee.Filter.calendarRange(m, m, "month"))
        .mean();
      return monthly
        .set("year", y)
        .set("month", m)
        .set('date', ee.Date.fromYMD(y,m,1))
        .set("system:time_start", ee.Date.fromYMD(y, m, 1));}); })
  .flatten());
print('monthlyLST',monthlyLST)


//最大合成LST
var Monthly_LST_MAX =  ee.ImageCollection.fromImages(months
  .map(function (m) {
    var maxNDVI = monthlyLST.filter(ee.Filter.eq("month", m))
      .reduce(ee.Reducer.percentile({percentiles: [90]}));
  return maxNDVI
    .set("month", m);})
  .flatten());

//print (Monthly_LST_MAX, 'Monthly_LST_MAX');
Map.addLayer (Monthly_LST_MAX.first().clip(roi),  {min:15, max:35,  'palette': ['red','yellow', 'green']}, 'Monthly_LST_MAX');


var Monthly_LST_MIN =  ee.ImageCollection.fromImages(months
  .map(function (m) {
    var minNDVI = monthlyNDVI.filter(ee.Filter.eq("month", m))
      .reduce(ee.Reducer.percentile({percentiles: [10]}));
  return minNDVI
    .set("month", m);})
  .flatten());

//print (Monthly_LST_MIN, 'Monthly_LST_MIN');
Map.addLayer (Monthly_LST_MIN.first().clip(roi),  {min:0, max:1,  'palette': ['red','yellow', 'green']}, 'Monthly_LST_MIN');
创建统计图
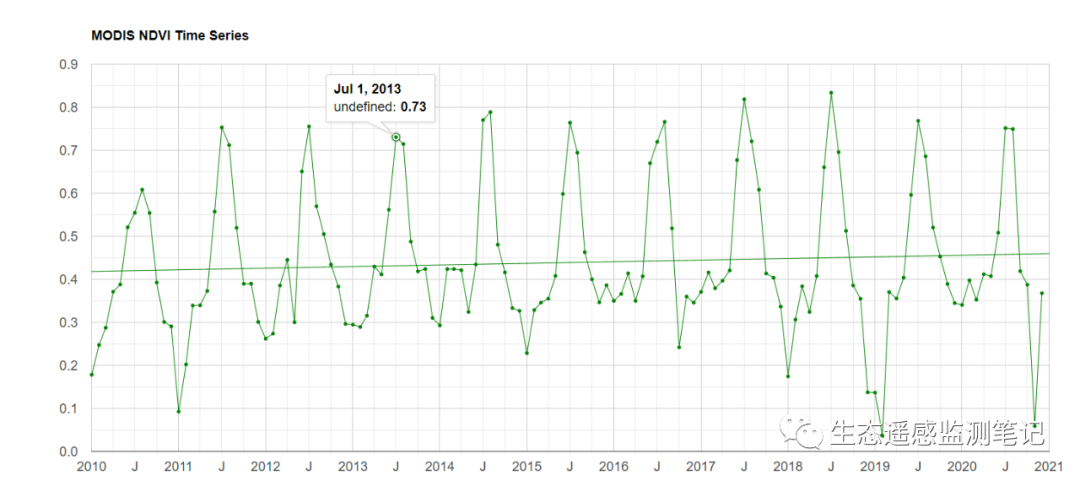
var ndviTimeSeries = ui.Chart.image.seriesByRegion(
    monthlyNDVI, roi, ee.Reducer.mean(), 'NDVI', 500, 'system:time_start', 'label')
        .setChartType('ScatterChart')
        .setOptions({trendlines: {0: {color: 'green'}},lineWidth: 1,pointSize: 3,
          title: 'MODIS NDVI Time Series',
          vAxis: {title: 'NDVI'},
                   series: {
            0: {color: 'green'},

}});
print(ndviTimeSeries);
print(ui.Chart.image.series(monthlyNDVI , roi , ee.Reducer.mean(), 500));
运行结果如下:
LST
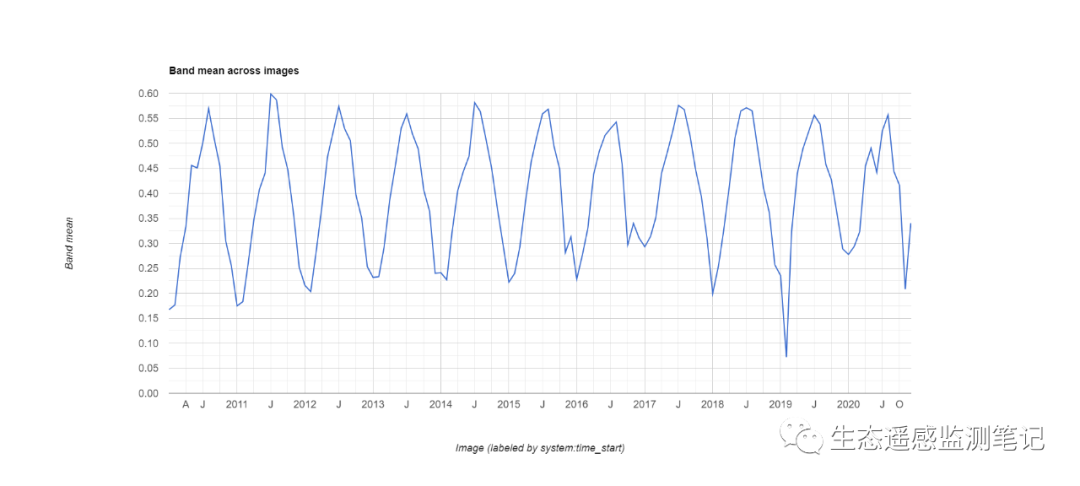
NDVI的带状平均值
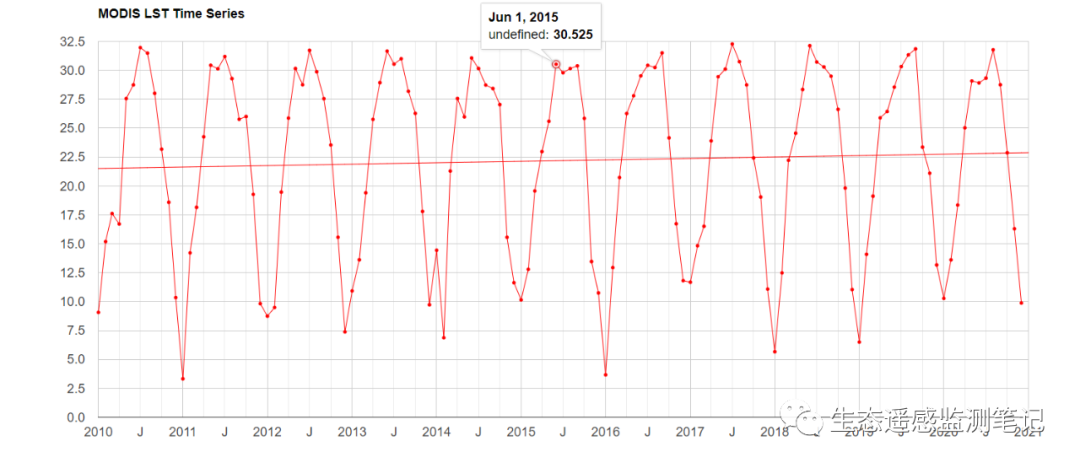
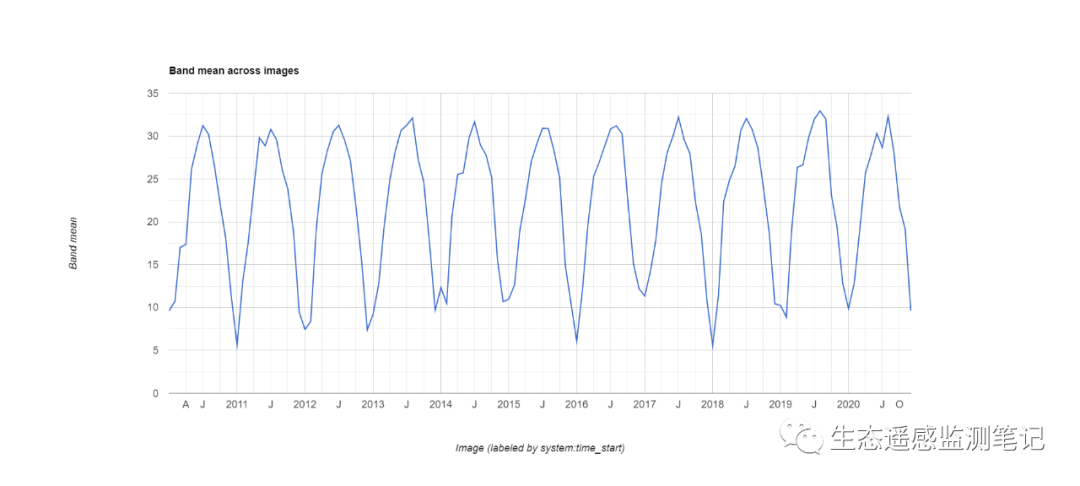
LST的带状平均值
完整代码请在公众号后台回复“0803合成月NDVI和LST”
感谢关注,欢迎转发!
声明:仅供学习使用!
希望关注的朋友们转发,如果对你有帮助的话记得给小编点个赞或者在看!
## ****更多内容请关注微信公众号“生态遥感监测笔记”**


 1264
1264

 被折叠的 条评论
为什么被折叠?
被折叠的 条评论
为什么被折叠?
 到【灌水乐园】发言


