计算智能 作业二
题目:自选非线性分类或曲线拟合问题,用BP网络训练、学习。
自选题目:
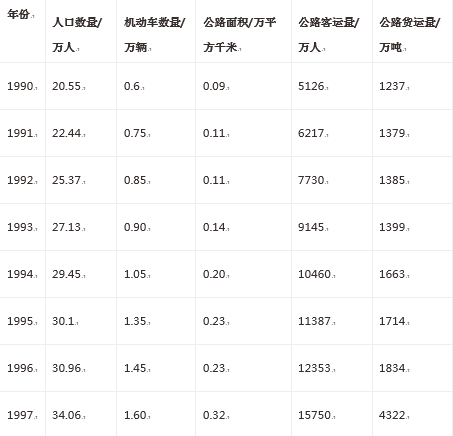
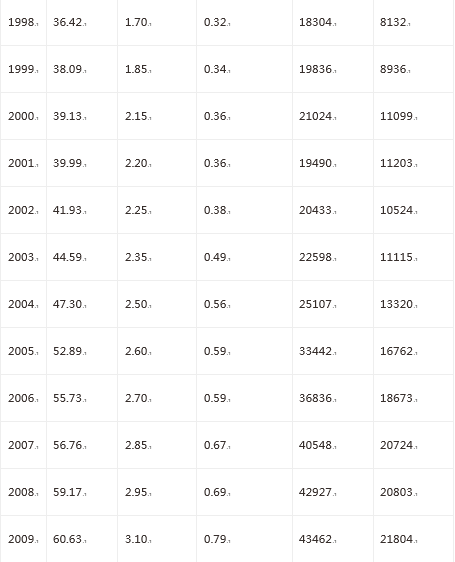
下面列表中的数据是某地区20年公路运量数据,其中属性“人口数量”、“机动车数量”和“公路面积”作为输入,属性“公路客运量”和“公路货运量”作为输出。请用神经网络拟合此多输入多输出曲线。
(1)神经网络原理
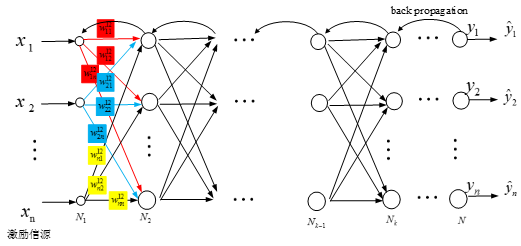
BP网络模型处理信息的基本原理是:输入信号Xi通过中间节点(隐层点)作用于输出节点,经过非线形变换,产生输出信号Yk,网络训练的每个样本包括输入向量X和期望输出量t,网络输出值Y与期望输出值t之间的偏差,通过调整输入节点与隐层节点的联接强度取值Wij和隐层节点与输出节点之间的联接强度Tjk以及阈值,使误差沿梯度方向下降,经过反复学习训练,确定与最小误差相对应的网络参数(权值和阈值),训练即告停止。此时经过训练的神经网络即能对类似样本的输入信息,自行处理输出误差最小的经过非线形转换的信息。
(2)神经网络结构设计
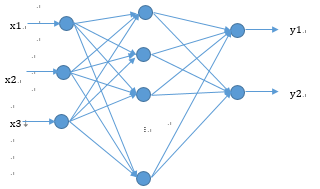
用三层神经网络来实现相关的,输入层为3输入,隐含层设置8个节点,输出层设置为2个输出。
激活函数:

权值更新:

神经网络的权值更新步骤为:
(1)初始化各层连接权值,并设置学习率和惯性系数。
(2)输入一个样本对,计算各层节点输出值。
(3)根据梯度下降策略,以目标函数的负梯度方向对参数进行调整。
标准BP算法,每次仅针对一个训练样例更新连接权,参数更新非常频繁,而且对不同的训练样例进行更新的效果可能出现“抵消”现象。因此,为了最终在所有训练数据上达到误差最小,在读取整个训练集后,再对参数进行更新,可以大大加快训练速度。因此在此问题中,我们采用累计误差来更新权值。
程序代码:
# -*- coding: utf-8 -*-
"""
Created on Wed Oct 26 09:58:50 2016
This file is used to fit the curve of traffic.
@author: Hansyang
"""
import numpy as np
import matplotlib.pyplot as plt
def logsig(x):
    return 1/(1+np.exp(-x))

#Original Data
#Input: the pupulation, number of vehicle, roadarea from 1990-2009
population=[20.55,22.44,25.37,27.13,29.45,30.10,30.96,34.06,36.42,38.09,39.13,39.99,41.93,44.59,47.30,52.89,55.73,56.76,59.17,60.63]
vehicle=[0.6,0.75,0.85,0.9,1.05,1.35,1.45,1.6,1.7,1.85,2.15,2.2,2.25,2.35,2.5,2.6,2.7,2.85,2.95,3.1]
roadarea=[0.09,0.11,0.11,0.14,0.20,0.23,0.23,0.32,0.32,0.34,0.36,0.36,0.38,0.49,0.56,0.59,0.59,0.67,0.69,0.79]
#Output
passengertraffic=[5126,6217,7730,9145,10460,11387,12353,15750,18304,19836,21024,19490,20433,22598,25107,33442,36836,40548,42927,43462]
freighttraffic=[1237,1379,1385,1399,1663,1714,1834,4322,8132,8936,11099,11203,10524,11115,13320,16762,18673,20724,20803,21804]

# normalize the original data and add the noise
samplein = np.mat([population,vehicle,roadarea]) #3*20
sampleinminmax = np.array([samplein.min(axis=1).T.tolist()[0],samplein.max(axis=1).T.tolist()[0]]).transpose()#3*2
sampleout = np.mat([passengertraffic,freighttraffic])#2*20
sampleoutminmax = np.array([sampleout.min(axis=1).T.tolist()[0],sampleout.max(axis=1).T.tolist()[0]]).transpose()#2*2
sampleinnorm = (2*(np.array(samplein.T)-sampleinminmax.transpose()[0])/(sampleinminmax.transpose()[1]-sampleinminmax.transpose()[0])-1).transpose()
sampleoutnorm = (2*(np.array(sampleout.T).astype(float)-sampleoutminmax.transpose()[0])/(sampleoutminmax.transpose()[1]-sampleoutminmax.transpose()[0])-1).transpose()

#initial the parameters
maxepochs =1000
learnrate = 0.035
errorfinal = 0.5*10**(-3)
samnum = 20
indim = 3
outdim = 2
hiddenunitnum = 8
w1 = 2*np.random.rand(hiddenunitnum,indim)-1
b1 = 2*np.random.rand(hiddenunitnum,1)-1
w2 = 2*np.random.rand(outdim,hiddenunitnum)-1
b2 = 2*np.random.rand(outdim,1)-1
errhistory = []
for i in range(maxepochs):
    hiddenout = logsig((np.dot(w1,sampleinnorm).transpose()+b1.transpose())).transpose()
    networkout = (np.dot(w2,hiddenout).transpose()+b2.transpose()).transpose()
    err = sampleoutnorm - networkout
    sse = sum(sum(err**2))
    #Use the err of the whole dataset as the err, rather than one subject, aiming of reduce the err fast
    errhistory.append(sse)
    if sse < errorfinal:
        break
    delta2 = err
    delta1 = np.dot(w2.transpose(),delta2)*hiddenout*(1-hiddenout)
    dw2 = np.dot(delta2,hiddenout.transpose())
    db2 = np.dot(delta2,np.ones((samnum,1)))
    dw1 = np.dot(delta1,sampleinnorm.transpose())
    db1 = np.dot(delta1,np.ones((samnum,1)))
    w2 += learnrate*dw2
    b2 += learnrate*db2
    w1 += learnrate*dw1
    b1 += learnrate*db1
 #For there was a normalization, cacalute the original output use the min and max value
hiddenout = logsig((np.dot(w1,sampleinnorm).transpose()+b1.transpose())).transpose()
networkout = (np.dot(w2,hiddenout).transpose()+b2.transpose()).transpose()
diff = sampleoutminmax[:,1]-sampleoutminmax[:,0]
networkout2 = (networkout+1)/2
networkout2[0] = networkout2[0]*diff[0]+sampleoutminmax[0][0]
networkout2[1] = networkout2[1]*diff[1]+sampleoutminmax[1][0]
sampleout = np.array(sampleout)

#show the err curve and the results
plt.figure(1)
plt.plot(errhistory,label="error")
plt.legend(loc='upper left')

plt.figure(2)
plt.subplot(2,1,1)
plt.plot(sampleout[0],color="blue", linewidth=1.5, linestyle="-", label="real curve of passengertraffic");
plt.plot(networkout2[0],color="red", linewidth=1.5, linestyle="--",  label="fitting curve");
plt.legend(loc='upper left')
plt.show()
plt.subplot(2,1,2)
plt.plot(sampleout[1],color="blue", linewidth=1.5, linestyle="-", label="real curve of freighttraffic");
plt.plot(networkout2[1],color="red", linewidth=1.5, linestyle="--",  label="fitting curve");
plt.legend(loc='upper left')
plt.show()
实验结果:
误差曲线

归一化后的误差曲线(迭代1000次)
(2)拟合结果
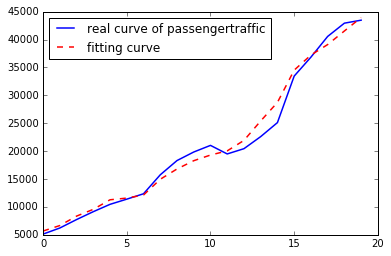
输出1拟合曲线(迭代1000次)
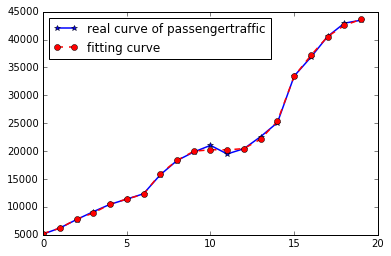
输出1拟合曲线(迭代100000次)
(3)实验结论
从图中的误差曲线可以看出,在训练初期,误差下降非常快,但是随着累积误差下降到一定程度后,进一步下降将会非常缓慢。在精度要求较高时,使用累计误差来岁权值进行更新,会使训练次数增多。而在样本较小或者精度要求不高时,采用累计误差来进行权值更新能大大加快训练速度。




 1万+
1万+

 被折叠的 条评论
为什么被折叠?


