


前言
之前的文章中我们已经获取了沪深300成分股的详细个股数据,本文我们来计算一下2023年成分股的涨跌排行榜。
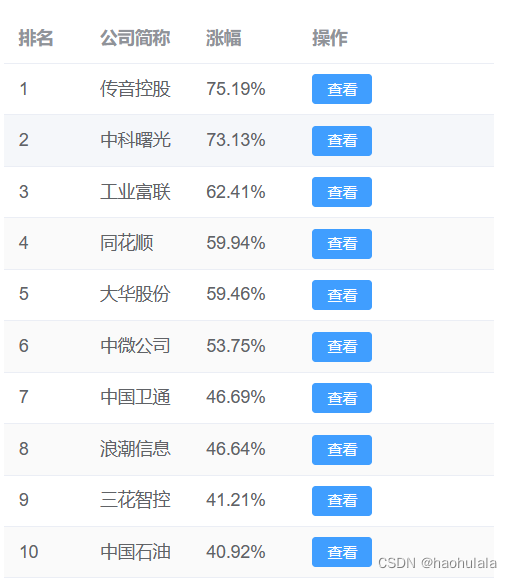
首先看一下效果
详细代码
首先说一下后端的代码,涨跌幅的计算公式如下:
(2023年最后一天的收盘价-2023年第一天的收盘价)/ 2023年第一天的收盘价
计算完所有股票的涨跌幅后,再进行排序即可。
主要的函数如下
    // 将查询的数据缓存到内存中
    private List<CSI300RankVO> cache = new ArrayList<>();

    // 查询沪深300成分股2023年涨跌排行榜
    public synchronized List<CSI300RankVO> query2023rank(int type, int limit) {
        // 首先将所有的股票查出来
        List<StockOptionVO> allCode = getAllCode();
        List<CSI300RankVO> csi300RankVOList = new ArrayList<>();
        if (cache.size() == 0) {
            log.info("需要重新计算数据");
            // 根据股票代码查询所有股票的涨跌幅
            for (int i = 0; i < allCode.size(); i++) {
                // 去除掉沪深300指数本身
                if (allCode.get(i).getCode().equals("399300")) {
                    continue;
                }
                List<StockEntity> stockEntities = sqLiteStockDao.queryAllByCodeAndYear(allCode.get(i).getCode(), "2023");
                CSI300RankVO csi300RankVO = new CSI300RankVO();
                csi300RankVO.setCode(allCode.get(i).getCode());
                csi300RankVO.setName(allCode.get(i).getName());
                Double rise = (stockEntities.get(0).getClose_price() - stockEntities.get(stockEntities.size() - 1).getClose_price()) / stockEntities.get(stockEntities.size() - 1).getClose_price();
                rise = rise * 100;
                String str = String.format("%.2f", rise);
                rise = Double.parseDouble(str);
                csi300RankVO.setRise(rise);
                csi300RankVOList.add(csi300RankVO);
            }
            log.info("填充数据");
            // 将数据填充到缓存中
            for (int i=0; i<csi300RankVOList.size(); i++) {
                cache.add(csi300RankVOList.get(i));
            }
        } else {
            log.info("缓存中已存在数据,不需要重新计算");
            for (int i=0; i<cache.size(); i++) {
                csi300RankVOList.add(cache.get(i));
            }
        }
        // type==1查询涨幅
        if (type == 1) {
            // 按照涨幅升序排序
            Collections.sort(csi300RankVOList, new Comparator<CSI300RankVO>() {
                @Override
                public int compare(CSI300RankVO o1, CSI300RankVO o2) {
                    if (o1.getRise() > o2.getRise()) {
                        return -1;
                    } else if (o1.getRise() == o2.getRise()) {
                        return 0;
                    } else {
                        return 1;
                    }
                }
            });
        } else if (type == 2) { // type==2查询跌幅
            Collections.sort(csi300RankVOList, new Comparator<CSI300RankVO>() {
                @Override
                public int compare(CSI300RankVO o1, CSI300RankVO o2) {
                    if (o1.getRise() > o2.getRise()) {
                        return 1;
                    } else if (o1.getRise() == o2.getRise()) {
                        return 0;
                    } else {
                        return -1;
                    }
                }
            });
        }
        // 最后取limit个数据返回
        List<CSI300RankVO> result = new ArrayList<>();
        for (int i=0; i<limit; i++) {
            if (i > csi300RankVOList.size()-1) {
                return result;
            }
            if (type == 1 && csi300RankVOList.get(i).getRise()<0) { // 查询涨幅
                return result;
            }
            if (type == 2 && csi300RankVOList.get(i).getRise()>0) { // 查询跌幅
                return result;
            }
            result.add(csi300RankVOList.get(i));
        }
        return result;
    }
由于计算的时候很慢,所以当第一次算完后就将结果保存在内存中,下一次再查询就不需要重复计算了。
接着是前端的代码,就是两张表格还有一个现实echarts图表的div
<template>
  <div>
    <el-row class="container">
      <div class="left-grid">
        <el-card class="box-card">
          <template #header>
            <div class="card-header">
              <span>涨幅排行榜</span>
            </div>
          </template>
          <el-table
            v-loading="loading1"
            :data="rise_data"
            :show-header="true"
            :max-height="500"
            stripe
          >
            <el-table-column
              type="index"
              label="排名"
              width="65%"
            ></el-table-column>
            <el-table-column
              prop="name"
              label="公司简称"
              width="85%"
            ></el-table-column>
            <el-table-column
              prop="rise"
              label="涨幅"
              width="85%"
              :formatter="formatter"
            ></el-table-column>
            <el-table-column prop="industry" label="操作">
              <template #default="scope">
                <el-button
                  type="primary"
                  size="small"
                  @click="queryData(scope.row)"
                  >查看</el-button
                >
              </template>
            </el-table-column>
          </el-table>
        </el-card>
        <el-card>
          <template #header>
            <div class="card-header">
              <span>跌幅排行榜</span>
            </div>
          </template>
          <el-table
            v-loading="loading2"
            :data="fall_data"
            :show-header="true"
            :max-height="500"
            stripe
          >
            <el-table-column
              type="index"
              label="排名"
              width="65%"
            ></el-table-column>
            <el-table-column
              prop="name"
              label="公司简称"
              width="85%"
            ></el-table-column>
            <el-table-column
              prop="rise"
              label="跌幅"
              width="85%"
              :formatter="formatter"
            ></el-table-column>
            <el-table-column prop="industry" label="操作">
              <template #default="scope">
                <el-button
                  type="primary"
                  size="small"
                  @click="queryData(scope.row)"
                  >查看</el-button
                >
              </template>
            </el-table-column>
          </el-table>
        </el-card>
      </div>

      <div class="right-grid" ref="myChart"></div>
    </el-row>
  </div>
</template>

<script>
import axios from "axios";
import { ElMessage } from "element-plus";
import { getCurrentInstance } from "vue";
export default {
  data() {
    return {
      // 涨幅排行榜
      rise_data: [],
      loading1: true,
      // 跌幅排行榜
      fall_data: [],
      // 个股详细数据
      stock_data: [],
      loading2: true,
      table_title: "",
      echarts: getCurrentInstance().appContext.config.globalProperties.$echarts,
    };
  },
  mounted() {
    this.init();
  },
  methods: {
    init() {
      var url1 = "http://localhost:9001/stock/query2023rank/1/10";
      axios
        .get(url1)
        .then((response) => {
          this.rise_data = response.data;
          console.log(response);
          this.loading1 = false;
        })
        .catch((error) => {
          console.log(error);
          this.loading1 = false;
        });
      var url2 = "http://localhost:9001/stock/query2023rank/2/10";
      axios
        .get(url2)
        .then((response) => {
          this.fall_data = response.data;
          console.log(response);
          this.loading2 = false;
        })
        .catch((error) => {
          console.log(error);
          this.loading2 = false;
        });
    },
    // 绘制折线图
    create_axis() {
      //3.初始化实例对象 echarts.init(dom容器)
      var data_xAxis = [];
      var data_yAxis = [];
      for (var i = this.stock_data.length - 1; i >= 0; i--) {
        data_xAxis.push(this.stock_data[i].record_date);
        data_yAxis.push(this.stock_data[i].close_price);
      }
      console.log(data_xAxis);
      console.log(data_yAxis);
      var dom = this.$refs["myChart"]; // 获取dom节点
      var myChart = this.echarts.init(dom);
      //4.指定配置项和数据
      var option = {
        tooltip: {
          trigger: "axis",
          position: function (pt) {
            return [pt[0], "10%"];
          },
        },
        title: {
          left: "center",
          text: this.table_title,
        },
        toolbox: {
          feature: {
            dataZoom: {
              yAxisIndex: "none",
            },
            restore: {},
            saveAsImage: {},
          },
        },
        xAxis: {
          type: "category",
          boundaryGap: false,
          data: data_xAxis,
        },
        yAxis: {
          type: "value",
          boundaryGap: [0, "100%"],
        },
        dataZoom: [
          {
            type: "inside",
            start: 0,
            end: 10,
          },
          {
            start: 0,
            end: 10,
          },
        ],
        series: [
          {
            name: this.table_title,
            type: "line",
            symbol: "none",
            sampling: "lttb",
            itemStyle: {
              color: "rgb(135,206,235)",
            },
            areaStyle: {
              color: new this.echarts.graphic.LinearGradient(0, 0, 0, 1, [
                {
                  offset: 0,
                  color: "rgb(135,206,250)",
                },
                {
                  offset: 1,
                  color: "rgb(135,206,235)",
                },
              ]),
            },
            data: data_yAxis,
          },
        ],
      };
      //5.将配置项设置给echarts实例对象,使用刚指定的配置项和数据显示图表。
      myChart.setOption(option);
    },
    // 查询数据
    queryData(row) {
      var url = "http://localhost:9001/stock/querinfo2023/" + row.code;
      this.table_title = row.code + " " + row.name;
      ElMessage("开始查询 " + row.name + " 的数据");
      axios
        .get(url)
        .then((response) => {
          this.stock_data = response.data;
          console.log(response);
          this.loading = false;
          ElMessage({
            message: "查询 " + row.name + " 的数据成功",
            type: "success",
          });
          // 绘制数据
          this.create_axis();
        })
        .catch((error) => {
          console.log(error);
          this.loading = false;
          ElMessage.error("查询 " + row.name + " 的数据失败");
        });
    },
    formatter(row) {
      return row.rise + "%";
    },
  },
};
</script>

<style scoped>
.card-header {
  display: flex;
  justify-content: space-between;
  align-items: center;
}
.container {
  display: grid;
  grid-template-columns: 35% 65%;
  width: 100%;
  height: 80vh;
}
.left-grid {
  background-color: #f0f0f0;
  border-radius: 2%;
  padding: 10px;
  height: 95%;
}
.right-grid {
  background-color: #f9ecc3;
  border-radius: 2%;
  padding: 10px;
  height: 650px;
}
</style>
数据分析
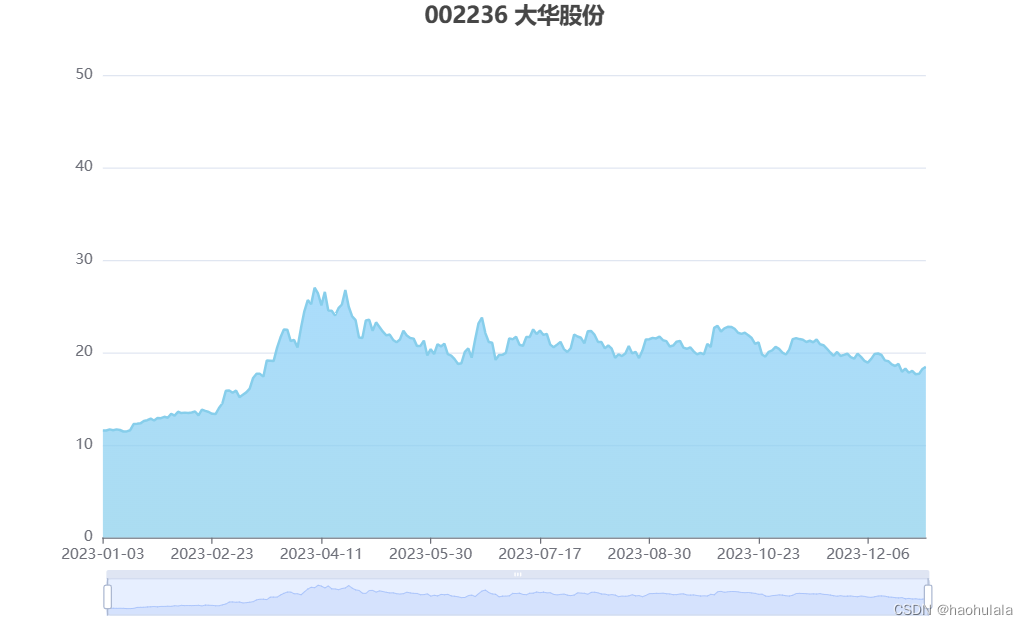
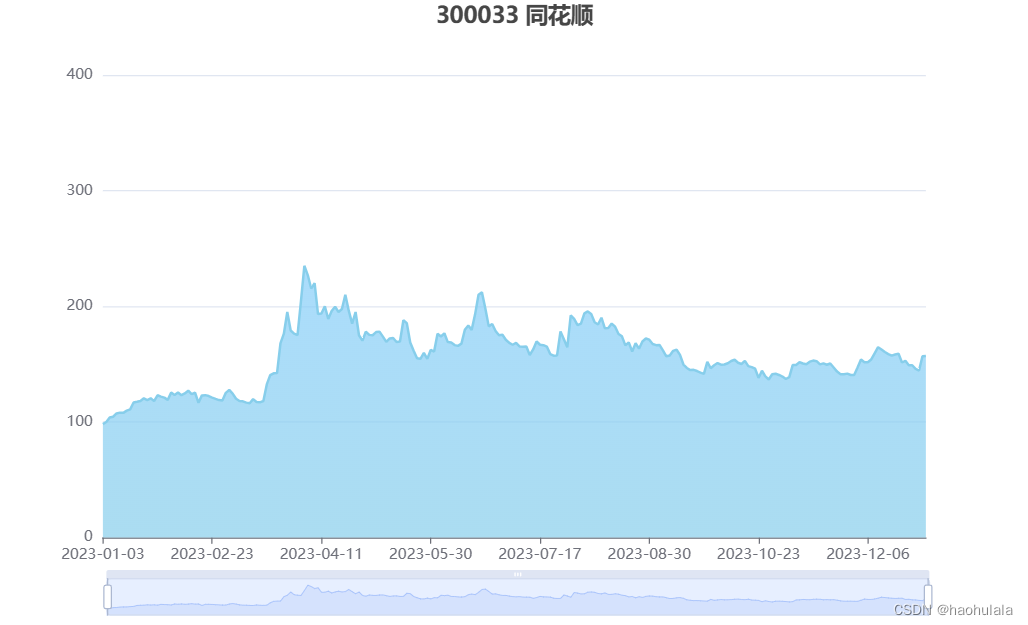
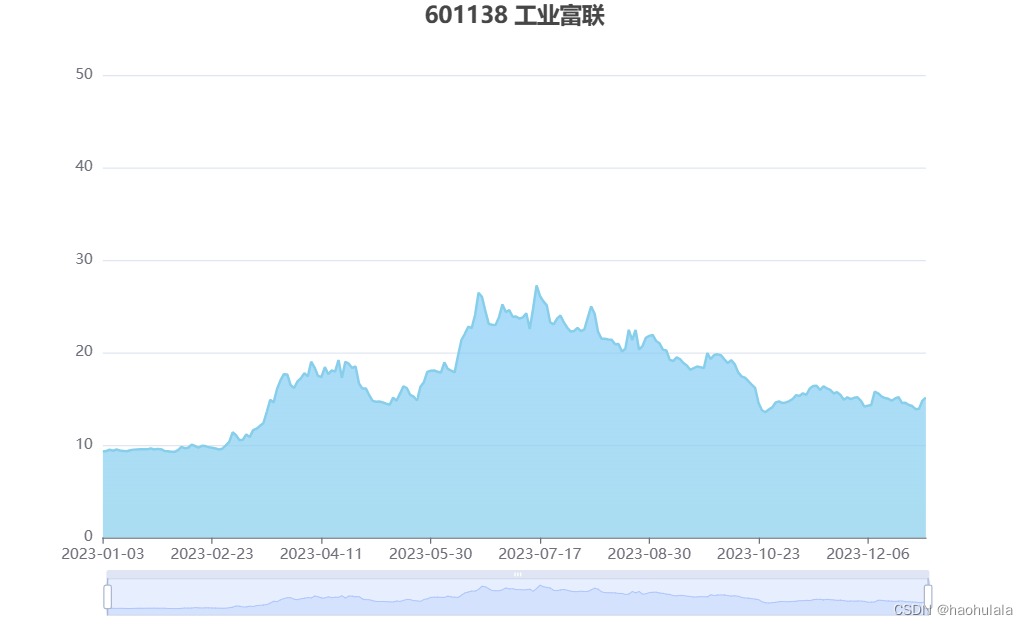
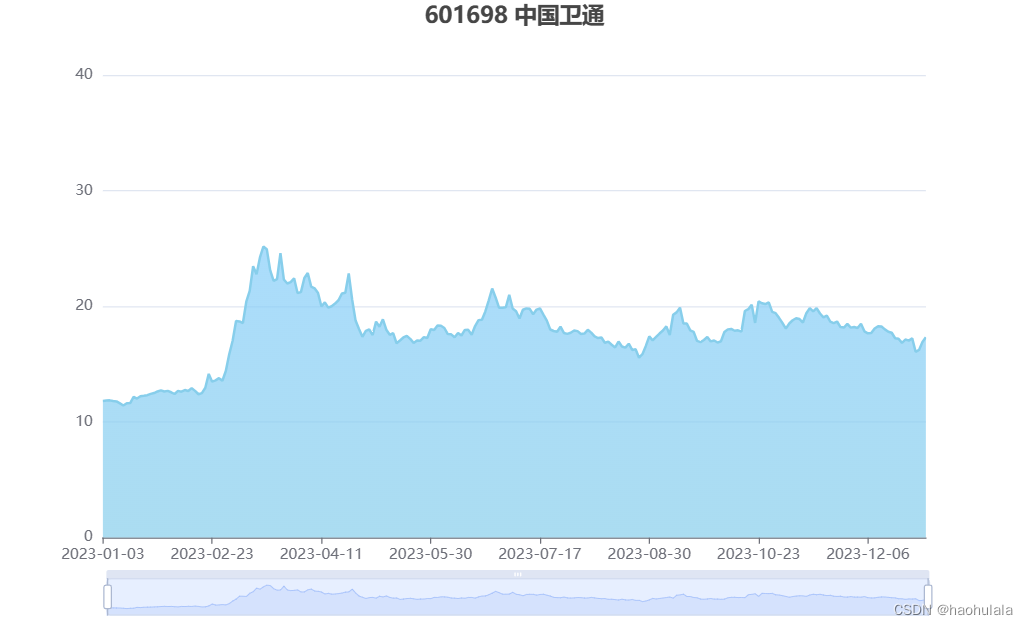
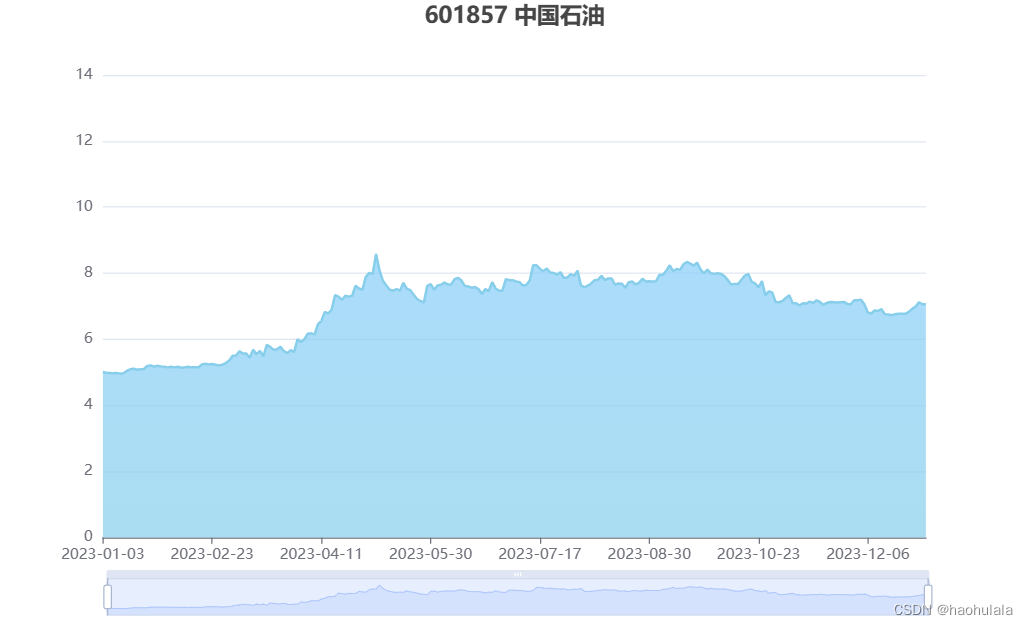
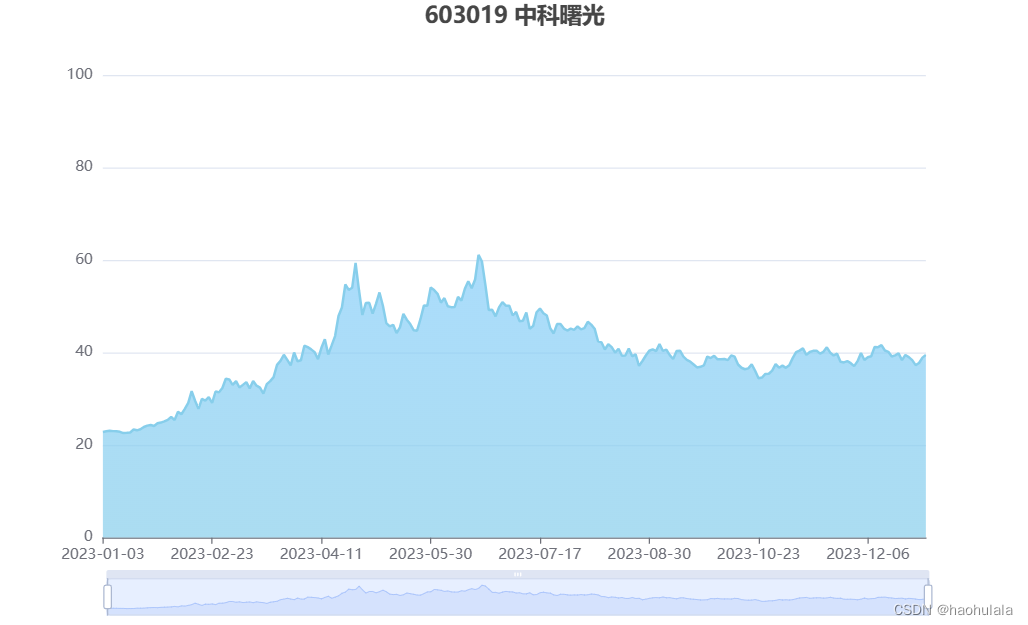
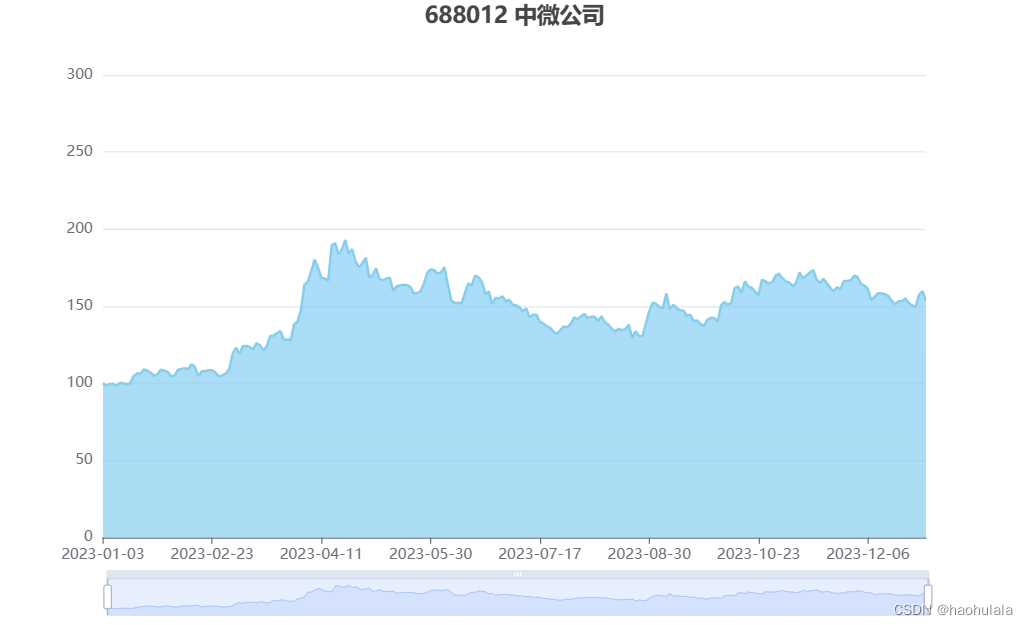
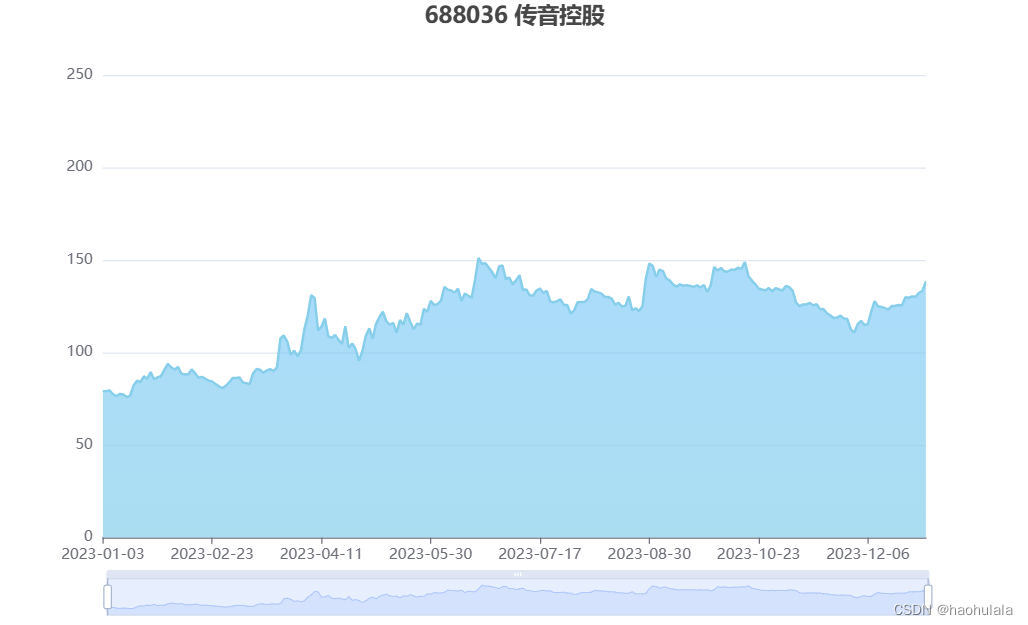
介绍完代码后,我们来看一下数据分析的结果,首先是涨幅排行榜

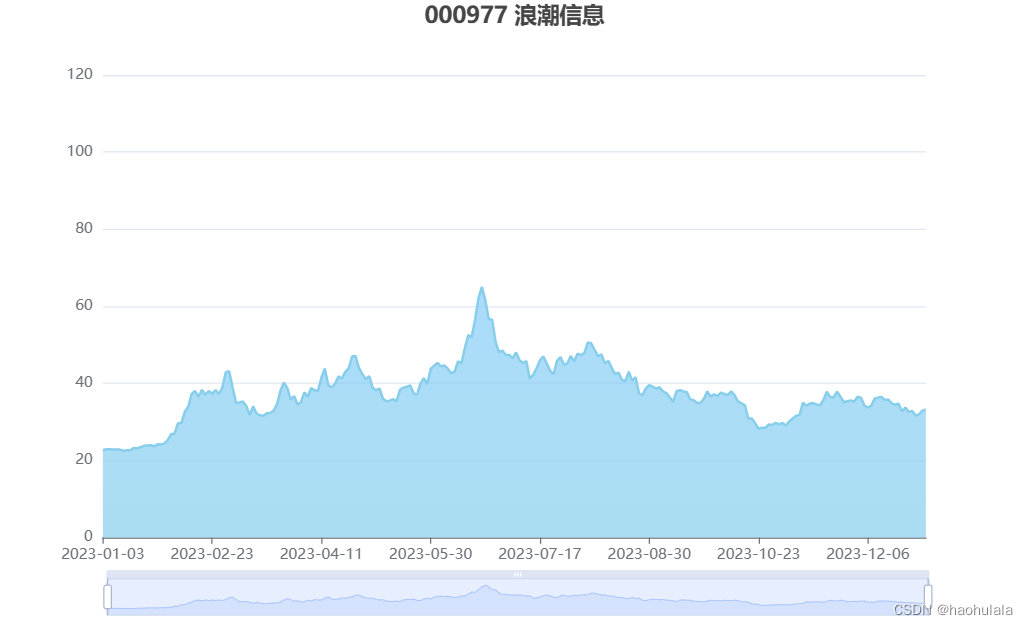
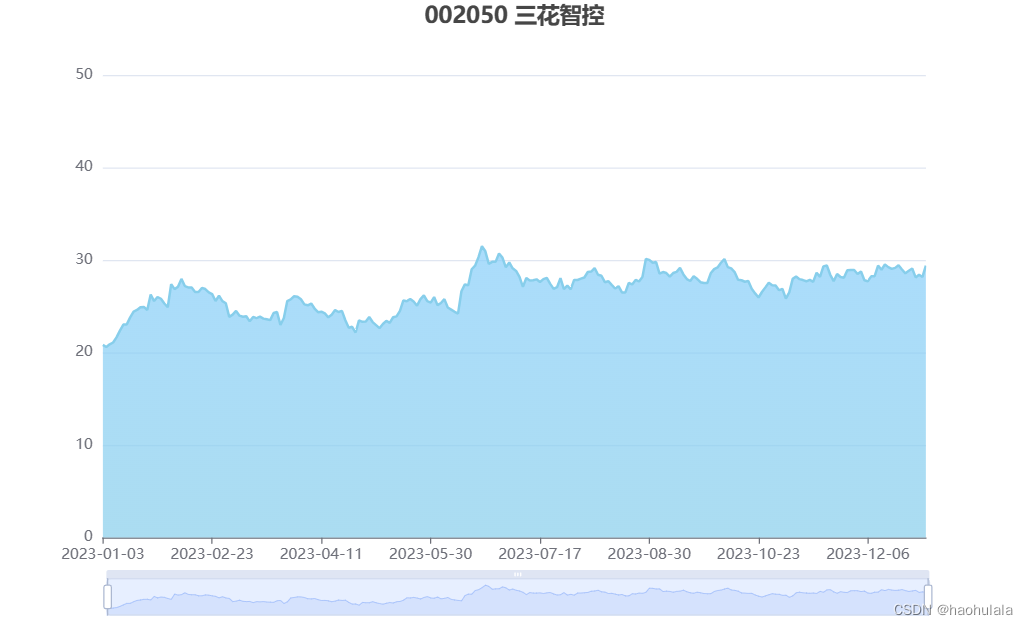
下面是排行榜上10只股票的走势图(顺序是根据文件名排的)
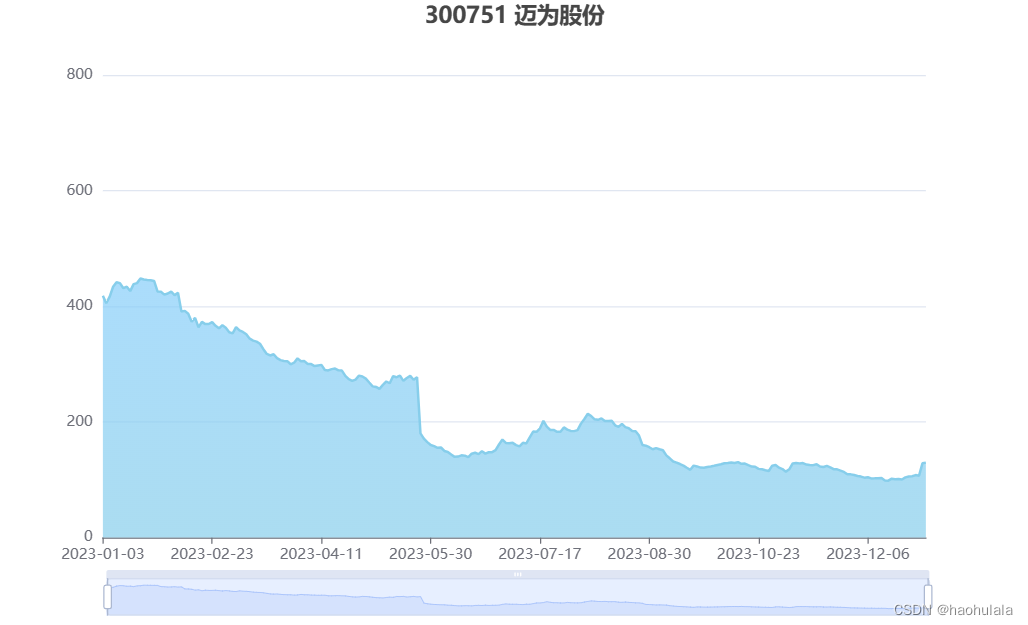
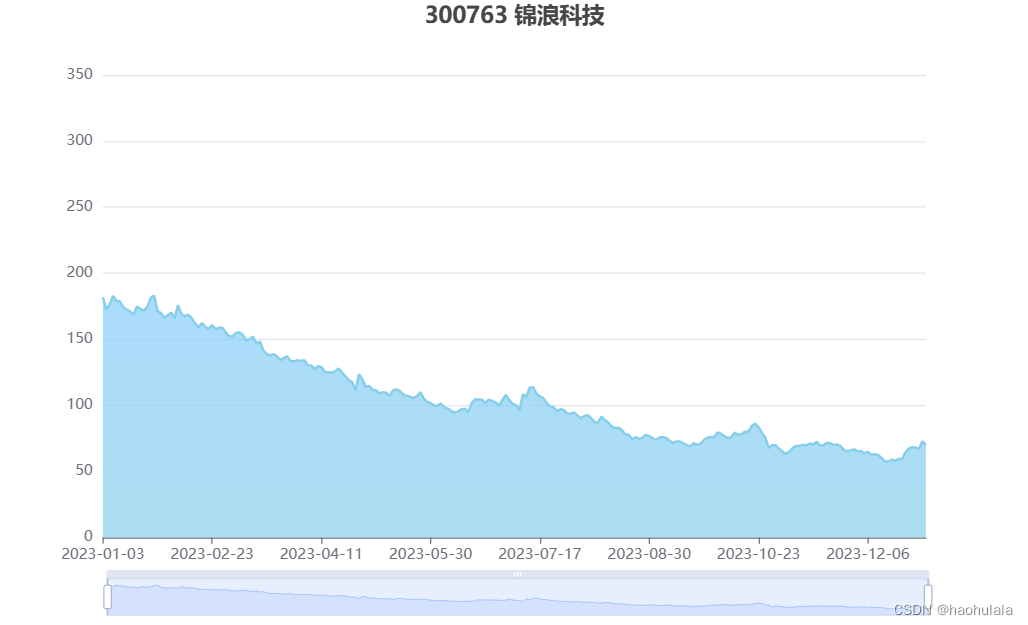
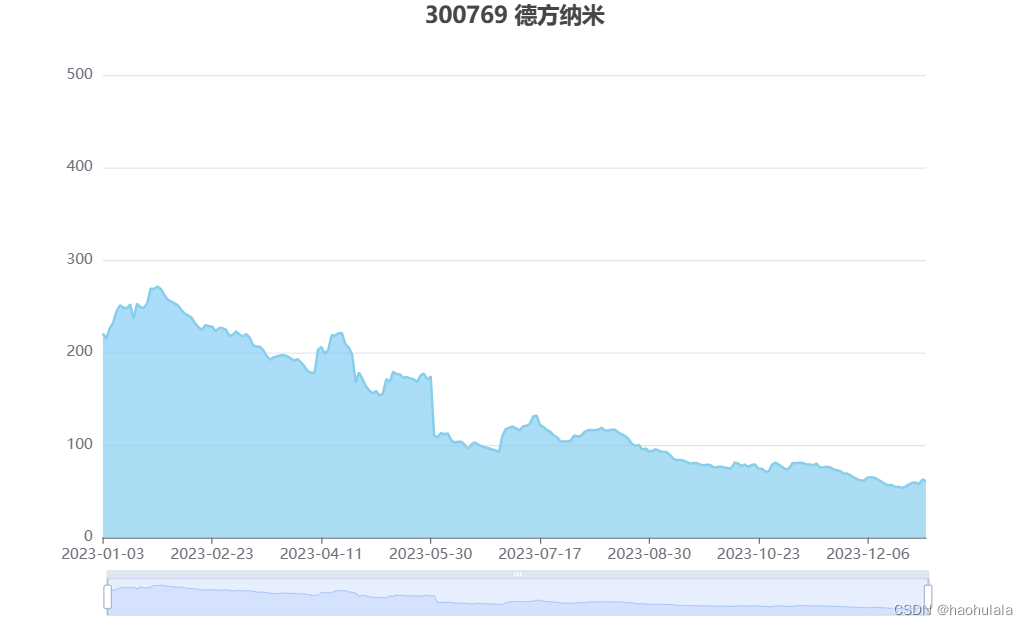
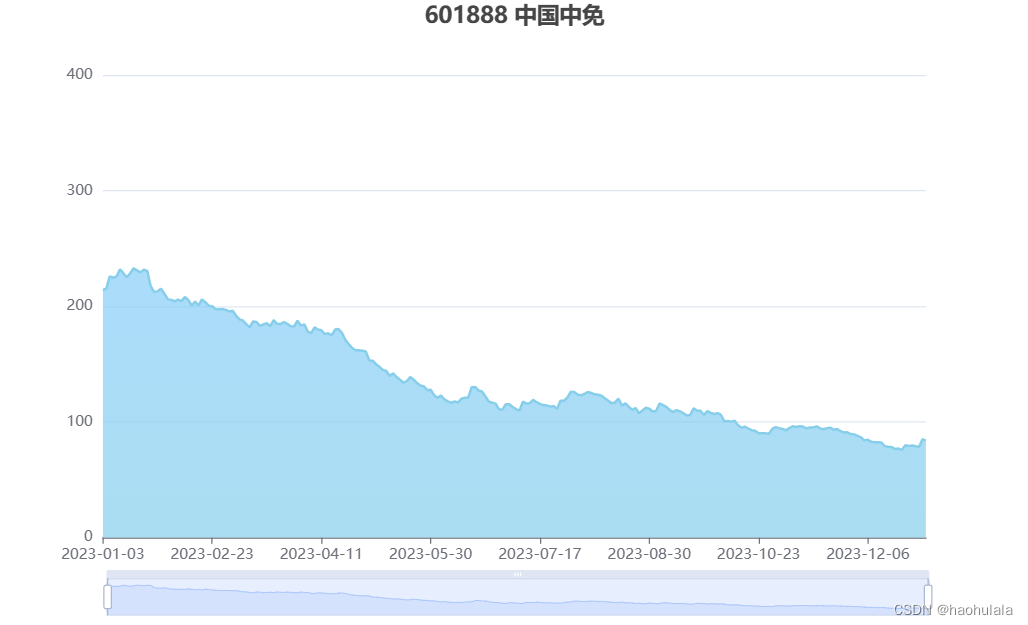
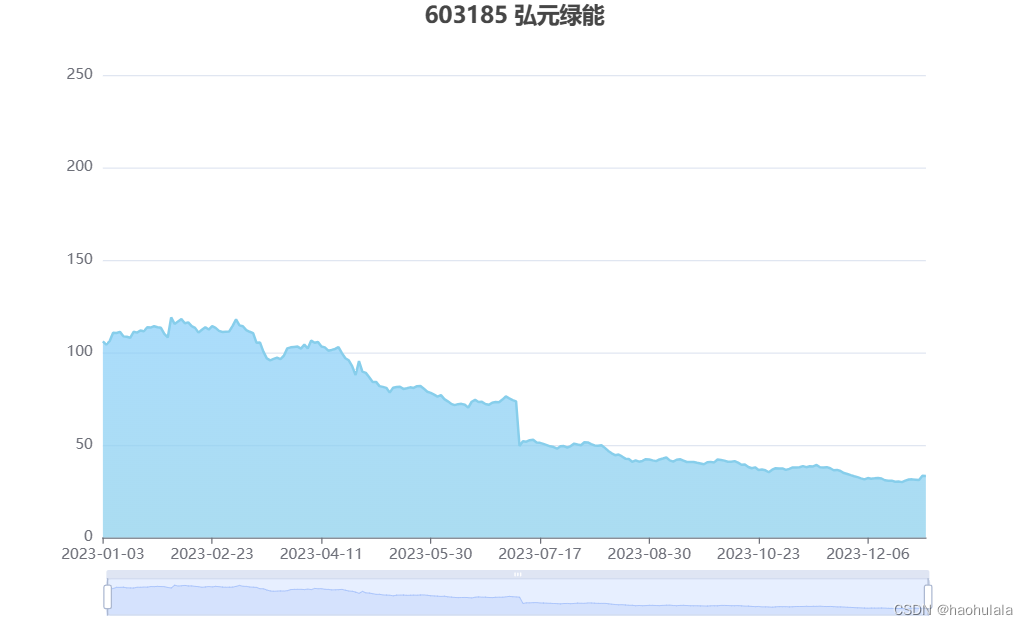
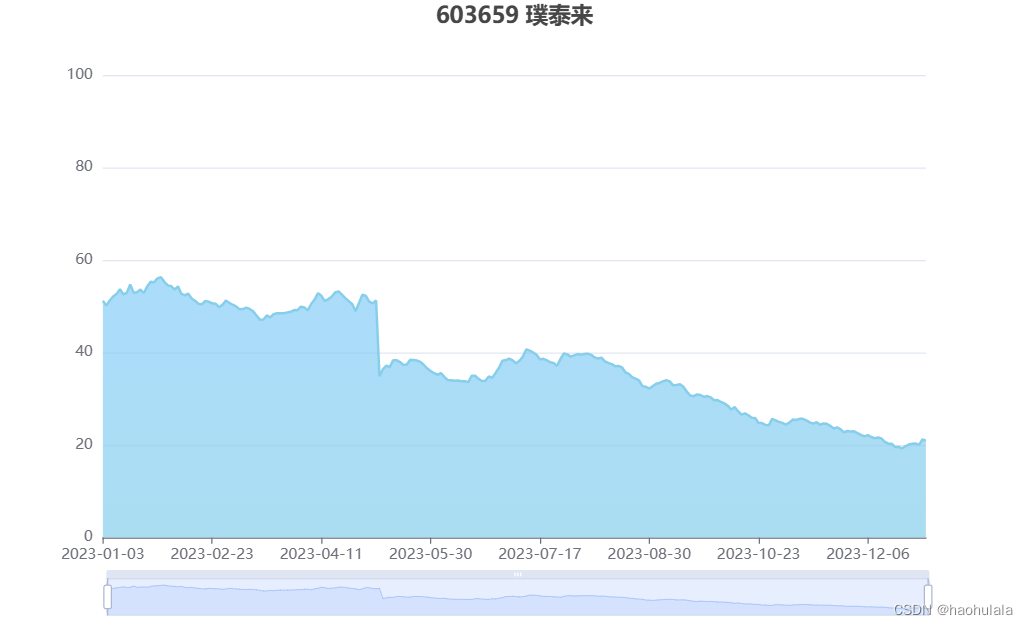
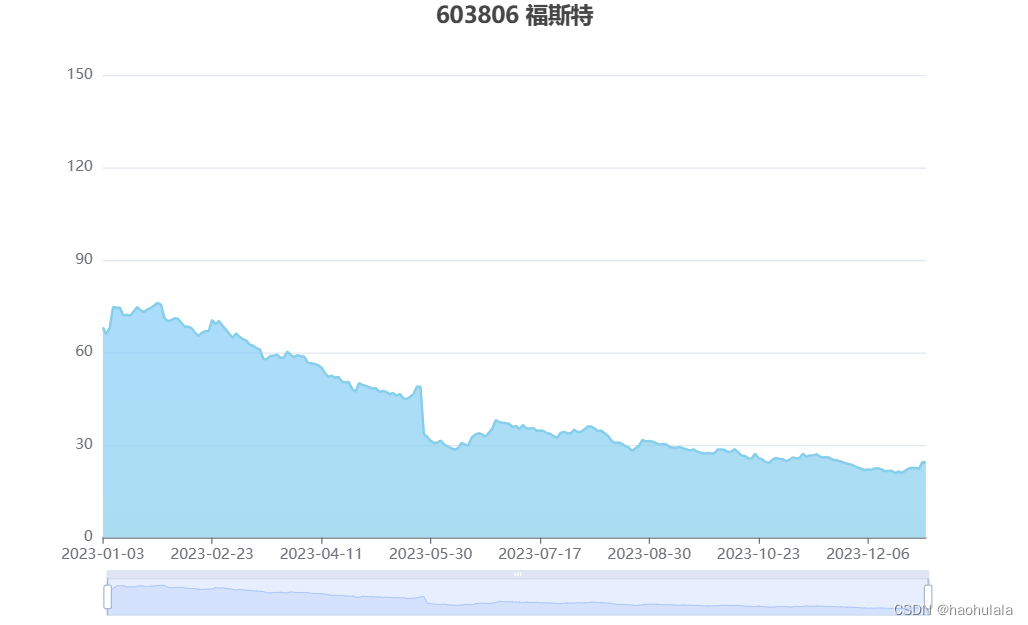
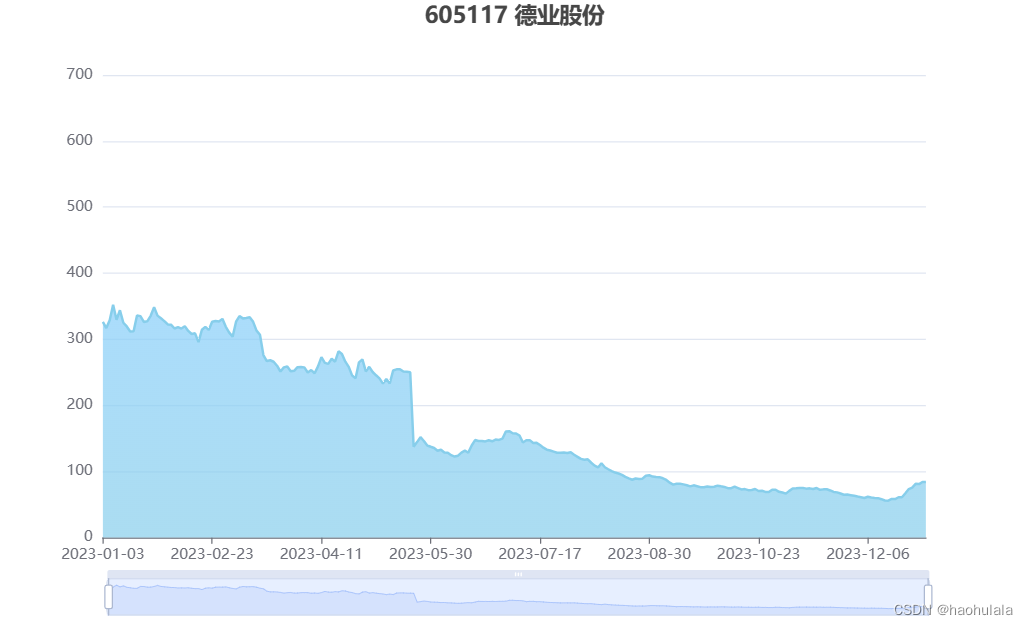
接着是跌幅排行榜
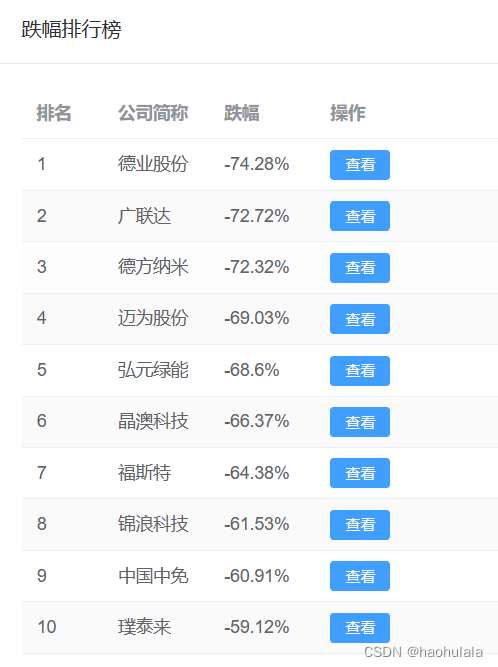
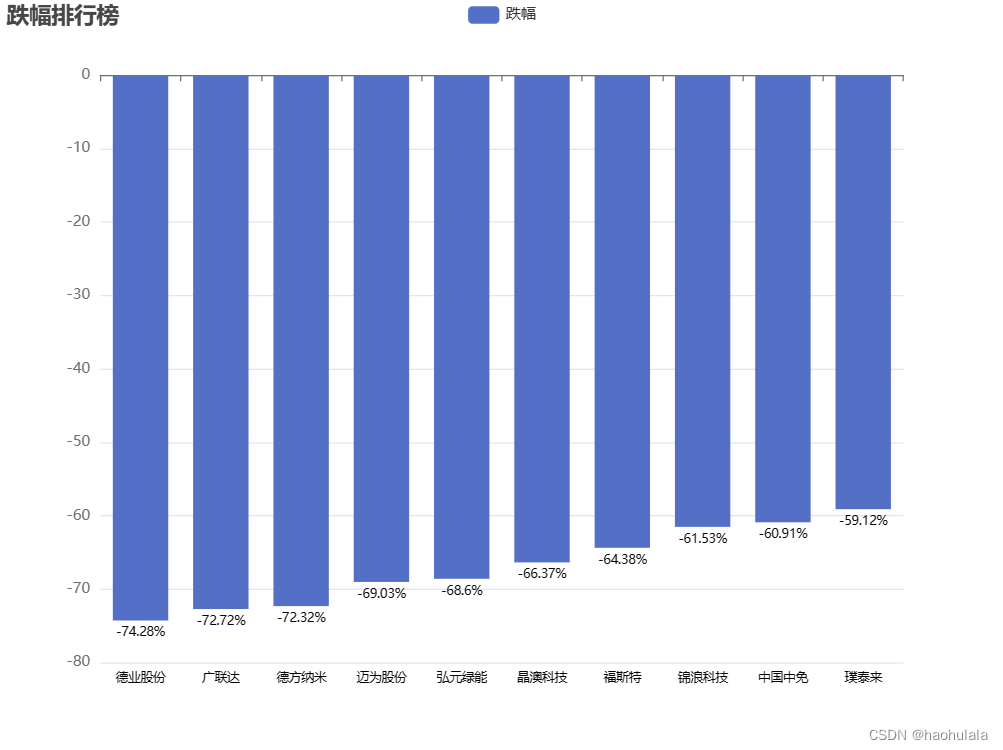
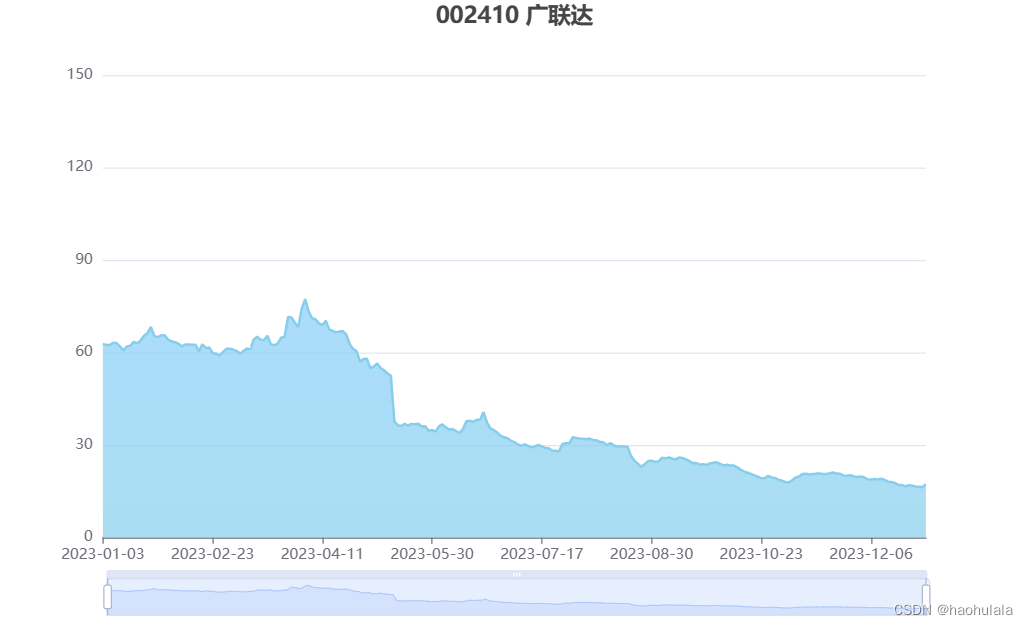
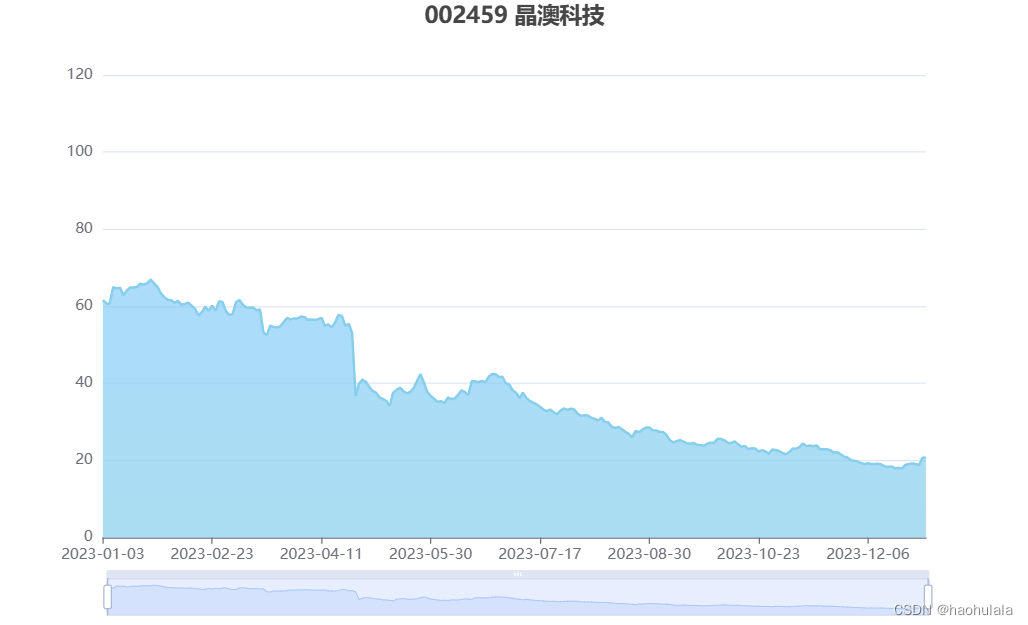
下面是排行榜上10只股票的走势图(顺序是根据文件名排的)
结语
本文介绍了获取计算涨跌排行榜的方法,以及进行涨幅排行榜前10名和跌幅排行榜前10名的股票数据展示,希望对你有所帮助。


 2198
2198

 被折叠的 条评论
为什么被折叠?
被折叠的 条评论
为什么被折叠?
 到【灌水乐园】发言


