


三方标准图层
卫星图+掩模
组合使用简易行政区图-世界、卫星图、以及掩模功能,实现了只显示每个区域的地形图的效果。
district = new AMap.DistrictSearch(opts);
    district.search('中国', function (status, result) {
      var bounds = result.districtList[0].boundaries;
      var mask = []
      for (var i = 0; i < bounds.length; i += 1) {
        mask.push([bounds[i]])
      }
      var disCountry = new AMap.DistrictLayer.World({
        // 调整图层的显示层级
        zIndex: 0,
        // 禁止掩膜,掩膜功能对其无效
        rejectMapMask: true
      })
    })
掩膜功能与前文相似,不同之处,此示例在世界地图中禁止了掩膜功能。

WMTS

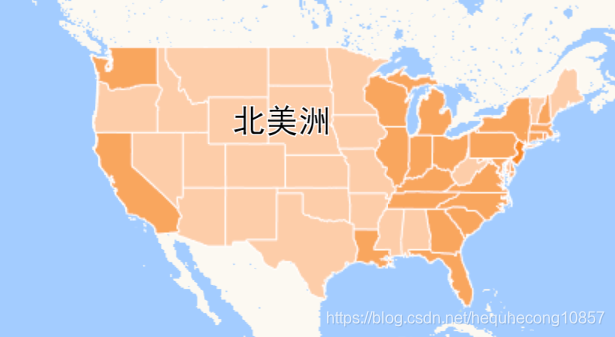
- 使用TileLayer.WMTS加载OGC标准的WMTS地图,仅支持EPSG3857坐标系统的WMTS图层。
- 本示例中,加载河北的WMS图层没有样式,需要在发布该图层的Server中配置相应的样式,本数据由GeoServer发布,需要使用uDig或者geotolls来配置相应的sld样式文件
var wms = new AMap.TileLayer.WMTS({
        url: 'https://services.arcgisonline.com/arcgis/rest/services/Demographics/USA_Population_Density/MapServer/WMTS/',
        blend: false,
        tileSize: 256,
        params: {
            Layer: '0',
            Version: '1.0.0',
            Format: 'image/png',
            TileMatrixSet: 'EPSG:3857'
        }
    });
    wms.setMap(map);

    // 加载geoserver发布的本地数据
    var wms2 = new AMap.TileLayer.WMS({
      url: 'http://localhost:8787/geoserver/webgis/wms',
      blend: false,
      tileSize: 512,
      params: { 'LAYERS': 'webgis:hebeifinance', VERSION: '1.1.1' }
    })
    wms2.setMap(map)
自有数据图层
图片图层
使用ImageLayer加载图片图层,可用于景区导览图等场景。
var imageLayer = new AMap.ImageLayer({
        url: 'http://amappc.cn-hangzhou.oss-pub.aliyun-inc.com/lbs/static/img/dongwuyuan.jpg',
        bounds: new AMap.Bounds(
            [116.327911, 39.939229],
            [116.342659, 39.946275]
        ),
        zooms: [15, 18]
    });
    var map = new AMap.Map('container', {
        resizeEnable: true,
        center: [116.33719, 39.942384],
        zoom: 15,
        layers: [
            new AMap.TileLayer(),
            imageLayer
        ]
    });
视频图层
使用VideoLayer创建视频图层,适用于需要在地图上放置视频的场景
 var bounds = new AMap.Bounds([93, -9], [147, 32]);
    var VideoLayer = new AMap.VideoLayer({
        autoplay: true,
        loop: true,
        zIndex: 130,
        //可提供不同格式以达到多浏览器兼容
        url: [
            'https://a.amap.com/jsapi_demos/static/video/cloud.m4v',
            'https://a.amap.com/jsapi_demos/static/video/cloud.mov'
        ],
        bounds: bounds,
        zooms: [3, 18],
        opacity: 0.7
    });
    VideoLayer.setMap(map);
Canvas图层
使用CanvasLayer在地图上添加canvas图层。
var canvas = document.createElement('canvas');
    canvas.width = canvas.height = 200;

    var context = canvas.getContext('2d')
    context.fillStyle = 'rgb(0,100,255)';
    context.strokeStyle = 'white';
    context.globalAlpha = 1;
    context.lineWidth = 2;

    var radious = 0;
    var draw = function () {
      context.clearRect(0, 0, 200, 200)
      context.globalAlpha = (context.globalAlpha - 0.01 + 1) % 1;
      radious = (radious + 1) % 100;

      context.beginPath();
      context.arc(100, 100, radious, 0, 2 * Math.PI);
      context.fill();
      context.stroke();

      //2D视图时可以省略
      CanvasLayer.reFresh();
	  //控制动画
      AMap.Util.requestAnimFrame(draw);
    };

    var CanvasLayer = new AMap.CanvasLayer({
      canvas: canvas,
      bounds: new AMap.Bounds(
        [116.3, 39.9],
        [116.34, 39.94]
      ),
      zooms: [3, 18],
    });

    CanvasLayer.setMap(map);
    draw();
canvas可做动画,绘制特别的图形
热力图
使用Heatmap添加热力图到地图上,适用于做热力、数据分析等场景。
var heatmap;
    map.plugin(["AMap.Heatmap"], function () {
      //初始化heatmap对象
      heatmap = new AMap.Heatmap(map, {
        radius: 25, //给定半径
        opacity: [0, 0.8]
        /*,
        gradient:{
            0.5: 'blue',
            0.65: 'rgb(117,211,248)',
            0.7: 'rgb(0, 255, 0)',
            0.9: '#ffea00',
            1.0: 'red'
        }
         */
      });
      //设置数据集:该数据为北京部分“公园”数据
      heatmap.setDataSet({
        data: heatmapData,
        max: 100
      });
    });
样例数据:

自定义图层-Canvas
使用CustomLayer创建自定义图层,以Canvas作为绘制方式。
function getData(callback) {
      AMap.plugin('AMap.DistrictSearch', function () {
        var search = new AMap.DistrictSearch();
        search.search('中国', function (status, data) {
          if (status === 'complete') {
            var positions = []
            var provinces = data['districtList'][0]['districtList']
            for (var i = 0; i < provinces.length; i += 1) {
              // 存储各省中心点和半径
              positions.push({
                center: provinces[i].center,
                radius: Math.max(2, Math.floor(Math.random() * 10))
              })
            }
            callback(positions)
          }
        });
      });
    }
    function addLayer(positions) {
      AMap.plugin('AMap.CustomLayer', function () {
        var canvas = document.createElement('canvas');
        var customLayer = new AMap.CustomLayer(canvas, {
          zooms: [3, 10],
          alwaysRender: true,//缩放过程中是否重绘,复杂绘制建议设为false
          zIndex: 120
        });
        var onRender = function () {
          var retina = AMap.Browser.retina;
          var size = map.getSize();//resize
          var width = size.width;
          var height = size.height;
          canvas.style.width = width + 'px'
          canvas.style.height = height + 'px'
          if (retina) {//高清适配
            width *= 2;
            height *= 2;
          }
          canvas.width = width;
          canvas.height = height;//清除画布
          var ctx = canvas.getContext("2d");
          ctx.fillStyle = '#08f';
          ctx.strokeStyle = '#fff';
          ctx.beginPath();
          // 遍历各省数据画圆
          for (var i = 0; i < positions.length; i += 1) {
            var center = positions[i].center;
            var pos = map.lngLatToContainer(center);
            var r = positions[i].radius;
            if (retina) {
              pos = pos.multiplyBy(2);
              r *= 2
            }
            ctx.moveTo(pos.x + r, pos.y)
            ctx.arc(pos.x, pos.y, r, 0, 2 * Math.PI);
          }
          ctx.lineWidth = retina ? 6 : 3
          ctx.closePath();
          ctx.stroke();
          ctx.fill();
        }
        customLayer.render = onRender;
        customLayer.setMap(map);
      });
    }


 2546
2546

 被折叠的 条评论
为什么被折叠?
被折叠的 条评论
为什么被折叠?
 到【灌水乐园】发言


