


 本文介绍使用matplotlib和distinctipy库生成易于区分的颜色列表方法。通过两种方式,可以为图表或数据可视化项目创建清晰且视觉上区隔良好的颜色方案。
随机数生成的颜色不容易区分,本文介绍两种,生成易于区分颜色列表的方法。
基于matplotlib
from matplotlib.patches import Rectangle
import matplotlib.pyplot as plt
import matplotlib.colors as mcolors
def plot_colortable(colors, title, sort_colors=True, emptycols=0):
cell_width = 212
cell_height = 22
swatch_width = 48
margin = 12
topmargin = 40
# Sort colors by hue, saturation, value and name.
if sort_colors is True:
by_hsv = sorted((tuple(mcolors.rgb_to_hsv(mcolors.to_rgb(color))),
name)
for name, color in colors.items())
names = [name for hsv, name in by_hsv]
else:
names = list(colors)
n = len(names)
ncols = 4 - emptycols
nrows = n // ncols + int(n % ncols > 0)
width = cell_width * 4 + 2 * margin
height = cell_height * nrows + margin + topmargin
dpi = 72
fig, ax = plt.subplots(figsize=(width / dpi, height / dpi), dpi=dpi)
fig.subplots_adjust(margin/width, margin/height,
(width-margin)/width, (height-topmargin)/height)
ax.set_xlim(0, cell_width * 4)
ax.set_ylim(cell_height * (nrows-0.5), -cell_height/2.)
ax.yaxis.set_visible(False)
ax.xaxis.set_visible(False)
ax.set_axis_off()
ax.set_title(title, fontsize=24, loc="left", pad=10)
for i, name in enumerate(names):
row = i % nrows
col = i // nrows
y = row * cell_height
swatch_start_x = cell_width * col
text_pos_x = cell_width * col + swatch_width + 7
ax.text(text_pos_x, y, name, fontsize=14,
horizontalalignment='left',
verticalalignment='center')
ax.add_patch(
Rectangle(xy=(swatch_start_x, y-9), width=swatch_width,
height=18, facecolor=colors[name], edgecolor='0.7')
)
return fig
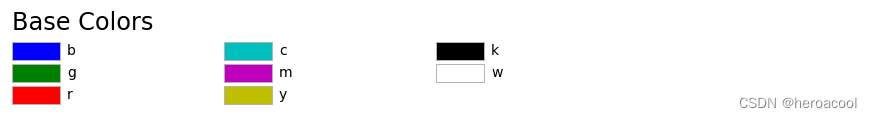
plot_colortable(mcolors.BASE_COLORS, "Base Colors",
sort_colors=False, emptycols=1)
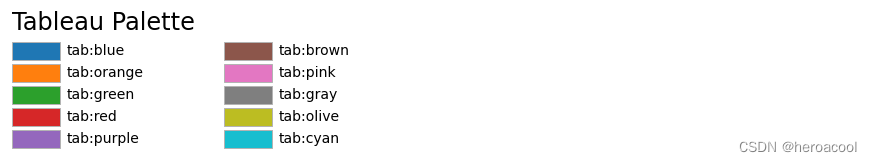
plot_colortable(mcolors.TABLEAU_COLORS, "Tableau Palette",
sort_colors=False, emptycols=2)
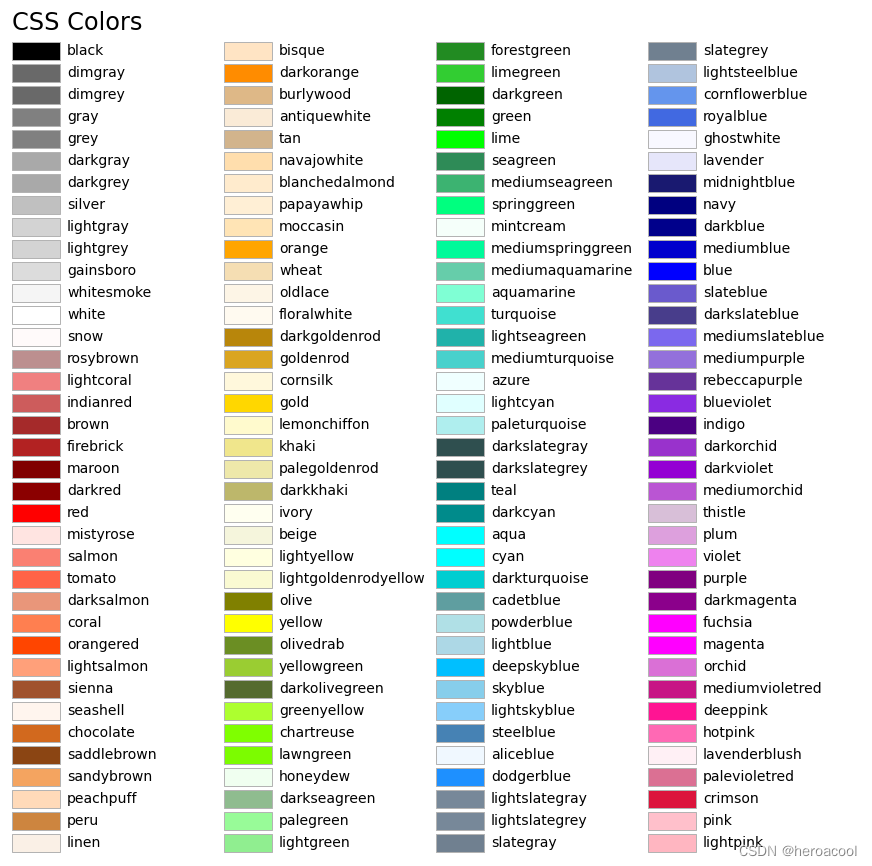
plot_colortable(mcolors.CSS4_COLORS, "CSS Colors")
plt.show()
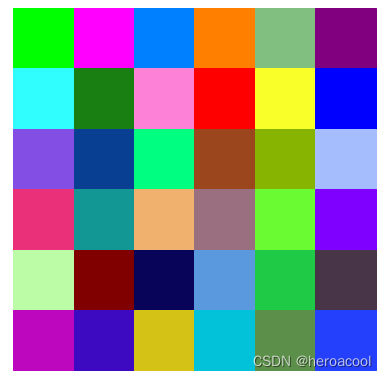
基于distinctipy
from distinctipy import distinctipy

# number of colours to generate
N = 36

# generate N visually distinct colours
colors = distinctipy.get_colors(N)

# display the colours
distinctipy.color_swatch(colors)
参考资料
- https://github.com/alan-turing-institute/distinctipy


 51万+
51万+

 被折叠的 条评论
为什么被折叠?
被折叠的 条评论
为什么被折叠?
 到【灌水乐园】发言


