


1.正弦振动程序
%Sample1_1
dt = 0.02;    %采样间隔
f=3;          %采样频率为3Hz
t=0:dt:5;     %持续时间
x=0.5*sin(2*pi*f*t+1); %信号
plot(t,x);    %绘制信号图形
xlabel('时间/s'); %显示横坐标信息
ylabel('振幅'); %显示纵坐标信息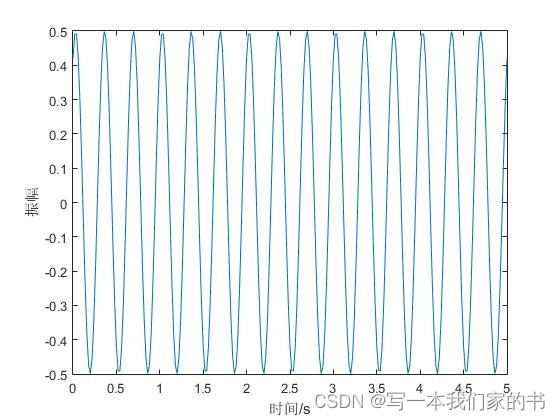
2.两同频振动的合成
%Sample1_2;
f=3;
dt=0.02;
N=200;
n=0:N-1;
t=dt*n;

f1=0.5*sin(2*pi*f*t+1);
subplot(3,1,1);
plot(t,f1);
title('f1波形');
xlabel('时间/s');
ylabel('振幅');
ylim([-1 1]);

%f2=0.3*sin(2*pi*f*t+2.2);
%f2=0.3*sin(2*pi*f*t+1+2*pi);
%f2=0.3*sin(2*pi*f*t+1+1*pi);
f2=0.5*sin(2*pi*f*t+1+1*pi);
subplot(3,1,2);
plot(t,f2);
title('f2波形');
xlabel('时间/s');
ylabel('振幅');
ylim([-1 1]);

subplot(3,1,3);
plot(t,f1+f2);
title('f1+f2波形');
xlabel('时间/s');
ylabel('振幅');
ylim([-1 1]);
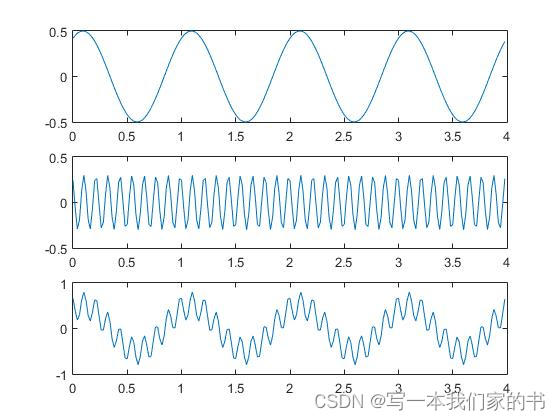
3.两异频振动合成
clc;
clear all;
close all;

%信号参数
N=200;
f1=1;
f2=9;
ts=0.02;
n=0:N-1;
t = n*ts;

%信号表达式
f1=0.5*sin(2*pi*f1*t+1);
f2=0.3*sin(2*pi*f2*t+2.2);

%绘制信号波形
subplot(3,1,1);
plot(t,f1);

subplot(3,1,2);
plot(t,f2);

subplot(3,1,3);
plot(t,f1+f2);
4.拍的产生
%Sample1_4

%信号参数
f1=10;
f2=9;
A=0.3;
N=400;
ts=0.01;
n=0:N-1;
t=n*ts;

%信号表达式
f1=0.3*sin(2*pi*f1*t+1);
f2=0.3*sin(2*pi*f2*t+3);

%绘制图像
subplot(3,1,1);
plot(t,f1);

subplot(3,1,2);
plot(t,f2);

subplot(3,1,3);
plot(t,f1+f2);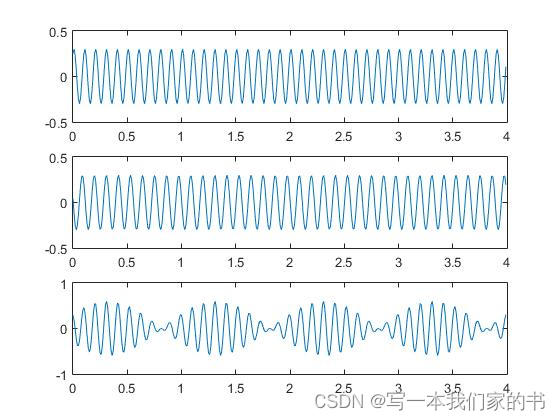
5.改变相位差的拍
%Sample1_5
clc;
clear all;
close all;
N=400;dt=0.01;f1=10;f2=9; %采样点数/间隔和两个振动的频率

n=0:N-1;t=n*dt; %定义时间离散值
x1=.3*sin(2*pi*f1*t+1);
for ii=1:6
    x2=.3*sin(2*pi*f2*t+ii*0.5);
   % posplot = ['6,1,' num2str(ii)];
    subplot(6,1,ii);plot(t,x1+x2);
end

xlabel('时间/s');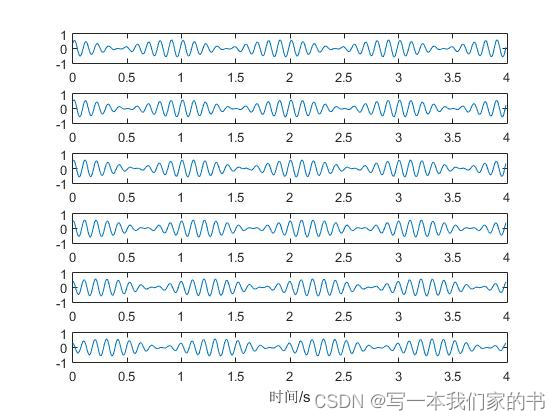
6.改变拍频差
clc;
clear all;
close all;

%信号参数
N=400;dt=0.01;f1=10;f2=9.9;
n=0:N-1;t=n*dt;
x1=.3*sin(2*pi*f1*t+1);
x2=.3*sin(2*pi*f2*t+1);

%绘制波形
subplot(6,1,1); plot(t,x1+x2);

for ii=1:5
   x2=.3*sin(2*pi*(10-0.5*ii)*t+1);
   subplot(6,1,ii+1);
   plot(t,x1+x2);
end
xlabel('时间/s');
ylabel('振幅') ; 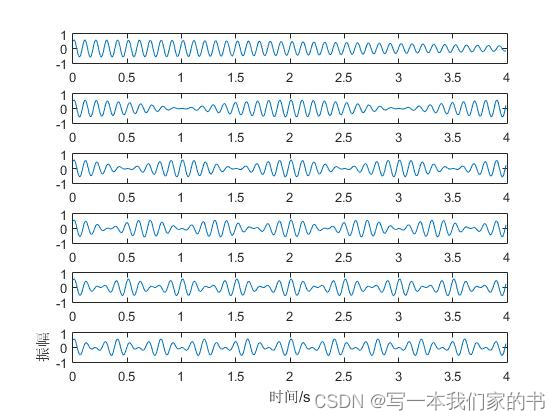
7.拍的产生
clc;
clear all;
close all;

%信号参数
N=500;
ts=0.02;
f1 = 5;
f2 = 4.5;
n=0:N-1;
t=n*ts;

%信号表示
x1=0.5*sin(2*pi*f1*t+5);
x2=0.5*sin(2*pi*f2*t+5);

%绘制波形
subplot(3,1,1);
plot(t,x1);

subplot(3,1,2);
plot(t,x2);

subplot(3,1,3);
plot(t,x1+x2);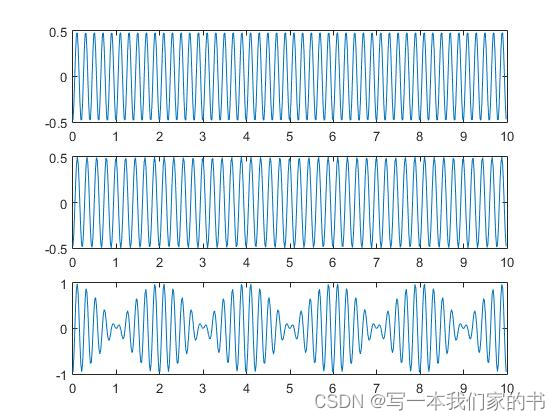
8.振动合成
clc;
close all;
clear all;

N=600;
n=0:N-1;
ts = 0.01;
t= n*ts;

x1=0.8*sin(2*pi*t+1.3);
x2=0.8*sin(2*pi*5*t+0.2);
x3=0.8*sin(2*pi*20*t+0.3);

subplot(4,1,1);
plot(t,x1);

subplot(4,1,2);
plot(t,x2);

subplot(4,1,3);
plot(t,x3);

subplot(4,1,4);
plot(t,x1+x2+x3);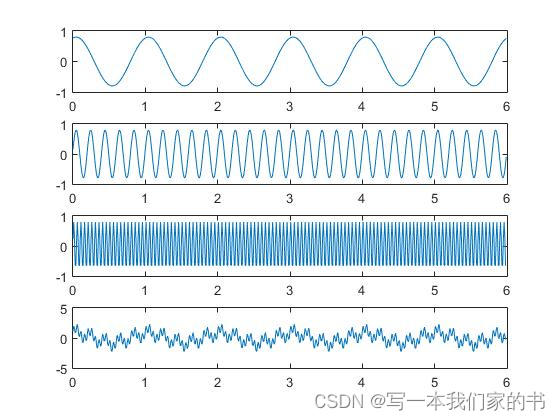


 236
236


 被折叠的 条评论
为什么被折叠?
被折叠的 条评论
为什么被折叠?
 到【灌水乐园】发言


