


数据分析中,经常要用到频度分析。在Spotfire中,可通过插入Binned Column方式自定义频度,快速、便捷的进行频度分析。
比如,通过原始数据统计出的词频表如下所示:

由于各词类的词条数相差很大(最少1条,最多几千条),放在同一张图上基本没法看。
虽然可以使用Show/Hide Items来仅显示一部分数据(如Top 40),如下图所示,但毕竟,不能反映数据全貌。

要显示全貌,频度统计是个不错的方法。
那么,如何在Spotfire数据集中生成频度数据呢?
方法如下:
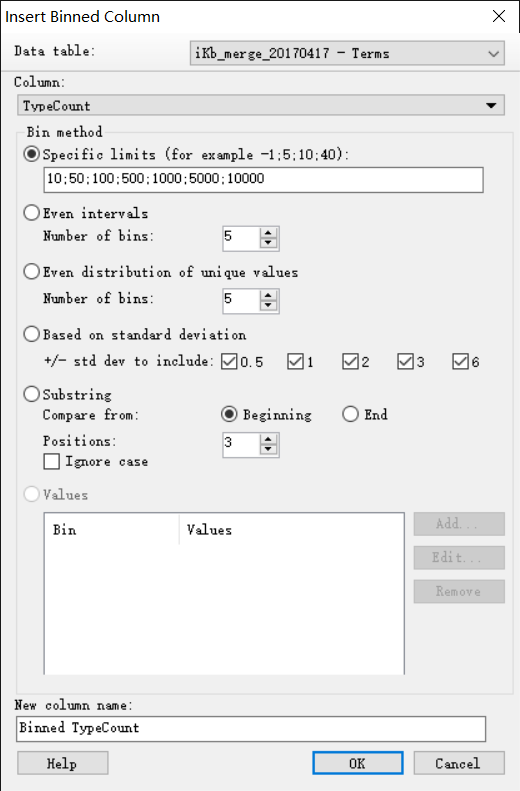
1. Insert-> Binned Column(分箱方法有好几种,试了一下,我还是比较喜欢第一种,即直接指定边界值的方法)
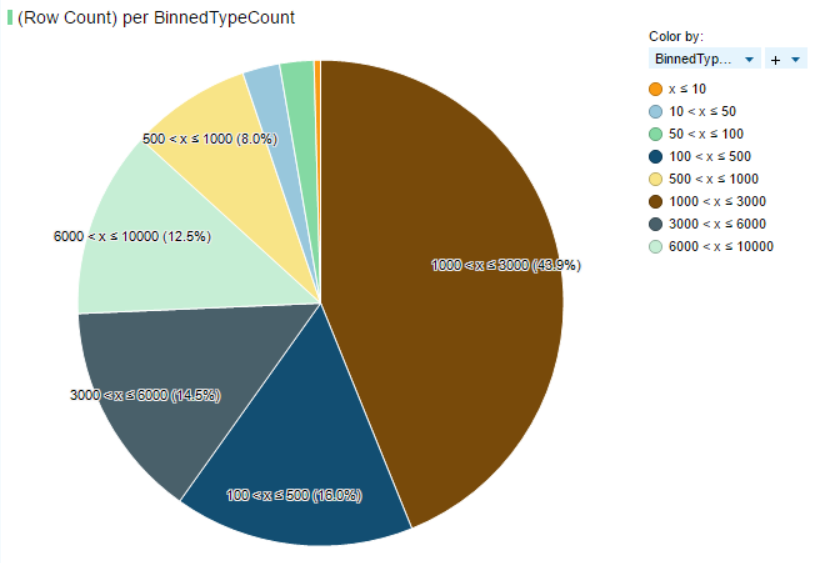
2. 插入分箱列完成后,可在图表中选择该列,查看效果。
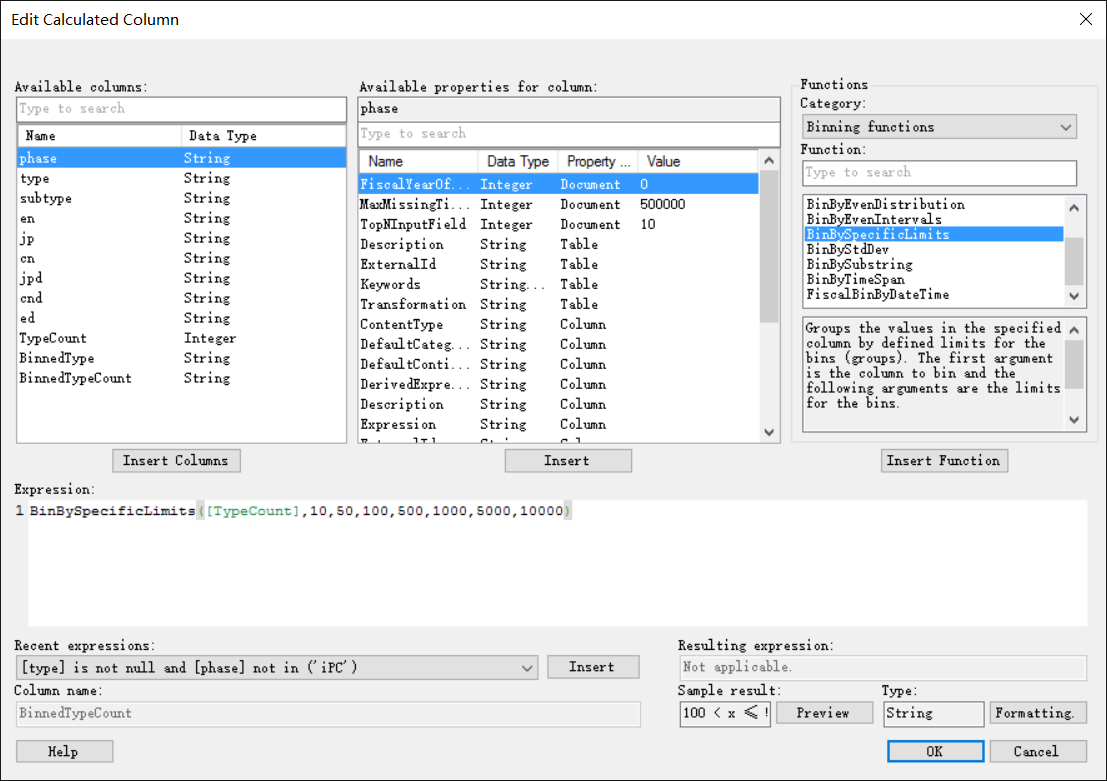
3. 如果要更改分箱方法或修改分箱参数(如边界值),可在Edit -> Column Properties中进行修改。
附记:
What is Binning?
----------------------------------------------------------------------------------------------------------------------------------------------
Binning is a way to group a number of more or less continuous values into a smaller number of "bins". For example, if you have data about a group of people, you might want to arrange their ages into a smaller number of age intervals. Numeric columns can also be temporarily grouped by right-clicking on a column selector and clicking Auto-bin Column.
There is also an option to group categorical values into bins. This is useful when you have more categorical values in a column than you find necessary. Your visualization may for example show sales of apples, pears, oranges and limes, but you are interested in citrus fruit sales compared to apples and pears sales. Then oranges and limes can be grouped into a bin.


 2587
2587

 被折叠的 条评论
为什么被折叠?
被折叠的 条评论
为什么被折叠?
 到【灌水乐园】发言


