


一.使用VS自带的性能测试工具进行分析
教程:analyzingapplication performance by using profiling tolls
应该使用带有调试信息的release版进行profile:profiledebug or release build?
1. ProfilingFAQ #4: The top sampled function is [ntdll.dll], now what I do?!
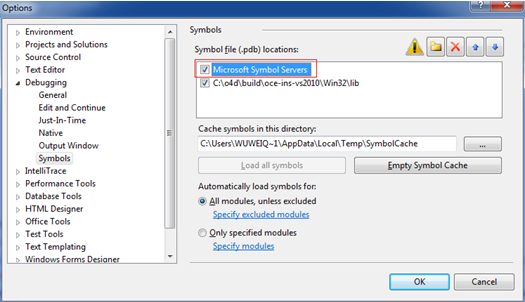
如果想要获取系统dll的调试信息,在VS IDE->Tools->options->Debugging->symbols勾选上microsoftsymbol serves.如下图所示:
2. 使用VS IDE的profiler工具时,在使用Analyze->launch performance wizard设置好后,再使用Analyze->profile->startprofiling,这时候VS提示”injection of runtime library failed”。这个问题的解决办法可见:VS2010中的profile(性能剖析)。
二.使用VS自动的代码分析工具分析应用程序的质量
教程:analyzingapplication quality by using code analysis tools
Code analysis forc/c++ overview
>the c/c++ code analysis tool providesinformation to developers about possible defects in their c/c++ source code. Commoncoding errors reported by the tool include buffer overruns, un-initializedmemory, null pointer dereferences, and memory and resource leaks.
三.在linux环境下使用grpof工具进行性能测试
Gprof tutorial – howto use linux gnu gcc profiling tool.


 3209
3209

 被折叠的 条评论
为什么被折叠?
被折叠的 条评论
为什么被折叠?
 到【灌水乐园】发言


