


基于官方文档的Python库matplotlib简介
本文参考matplotlib pyplot tutorial文档,是笔者对matplotlib库的认真回顾。
绘图简介
使用matplotlib库绘图,原理很简单,就是下面这5步:
- 创建一个图纸 (figure)
- 在图纸上创建一个或多个绘图(plotting)区域(也叫子图,坐标系/轴,axes)
- 在plotting区域上描绘点、线等各种marker
- 为plotting添加修饰标签(绘图线上的或坐标轴上的)
- 其他各种DIY
在上面的过程中,主要就是下面三个元素:
- 变量
- 函数
- 图纸(figure)和子图(axes, 也可以理解成坐标轴)
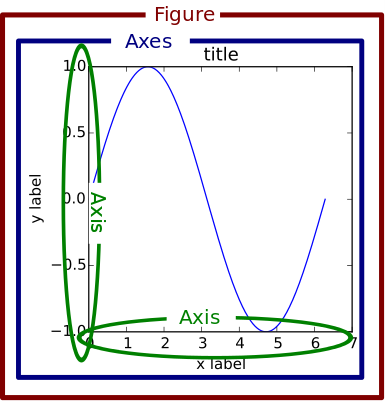
其中,变量和函数通过改变figure和axes中的元素(例如:title,label,点和线等等)一起描述figure和axes,也就是在画布上绘图。图片结构如下图所示:
然后就可以通过matplotlib画一个简单的图了
注意:下面的代码是个最简单的情况,所以上面所讲的第1、2、5步都被我省略了
import matplotlib.pyplot as plt  # 调用绘图库
'''figure和axes的声明可以省略(就是选用默认情况)'''
plt.plot([1,2,3,4])
plt.xlabel('some numbers')
plt.ylabel('some numbers')
plt.title('a straight line')-
可以看到,画最简单的图只需要两行代码就够了
先导入plt→import matplotlib.pyplot as plt,然后画图→plt.plot([1,2,3,4]),这实际上就是5步中的第3步。
当然上面代码的后三行是修饰部分,是5布当中的第4步。
第1步和第2步实际上已经被Python智能默认了。下面多图多axes会讲到。然后,问题来了。为什么y是1-4,而x是0-3?
因为,如果你只提供一个列表或数组参数给plot()命令,matplotlib会默认这是给y的,然后自动生成x。
 解释:
解释:
附plot()的参数:plot(*args,**kwargs),其中args为x,y以及绘图线的颜色和类型。plt模块除了plot()函数绘制折线图,还包括很多绘图函数以及其他操作figure或axes的函数,详见plt官方API
这一次,我们传入两个列表,并且对描绘线的类型和颜色参数进行定义
plt.plot([1,2,3,4], [1,4,9,16], 'ro')
plt.axis([0, 6, 0, 20])
axis()描述了坐标轴的度量
之前都是传入列表的情况,下面是传入数组的情况,而且后者才是主流。
import numpy as np
# evenly sampled time at 200ms intervals
t = np.arange(0., 5., 0.2)
# red dashes, blue squares and green triangles
plt.plot(t, t, 'r--', t, t**2, 'bs', t, t**3, 'g^')
操控绘图线
绘图线有很多属性:线宽,类型,各种属性。参考matplotlib.lines
例如:plt.plot(x, y, linewidth=2.0)
多图多axes
MATLAB和plt1都有当前figure和axes的概念
也就是说,通过plt 进行的操作都是对当前图或子图进行的,所有的绘图命令都是针对当前figure和axes的。
gca()可以输出当前axes,gcf()可以输出当前figure。不过一般都不用考虑这么多。下面是一个双子图的例子:
def f(t):
    return np.exp(-t) * np.cos(2*np.pi*t)

t1 = np.arange(0.0, 5.0, 0.1)
t2 = np.arange(0.0, 5.0, 0.02)

plt.figure(1)
plt.subplot(211)
plt.plot(t1, f(t1), 'bo', t2, f(t2), 'k')

plt.subplot(212)
plt.plot(t2, np.cos(2*np.pi*t2), 'r--')
如果figure()和subplot()没有定义的话,都默认为figure(1)和subplot(111)。
figure()命令定义图片数和其他关键字参数。
例如: figure(1) 定义图片1; figure(2) 定义图片2……
subplot()命令定义子图数,横轴,纵轴,还可以定义其他的关键字参数。
例如: subplot(211) 定义子图1在第一行第一列; subplot(212) 定义子图2在第一行第二列……
PS1: 若子图数小于10,那么参数之间有没有逗号都无所谓。
PS2: 通过plt.axes([left, bottom, width, height])命令可以自由定义子图位置大小。
plt.figure(1)                # the first figure图一有两个子图
plt.subplot(211)             # the first subplot in the first figure
plt.plot([1, 2, 3])
plt.subplot(212)             # the second subplot in the first figure
plt.plot([4, 5, 6])


plt.figure(2)                # a second figure图二有一个子图
plt.plot([4, 5, 6])          # creates a subplot(111) by default

plt.figure(1)                # figure 1 current; subplot(212) still current
plt.subplot(211)             # make subplot(211) in figure1 current
plt.title('Easy as 1, 2, 3') # subplot 211 title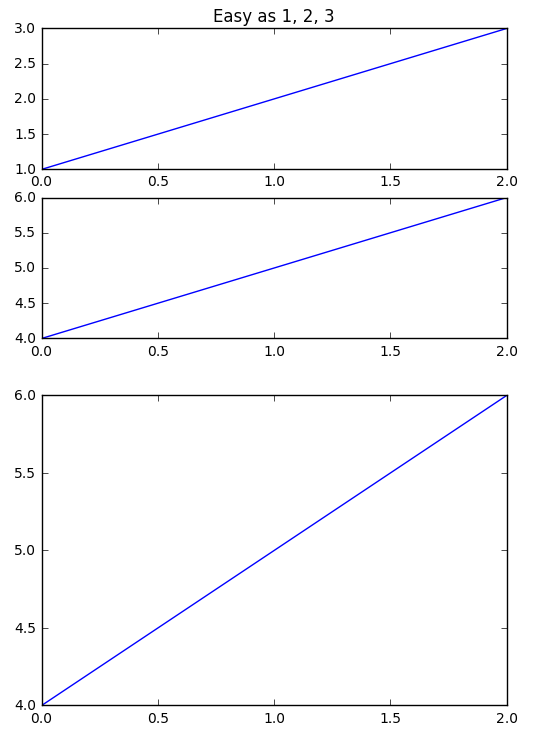
由于根据特定布局创建Figure和subplot是一件非常常见的任务,于是便出现了一个更为方便的方法plt.subplots,它可以创建一个新的Figure,并返回一个含有已创建的subplot对象的Numpy数组:
In [22]: fig, axes = plt.subplots(2, 3)
In [23]: axes  # 2行3列数组,元素是Axes类,每一个元素代表一个子图
Out[23]:
array([[Axes(0.125, 0.53364;...),
        Axes(...),
        Axes(...)],
       [Axes(...),
        Axes(...),
        Axes(...)]], dtype=object)
有关该方法的更多信息,pyplot.subplots的选项:
- figure过度会有内存警告,只有通过close()或图形用户界面关掉figure才会释放内存。当然也可以直接删除:clf()删除当前figure,cla()删除当前axes
-
利用Figure的
subplots_adjust方法可以轻而易举地修改间距,此外,它也是个顶级函数
| 参数 | 说明 |
|---|---|
| nrows | subplot的行数 |
| ncols | subplot的列数 |
| sharex | 所有subplot应该使用相同的X轴刻度(调节xlim将会影响所有subplot) |
| sharey | 所有subplot应该使用相同的Y轴坐标(调节ylim将会影响所有subplot) |
| subplot_kw | 用于创建各subplot的关键字典 |
| **fig_kw | 创建figure时的其他关键字,如plt.subplots(2,2,figsize=(8,6)) |
axes与plt
可以说,plt针对当前子图或者全局操作,而axes类只关注与它本身(本身代表一个子图)。
# 举一个刚刚写完的一个三维点图列子
import pandas as pd
import matplotlib.pyplot as plt
from mpl_toolkits.mplot3d import Axes3D  # 3d


if __name__ == '__main__':
    inpath_sample = r'~/文件名.csv'  # 一个4列的数据表
    data = pd.read_csv(r'D:\electricalData\somecsv\some_spldliang.csv', header=0, index_col=0)  # dataframe
    fig = plt.figure()
    ax = fig.add_subplot(111, projection='3d')  # 创建axes类
    xs = data['locus10'].values
    ys = data['locus50'].values
    zs = data['locus90'].values
    ax.scatter(xs, ys, zs, c='r', marker='o')  # axes类可以绘图
    ax.set_xlim(0)  # axes类可以操作本身(子图)的信息,只不过和plt模块的姿势不同
    ax.set_ylim(0)
    ax.set_zlim(0)
    ax.set_xlabel('X Label')
    ax.set_ylabel('Y Label')
    ax.set_zlabel('Z Label')
    plt.show()
axes: 人家也是棒棒的,什么都能干O(∩_∩)O
文本工作
test()命令可以在任意位置添加文本
xlabel(), ylabel(), title()分别用来在横轴,纵轴和标题区域添加文本。
mu, sigma = 100, 15
x = mu + sigma * np.random.randn(10000)

# the histogram of the data
n, bins, patches = plt.hist(x, 50, normed=1, facecolor='g', alpha=0.75)


plt.xlabel('Smarts')
plt.ylabel('Probability')
plt.title('Histogram of IQ')
plt.text(60, .025, r'$\mu=100,\ \sigma=15$')
plt.axis([40, 160, 0, 0.03])
plt.grid(True)
例:t = plt.xlabel('my data', fontsize=14, color='red')
标记文本
text()自由添加文本的最大作用就是注释,而 annotate()可以帮我们更好的完成这个任务。
annotate()需要考虑两点,一个是注释点,一个是文本点。
ax = plt.subplot(111)

t = np.arange(0.0, 5.0, 0.01)
s = np.cos(2*np.pi*t)
line, = plt.plot(t, s, lw=2)

plt.annotate('local max', xy=(2, 1), xytext=(3, 1.5),
            arrowprops=dict(facecolor='black', shrink=0.05),
            )

plt.ylim(-2,2)
上面的annotate()坐标系都是用的数据坐标系,还有其他的坐标系可选。
见Annotating text和Annotating Axes
对数坐标轴和其他非线性坐标轴
matplotlib不止于线性坐标轴,还可以用对数或分对数坐标轴
例如改变x轴坐标尺度:plt.xscale(‘log’)
# make up some data in the interval ]0, 1[
y = np.random.normal(loc=0.5, scale=0.4, size=1000)
y = y[(y > 0) & (y < 1)]
y.sort()
x = np.arange(len(y))

# plot with various axes scales
plt.figure(1)

# linear
plt.subplot(221)
plt.plot(x, y)
plt.yscale('linear')
plt.title('linear')
plt.grid(True)


# log
plt.subplot(222)
plt.plot(x, y)
plt.yscale('log')
plt.title('log')
plt.grid(True)


# symmetric log
plt.subplot(223)
plt.plot(x, y - y.mean())
plt.yscale('symlog', linthreshy=0.05)
plt.title('symlog')
plt.grid(True)

# logit
plt.subplot(224)
plt.plot(x, y)
plt.yscale('logit')
plt.title('logit')
plt.grid(True)
将图标保存到文件
利用plt.savefig可以将当前图标保存到文件。该方法相当于Figure对象的实例方法savefig。例如,要将图标保存为SVG文件,你只需输入:plt.savefig('figpath.svg')。文件类型是通过文件扩展名推断出来的
Figure.savefig方法的参数及说明如下表所示:
| 参数 | 说明 |
|---|---|
| fname | 含有文件路径的字符串或Python的文件型对象。图像格式由文件扩展名推断得出 |
| dpi | 图像分辨率(每英寸点数),默认为100 |
| favecolor, edgecolor | 图像的背景色,默认为”w”(white) |
| format | 显示设置文件格式(“png”, “pdf”, “svg”, “ps”, “eps”…) |
| bbox_inches | 图标需要保存的部分。如果设置为”tight”,则将尝试检出图标周围的空白部分 |
- matplotllib.pyplot的习惯性简写 ↩


 6248
6248


 被折叠的 条评论
为什么被折叠?
被折叠的 条评论
为什么被折叠?
 到【灌水乐园】发言


