


自定义matplotlib样式recParam和style绘图风格
文章目录
版权声明:本文整合了多篇原创文章内内容,对样式控制做了个总结
matplotlib自定义 - Arthur的个人页面 - OSCHINA - 中文开源技术交流社区
本文为CSDN博主「LoveMIss-Y」的原创文章,遵循CC 4.0 BY-SA版权协议,转载请附上原文出处链接及本声明。
原文链接:matplotlib教程之——自定义配置文件和绘图风格(rcParams和style
一、什么是rcParams?
我们在使用matplotliblib画图的时候经常会遇见中文或者是负号无法显示的情况,我们会添加下面两句话:
from matplotlib.pylab import mpl

mpl.rcParams['font.sans-serif'] = ['SimHei']

mpl.rcParams['axes.unicode_minus']=False
实际上,pylot使用rc配置文件来自定义图形的各种默认属性,称之为rc配置或rc参数。通过rc参数可以修改默认的属性,包括窗体大小、每英寸的点数、线条宽度、颜色、样式、坐标轴、坐标和网络属性、文本、字体等。
官网直达链接:Customizing Matplotlib with style sheets and rcParams — Matplotlib 3.4.3 documentation
二、 matplotlibrc文件
matplotlib使用matplotlibrc [matplotlib resource configurations]配置文件来自定义各种属性,我们称之为rc配置或者rc参数。在matplotlib中你可以控制几乎所有的默认属性:视图窗口大小以及每英寸点数[dpi],线条宽度,颜色和样式,坐标轴,坐标和网格属性,文本,字体等属性。matplotlib从下面的3个地方按顺序查找matplotlibrc文件:
- 当前工作目录下的matplotlibrc,通常用在你不想被其它地方使用的特定自定义[customizations]
- 用户默认的自定义在.matplotlib/matplotlibrc里。查看 .matplotlib目录存放位置
- python安装目录/matplotlib/mpl-data/matplotlibrc.如果是linux,那么python安装目录像这样:/usr/lib/python2.5/site-packages。如果在windows,可能是c:\pytho2.5\lib\site-packages。每次你安装matplotlib,这个文件就会被覆盖。如果你想要你的自定义配置保存下来,请把这个文件放到你的.matplotlib目录下。
想查看当前工作的matplotlibrc文件是哪个,你可以使用下面的方式查看:
>>> import matplotlib
>>> matplotlib.matplotlib_fname()
'/home/foo/.matplotlib/matplotlibrc'
请看下面matplotlibrc文件例子
三、rc动态配置-设置matplotlib字体 和样式设置
在matplotlib中可以通过多种方式对绘图的字体和风格进行自定义,这里介绍三种方法
- pylab进行配置
import matplotlib.pylab as pylab

# plt.rcParams['font.family'] = 'Arial'  # 设置字体样式
# plt.rcParams['font.weight'] = 'bold'

myparams = {
   'axes.labelsize': '15',
   'axes.labelweight': 'bold',
    "ticklabel.fontsize":"10",
   'xtick.labelsize': '15',
   'ytick.labelsize': '15',
   'lines.linewidth': 1.5,
   'legend.fontsize': "15",
   'font.size': '15',
#    'legend.fontsize':"18",
   'font.family': 'Times New Roman',
  "font.weight":"bold",
#    'figure.figsize': '16, 9'  #图片尺寸
}

pylab.rcParams.update(myparams)  #更新自己的设置
- **你可以在python脚本或者python交互式环境里动态的改变默认rc配置。所有的rc配置变量称为matplotlib.rcParams 使用字典格式存储,它在matplotlib中是全局可见的。rcParams可以直接修改,**如:
import matplotlib as mpl
mpl.rcParams['lines.linewidth'] = 2
mpl.rcParams['lines.color'] = 'r'
matplotlib.rcParams[‘figure.figsize’]	#图片像素
matplotlib.rcParams[‘savefig.dpi’]		#分辨率
plt.savefig(‘plot123_2.png’, dpi=200)	#指定分辨率
plt.rcParams['savefig.dpi'] = 300 #图片像素
plt.rcParams['figure.dpi'] = 300 #分辨率
# 默认的像素:[6.0,4.0],分辨率为100,图片尺寸为 600&400
# 指定dpi=200,图片尺寸为 1200*800
# 指定dpi=300,图片尺寸为 1800*1200
# 设置figsize可以在不改变分辨率情况下改变比例

plt.rcParams['figure.figsize'] = (5.0, 4.0)     # 显示图像的最大范围
plt.rcParams['image.interpolation'] = 'nearest' # 差值方式,设置 interpolation style
plt.rcParams['image.cmap'] = 'gray'             # 灰度空间


#设置rc参数显示中文标题
#设置字体为SimHei显示中文
plt.rcParams['font.sans-serif'] = 'SimHei'
#设置正常显示字符
plt.rcParams['axes.unicode_minus'] = False
#设置线条样式
plt.rcParams['lines.linestyle'] = '-.'
#设置线条宽度
plt.rcParams['lines.linewidth'] = 3
- Matplotlib还提供了一些便利函数来修改rc配置。matplotlib.rc()命令利用关键字参数来一次性修改一个属性的多个设置:
import matplotlib as mpl
mpl.rc('lines', linewidth=2, color='r')
这里matplotlib.rcdefaults()命令可以恢复为matplotlib标准默认配置。
还有可以验证设置rcParams的值,详情查看matplotlib.rcsetup。
四 、一个matplotlibrc文件示例
### MATPLOTLIBRC 格式

# 这是一个matplotlib简单配置文件-你可以从你的系统下的site-packages/matplotlib/mpl-data/matplotlibrc找到。
# 如果你要修改你,请注意它会在你下次安装时覆盖。如果你想要长久保持不被覆盖,
# 请把它放在HOME/.matplotlib/matplotlibrc(unix/linux)
# C:\Documents and Settings\yourname\.matplotlib (win32 systems).
#
# 这个文件最好在支持python语法高亮模式的文本编辑器下查看。
# 空行或者注释符开头的行或者尾部追加的注释都会被忽略。其它行都遵循下面格式:
# 关键字 : 值 # 可选注释
#
# 颜色:下面是颜色值,你可以使用一个matplotlib颜色字符串如:r, k或者b等,
# 也可以使用rgb元组,如:(1.0, 0.5, 0.0),
# 也可以使用16进制字符串,如ff00ff或者#ff00ff。
# 也可以使用灰度值,如:0.75
# 还可以使用合法的html颜色值:如: red, blue, darkslategray

#### 开始配置

# 默认后端: 从GTK, GTKAgg, GTKCairo, CocoaAgg, FltkAgg, MacOSX, QtAgg,
# Qt4Agg, TkAgg, WX, WXAgg, Agg, Cairo, GDK, PS, PDF, SVG, Template中选择一个。
# 当然你也可以自己在matplotlib外,通过'module://my_backend'引用模块名(必须在python安装目录下),
# 来发布一个后端。
backend : Agg

# 如果你使用Qt4Agg后端,你可以选择在这里使用PyQt4或者新的PySide绑定到Qt4工具集。
#backend.qt4 : PyQt4 # PyQt4 | PySide

# 注意这个会重载被加强工具集(ETS)使用的QT_API环境变量;有效值为"pyqt"和"pyside".
# "pyqt"设置会强制QString和QVariant使用版本2API的副作用

# 如果你在GUI里使用pyplot和你选的后端冲突,
# 当你把backend_fallback设置为True我们会自动为你选择一个兼容后端。
#backend_fallback: True

#interactive : False
#toolbar : toolbar2 # None | classic | toolbar2
#timezone : UTC # a pytz timezone string, eg US/Central or Europe/Paris

# 如果你的matplotlib数据存放在非默认安装的地方,像matplotlib字体,位图等等
#datapath : /home/jdhunter/mpldata

### 线条
# 更多线条属性详情请查看
# http://matplotlib.sourceforge.net/api/artist_api.html#module-matplotlib.lines
#lines.linewidth : 1.0 # 线宽
#lines.linwstyle : - # 实线
#lines.color : blue
#lines.marker : None # 默认标记
#lines.markeredgewidth : 0.5 # 在标记附近的线宽
#lines.markersize : 6 # 标记大小
#lines.dash_joinstyle : miter # miter|round|bevel
#lines.dash_capstyle : butt # butt|round|projecting
#lines.solid_joinstyle : miter # miter|round|bevel
#lines.solid_capstyle : projecting # butt|round|projecting
#lines.antialiased : True # 使用抗锯齿渲染(没有缺口)

### 斑纹[PATCHES]
# 斑纹是图形对象,用来填充2D空间,如多边形或者圆
# 更多详情请查看 http://matplotlib.sourceforge.net/api/artist_api.html#module-matplotlib.patches
#patch.linewidth : 1.0 # edge width in points
#patch.facecolor : blue
#patch.edgecolor : black
#patch.antialiased : True # 使用抗锯齿渲染(没有缺口)

### 字体
#
# 字体属性被text.Text所使用。更多详情请查看http://matplotlib.sourceforge.net/api/font_manager_api.html
# 下面给出6种带默认值的字体属性
# font.family属性有五个值: "serif"(如:Times),
# "sans-serif"(如:Helvetical), "cursive"(如:Zapf-Chancery)
# "fantasy"(如:Western)和"monospace"(如: Courier).
# 每个字体家族都有默认一些列以优先级下降的顺序排列的字体
#
# font.style属性有三个值: normal(或者roman), italic,或者oblique.
# oblique风格如果没有出现,它会在italic中使用。
#
# font.variant属性有2个值: normal或者small-caps.对于TrueType类型的字体,
# 可缩放字形,大写字母的小写形式(如:ABCDE)和使用‘smaller’字体大小或者当前字体大小的83%左右是等价的
#
# font.weight属性有13个有效值:normal, bold, bolder, lighter, 100, 200, 300, ..., 900.
# Normal和400,bold和700是一样的,而bolder和lighter是针对当前高度的相对大小
#
# font.stretch属性有11个值: ultra-condensed,
# extra-condensed, condensed, semi-condensed, normal, semi-expanded,
# expanded, extra-expanded, ultra-expanded, wider, and narrower.
# 这个属性迄今还没有实现。
#
# font.size属性是为文本设置默认字体大小,以磅为单位,12pt是标准值。
#
#font.family : sans-serif
#font.style : normal
#font.variant : normal
#font.weight : medium
#font.stretch : normal
# 注意font.size控制着默认字体大小。如果想要配置指定文本的大小如tick标签,坐标轴,标签,标题等等。
# 请看坐标轴和ticks的rc配置。指定文本大小可以使用下面的值:xx-small, x-small,small, medium,
# large, x-large, xx-large, larger,或者smaller来相对font.size大小定义
#font.size : 12.0
#font.serif : Bitstream Vera Serif, New Century Schoolbook, Century Schoolbook L, Utopia, ITC Bookman, Bookman, Nimbus Roman No9 L, Times New Roman, Times, Palatino, Charter, serif
#font.sans-serif : Bitstream Vera Sans, Lucida Grande, Verdana, Geneva, Lucid, Arial, Helvetica, Avant Garde, sans-serif
#font.cursive : Apple Chancery, Textile, Zapf Chancery, Sand, cursive
#font.fantasy : Comic Sans MS, Chicago, Charcoal, Impact, Western, fantasy
#font.monospace : Bitstream Vera Sans Mono, Andale Mono, Nimbus Mono L, Courier New, Courier, Fixed, Terminal, monospace

### 文本
#
# 文本属性被text.Text使用。更多详情请查看
# http://matplotlib.sourceforge.net/api/artist_api.html#module-matplotlib.text
#text.color : black

### LaTex自定义
# 查看http://www.scipy.org/Wiki/Cookbook/Matplotlib/UsingTex
#text.usetex : False # 所有文本都用latex来处理。可以通过rc参数设置来设置下面支持的字体:
# new century schoolbook, bookman, times, palatino,
# zapf chancery, charter, serif, sans-serif, helvetica,
# avant garde, courier, monospace,

# computer modern roman,
# computer modern sans serif, computer modern typewriter
# 如果LaTeX的\userpackage命令需要其它的字
# 体,请在matplotlib邮件列表里查询
#text.latex.unicode : False # 使用"ucs"和"inputenc" LaTeX包来处理unicode字符串

#text.latex.preamble : # 不正确的使用这个特性会导致LaTeX错误和不支持。

# 如果这个特性不能按你期望的工作,请不要求救
# preamble是逗号分隔的列表的LaTeX语句,它包含在LaTeX的preamble文档
# 如:
# text.latex.preamble : \usepackage{bm},\usepackage{euler}

# 这个包总是会随这usetex而载入。所以请小心包冲突:color, geometry,
# graphicx, type1cm, textcomp. 根据你的字体设置Adobe的Postscript
# font可能会载入。
#text.dvipnghack : None # dvipng的一些版本不能正确的处理alpha通道。
# 请在测试之前设置为True来检测和刷新
#  ~/.matplotlib/tex.cache。设置为False来关闭检测。
# 设置为None会根据你dvipng版本检测和猜测
#text.hinting : True # 如果为True,文本就会是提示文本,否则,就不是提示文本。它只对Agg后端其作用

#text.antialiased : True # 如果为True(默认值),文本就会抗锯齿。它只对Agg后端其作用

# 下面的设置允许你选择数学模式的字体
# 它们从TeX字体映射到字体配置模式。这些设置只有在mathtext.fontset设置为'custom'时才会被使用。
# 注意的是这个'custom'模式现在并不被支持,可能在不久会被遗弃。
#mathtext.cal : cursive
#mathtext.rm : serif
#mathtext.tt : monospace
#mathtext.it : serif:italic
#mathtext.bf : serif:bold
#mathtext.sf : sans
#mathtext.fontset : cm # 应该为 'cm' (Computer Modern), 'stix',
# 'stixsans' or 'custom'
#mathtext.fallback_to_cm : True # When True, use symbols from the Computer Modern
# fonts when a symbol can not be found in one of
# the custom math fonts.

#mathtext.default : it # 数学默认字体。可以是任何LaTeX字体名包括一些专门的合法字体

### 坐标轴
# 默认面和边颜色以及tick大小
# tick标签的默认字体大小等等。
# 请查看:
# http://matplotlib.sourceforge.net/api/axes_api.html#module-matplotlib.axes
#axes.hold : True # 是否清除坐标轴,默认是开启的
#axes.facecolor : white # 坐标轴的背景颜色
#axes.edgecolor : black # 坐标轴边的颜色
#axes.linewidth : 1.0 # 边的宽
#axes.grid : False # 是否显示网格
#axes.titlesize : large # 坐标轴标题字体的大小
#axes.labelsize : medium # x轴和y轴的字体大小
#axes.labelweight : normal # x轴和y轴的字体高度
#axes.labelcolor : black
#axes.axisbelow : False # 坐标轴网格线以及ticks是否在坐标轴的线条或者文本等元素下面显示
#axes.formatter.limits : -7, 7 # use scientific notation if log10
# of the axis range is smaller than the
# first or larger than the second
#axes.formatter.use_locale : False # 当为真时,会根据用户的本地环境格式化tick标签。

# 例如:当使用','分隔时,在法国会当作小数分割号
#axes.unicode_minus : True # 减号使用unicode编码而不是连字符号,请查看
# http://en.wikipedia.org/wiki/Plus_and_minus_signs#Character_codes
#axes.color_cycle : b, g, r, c, m, y, k # 绘制线条的颜色循环,颜色列表:单个字母或者全名,或者web风格的十六进制。

#polaraxes.grid : True # 极坐标轴显示网格
#axes3d.grid : True # 3d坐标轴显示网格

### 刻度/记号[TICKS]
# 查看 http://matplotlib.sourceforge.net/api/axis_api.html#matplotlib.axis.Tick
#xtick.major.size : 4 # 最大刻度大小
#xtick.minor.size : 2 # 最小刻度大小
#xtick.major.width : 0.5 # 最大刻度宽度
#xtick.minor.width : 0.5 # 最小刻度宽度
#xtick.major.pad : 4 # 最大刻度标签距离
#xtick.minor.pad : 4 # 最小刻度标签距离
#xtick.color : k # 刻度标签颜色
#xtick.labelsize : medium # 刻度标签字体大小
#xtick.direction : in # 指向: in or out

#ytick.major.size : 4 # 最大刻度大小
#ytick.minor.size : 2 # 最小刻度大小
#ytick.major.width : 0.5 # 最大刻度宽度
#ytick.minor.width : 0.5 # 最小刻度宽度
#ytick.major.pad : 4 # 最大刻度标签距离
#ytick.minor.pad : 4 # 最小刻度标签距离
#ytick.color : k # 刻度标签颜色
#ytick.labelsize : medium # 刻度标签字体大小
#ytick.direction : in # 指向: in or out

### 网格[GRIDS]
#grid.color : black # 网格颜色
#grid.linestyle : : # 点
#grid.linewidth : 0.5 # pt

### 图例[Legend]
#legend.fancybox : False # 为True时使用圆角方框,否则使用直角方框
#legend.isaxes : True
#legend.numpoints : 2 # the number of points in the legend line
#legend.fontsize : large
#legend.pad : 0.0 # 已弃用了
#legend.borderpad : 0.5 # 字体大小单元的边缘的空白
#legend.markerscale : 1.0 # the relative size of legend markers vs. original

# the following dimensions are in axes coords
#legend.labelsep : 0.010 # 已弃用了
#legend.labelspacing : 0.5 # 图例之间的竖直距离,使用字体大小的几分之几表示
#legend.handlelen : 0.05 # 已弃用了
#legend.handlelength : 2. # 图例之间的长度,使用字体大小的几分之几表示
#legend.handleheight : 0.7 # 图例之间的高度,使用字体大小的几分之几表示
#legend.handletextsep : 0.02 # 已弃用了
#legend.handletextpad : 0.8 # 图例的图例线和图例文本之间的距离,使用字体大小的几分之几表示
#legend.axespad : 0.02 # 已弃用了
#legend.borderaxespad : 0.5 # 图例边缘和坐标轴之间的空隙距离,使用字体大小的几分之几表示
#legend.columnspacing : 2. #
#legend.shadow : False
#legend.frameon : True # 是否在图例外显示外框
### 视图窗口[FIGURE]
# 请查看 http://matplotlib.sourceforge.net/api/figure_api.html#matplotlib.figure.Figure
#figure.figsize : 8, 6 # 视图窗口大小,英寸表示
#figure.dpi : 80 # 视图窗口 每英寸点数
#figure.facecolor : 0.75 # 视图窗口颜色; 0.75是使用灰度值
#figure.edgecolor : white # 视图窗口边的颜色

# 视图窗口的子视图参数. 所有的大小都是视图窗口大小的几分之几
#figure.subplot.left : 0.125 # 左部子视图
#figure.subplot.right : 0.9 # 右部子视图
#figure.subplot.bottom : 0.1 # 下部子视图
#figure.subplot.top : 0.9 # 上部子视图
#figure.subplot.wspace : 0.2 # 子视图之间的横向空白间距
#figure.subplot.hspace : 0.2 # 子视图之间的纵向空白间距

### 图像[IMAGES]
#image.aspect : equal # equal | auto | a number
#image.interpolation : bilinear # 使用help(imshow)获得更多
#image.cmap : jet # gray | jet etc...
#image.lut : 256 # 色彩对照表查找大小
#image.origin : upper # lower | upper
#image.resample : False

### 轮廓图[CONTOUR PLOTS]
#contour.negative_linestyle : dashed # dashed | solid

### Agg 渲染
### 警告: 还在实验中, 2008/10/10
#agg.path.chunksize : 0 # 0为禁用;取值在10000到100000可以约微提高速度和减少Agg渲染失败当绘制很大数据时。

# 尽管它可能会产生假象。20000是一个很好初始点。
### 保存视图窗口
#path.simplify : True # 当为True时,通过删除不可见的点来减少文件的大小和提供渲染速度来简单化
#path.simplify_threshold : 0.1 # 在简单化过程中,在相似度的阙值下面的至高点将会删除
#path.snap : True # When True, rectilinear axis-aligned paths will be snapped to
# the nearest pixel when certain criteria are met. When False,
# paths will never be snapped.

# 默认的保存视图窗口的参数会因为显示参数的不同而不同。如:你想高分辨率,会使视图窗口的背景为白色。
#savefig.dpi : 100 # 视图窗口 每英寸点数
#savefig.facecolor : white # 视图窗口保存时颜色
#savefig.edgecolor : white # 视图窗口边在保存时的颜色
#savefig.extension : auto # 使用什么文件后缀

#cairo.format : png # png, ps, pdf, svg

# tk 后端参数
#tk.window_focus : False # Maintain shell focus for TkAgg

# ps 后端参数
#ps.papersize : letter # auto, letter, legal, ledger, A0-A10, B0-B10
#ps.useafm : False # use of afm fonts, results in small files
#ps.usedistiller : False # can be: None, ghostscript or xpdf
# Experimental: may produce smaller files.
# xpdf intended for production of publication quality files,
# but requires ghostscript, xpdf and ps2eps
#ps.distiller.res : 6000 # dpi
#ps.fonttype : 3 # Output Type 3 (Type3) or Type 42 (TrueType)

# pdf 后端参数
#pdf.compression : 6 # integer from 0 to 9
# 0 disables compression (good for debugging)
#pdf.fonttype : 3 # Output Type 3 (Type3) or Type 42 (TrueType)

# svg 后端参数
#svg.image_inline : True # 直接将光栅图数据写入到svg文件中
#svg.image_noscale : False # 在svg中不缩放光栅数据比例
#svg.fonttype : 'path' # 怎么处理svg的字体
# 'none': 假设字体已经安装了,svg可以正常查看
# 'path': 在路径中植入字符--支持大多数的SVG渲染器
# 'svgfont': 植入字符作为SVG的字体--被Chrome,Opera和Safari支持

# docstring 参数
#docstring.hardcopy = False # 如果你想生成硬拷贝的文档就设置它

# 设置冗长信息标志。 它会控制在matplotlib在运行时可以给你多少信息。
# 冗长信息的等级可以是: silent, helpful, debug, debug-annoying.任何等级都会包含它前面的等级。
# 如你设置的等级为debug,那么你会获得所有debug和helpful等级的信息。
# 如果使用邮件列表提交问题时,请设置为helpful或者debug,并且将输出附加到你的报告中。
#
# fileo告诉冗余信息报告输出的目的地。可以是一个文件名,或者一个文件句柄像sys.stdout.
# 你可以重载rc默认冗余信息,在命令行中使用标志--vervbose-LEVEL,LEVEL是合法的等级如:--verbose-helpful
#
# 你可以在你的代码中访问冗余信息的实例。
# from matplotlib import verbose.
#verbose.level : silent # one of silent, helpful, debug, debug-annoying
#verbose.fileo : sys.stdout # a log filename, sys.stdout or sys.stderr

# 通过键盘和视图窗口交互的事件键
# 根据你的要求,自定义这些设置
# 如果你不需要键对照表,请空着(如: fullscreen : '')

#keymap.fullscreen : f # 全屏
#keymap.home : h, r, home # 主页或者重置助记符
#keymap.back : left, c, backspace # 启用前进或者后退键
#keymap.forward : right, v # 左手快速导航
#keymap.pan : p # 移动助记符
#keymap.zoom : o # 缩放助记符
#keymap.save : s # 保存当前视图窗口
#keymap.grid : g # 当前坐标轴的网格开关
#keymap.yscale : l # y轴缩放(对数/线性)
#keymap.xscale : L, k # x轴缩放(对数/线性)
#keymap.all_axes : a # 启动所有的坐标轴

# 控制下载示例数据。很多的示例可以从matplotlib的git仓库里下载,剔除很多发行时的额外文件。
# 在这种情况下,可以将examples.download设置为False以及
# 将examples.directory设置为你想下载的地方: https://github.com/matplotlib/sample_data

#examples.download : True # False会忽略下载机制
#examples.directory : '' # 如果download设置为False时的查找目录
五、绘图的style
使用matplotlib画图的时候,除了我们可以针对每一个样式自己定义以外,我们还可以使用系统定义好的样式快速配置。
style是pyplot的一个子模块,方便进行风格转换,它里面定义了很多预设风格。本质上来说,每一个预设的风格style都是一个style文件,它是以 .mplstyle 为后缀的文件。我们依然可以查看,比如我的电脑在一下文件夹下,有很多的 .mplstyle文件:
D:\ProgramData\Anaconda3\Lib\site-packages\matplotlib\mpl-data\stylelib,里面的部分文件如下所示:

每一个文件名对应于一种预设风格。
我们可以打开一个文件,里面预设的风格属性也是通过“ 键-值 ”对的形式表示的。
1、预设风格的查看
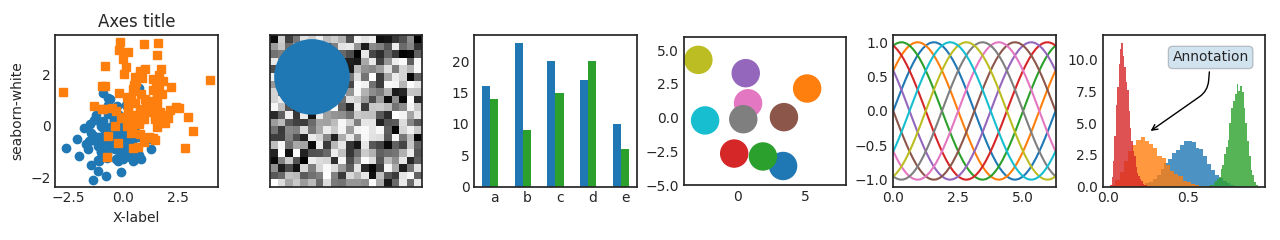
官网链接与代码:Style sheets reference — Matplotlib 3.4.3 documentation
     方式一:直接查看相应的文件夹即可

     方式二:print(plt.style.available)   #会打印出所有的预设风格的名称 共26种

        ['bmh', 'classic', 'dark_background', 'fast', 'fivethirtyeight', 'ggplot', 'grayscale', 'seaborn-bright', 'seaborn-colorblind', 'seaborn-dark-palette', 'seaborn-dark', 'seaborn-darkgrid', 'seaborn-deep', 'seaborn-muted', 'seaborn-notebook', 'seaborn-paper', 'seaborn-pastel', 'seaborn-poster', 'seaborn-talk', 'seaborn-ticks', 'seaborn-white', 'seaborn-whitegrid', 'seaborn', 'Solarize_Light2', 'tableau-colorblind10', '_classic_test']
2、预设风格的使用——就添加一句话即可
                   x=np.linspace(0,2*np.pi)

                   y=np.sin(x)

                   plt.style.use('ggplot')                         ##使用 ggplot  的绘图风格

                   plt.plot(x,y,label='sin',linewidth=5)

                   plt.legend()

                   plt.show()
3、自定义画图风格style
  比如我在上面所述的文件夹下自定义一个 myownstyle.mplstyle 文件,里面的内容如下所示:

      lines.color: green
      lines.linewidth:8
      patch.edgecolor: red

      text.color: white

      axes.facecolor: yellow
      axes.edgecolor:black
4、调用方式
import matplotlib
import matplotlib.pyplot as plt
import numpy as np


x=np.linspace(0,2*np.pi)
y=np.sin(x)

f=plt.figure()
plt.style.use('myownstyle')    ##使用自定义的样式文件
plt.plot(x,y,label='sin',linewidth=5)
plt.legend()

plt.show()
六、科学论文绘图样式 SciencePlots
绘图样式

,就能画出比较好看的数据可视化图表,也避免了你每次画图时都要从头开始手动配置图表的格式。 目前该工具包中包含有Science,IEEE等期刊的图表格式,还包括一些对图表中的网格和字体颜色等的配置文件。 但目前好像只支持折线图和散点图的作图,暂时不支持柱状图或者箱型图等其他类型的图表。
一款由哈佛博士生写的论文绘图神器。该项目地址是项目地址。 简单来说,它是一个基于Matplotlib的补充包,里面主要包含了一些以.mplstyle为后缀的图表样式的配置文件。这样,你画图的时候只需要通过调用这些配置文件,就能画出比较好看的数据可视化图表,也避免了你每次画图时都要从头开始手动配置图表的格式。 目前该工具包中包含有Science,IEEE等期刊的图表格式,还包括一些对图表中的网格和字体颜色等的配置文件。 但目前好像只支持折线图和散点图的作图,暂时不支持柱状图或者箱型图等其他类型的图表。
使用方法中文介绍:https://blog.csdn.net/weixin_43864155/article/details/107129967
开源代码:SciencePlots: Matplotlib styles for scientific plotting (gitee.com)


 1万+
1万+


 被折叠的 条评论
为什么被折叠?
被折叠的 条评论
为什么被折叠?
 到【灌水乐园】发言


