


CPU 常用相关
cpu 概念
cpu 性能问题大致分为两个方向,第一使用率问题。第二调度问题。
使用率表示资源负载情况,而调度问题往往表现文上下文切换,cache命中等问题。
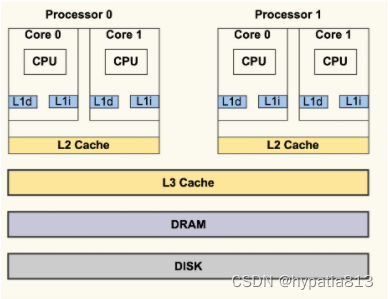
一个实体 CPU 通常会有两个逻辑线程,也就是上图中的 Core 0 和 Core 1。每个 Core 都有自己的 L1 Cache,L1 Cache 又分为 dCache 和 iCache,对应到上图就是 L1d 和 L1i。L1 Cache 只有 Core 本身可以看到,其他的 Core 是看不到的。同一个实体 CPU 中的这两个 Core 会共享 L2 Cache,其他的实体 CPU 是看不到这个 L2 Cache 的。所有的实体 CPU 会共享 L3 Cache。
介质的延迟:https://gist.github.com/jboner/2841832
cpu参数
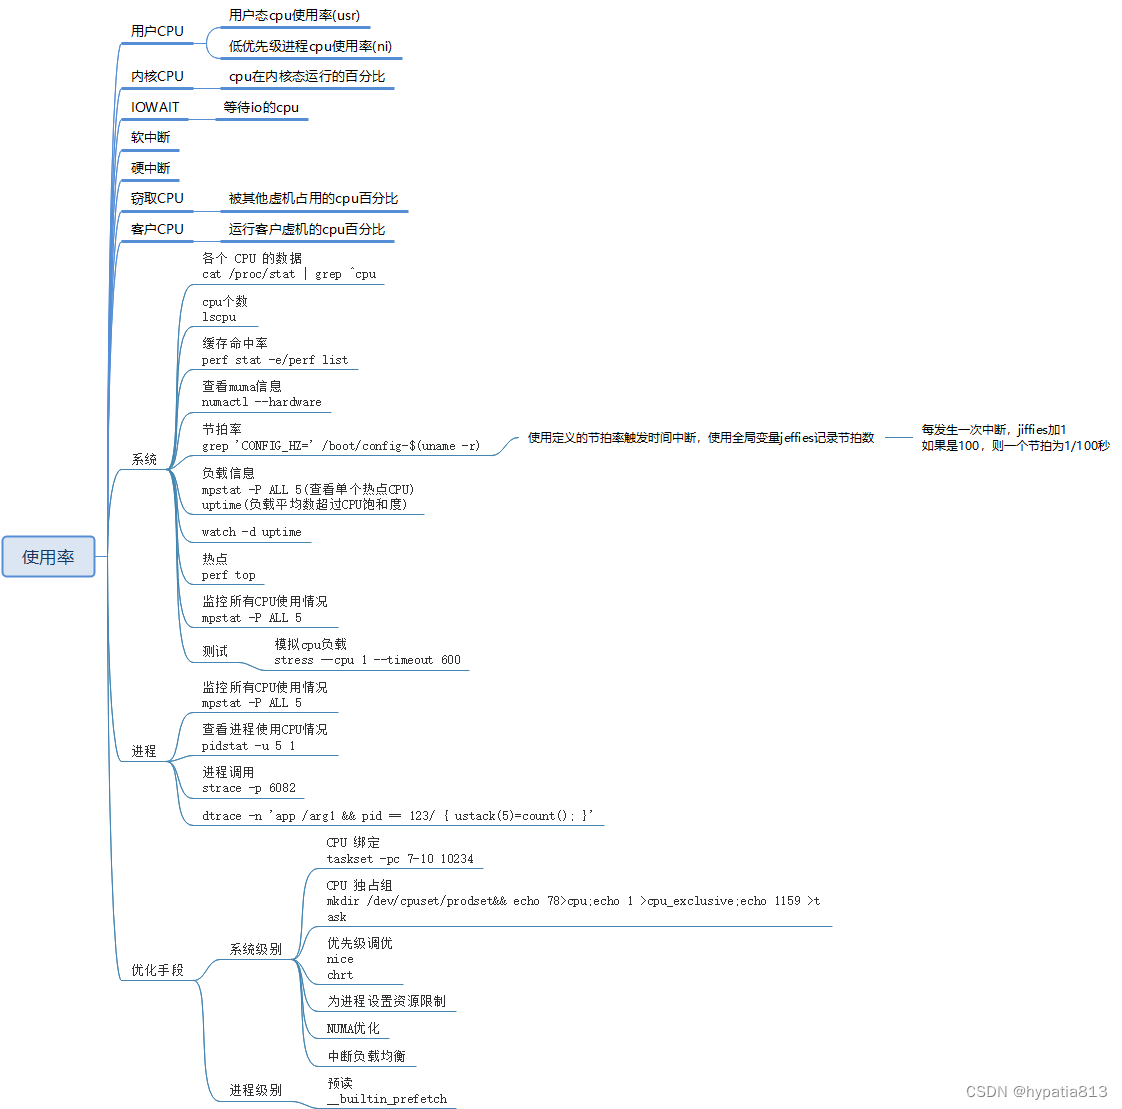
节拍率
[root@centos7 ~]# grep 'CONFIG_HZ=' /boot/config-$(uname -r)
CONFIG_HZ=1000
每秒可发生中断数量。一般不关心
muma信息
root@centos7 ~]# numactl --hardware
available: 1 nodes (0)
node 0 cpus: 0 1
node 0 size: 3789 MB
node 0 free: 740 MB
node distances:
node 0
0: 10
cpu 个数
#lscpu
Architecture: x86_64
CPU op-mode(s): 32-bit, 64-bit
Byte Order: Little Endian
CPU(s): 2
On-line CPU(s) list: 0,1
Thread(s) per core: 1
Core(s) per socket: 1
Socket(s): 2
NUMA node(s): 1
Vendor ID: GenuineIntel
CPU family: 6
Model: 85
Model name: Intel Xeon Processor (Skylake, IBRS)
Stepping: 4
CPU MHz: 3600.012
BogoMIPS: 7200.02
Hypervisor vendor: KVM
Virtualization type: full
L1d cache: 32K
L1i cache: 32K
L2 cache: 4096K
L3 cache: 16384K
NUMA node0 CPU(s): 0,1
cpu数据
# cat /proc/stat | grep ^cpu
cpu 153471 752 141649 325317862 614311 0 6988 3936 0 0
cpu0 56581 392 73373 162665653 319076 0 761 2162 0 0
cpu1 96890 359 68276 162652209 295234 0 6227 1773 0 0
缓存命中率
perf
perf stat -e; perf list
cpu 负载
cpu调度
参考文献:


 5721
5721


 被折叠的 条评论
为什么被折叠?
被折叠的 条评论
为什么被折叠?
 到【灌水乐园】发言


