


简介:memory_profiler是第三方模块,用于监视进程的内存消耗以及python程序内存消耗的逐行分析。它是一个纯python模块,依赖于psutil模块。
安装:
pip install memory_profiler
使用方法:
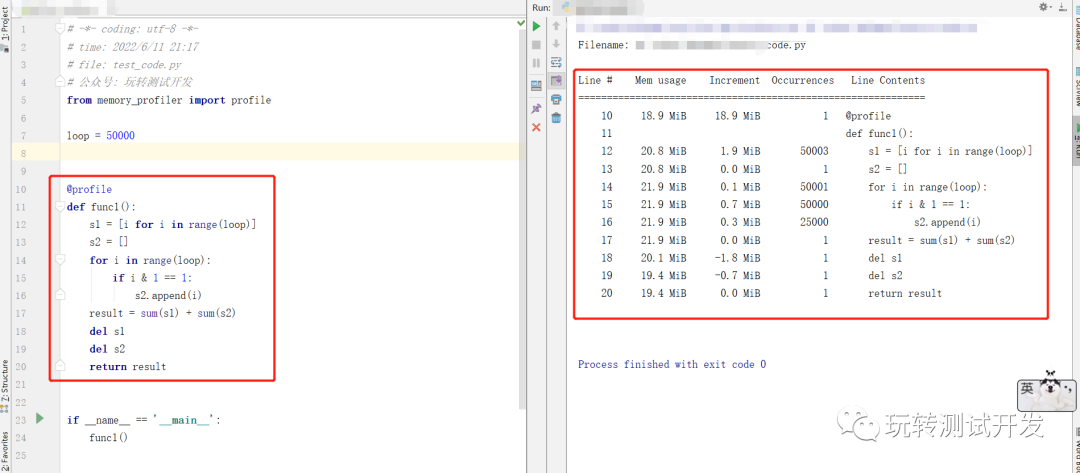
1、通过装饰器运行
@profile
def func1():
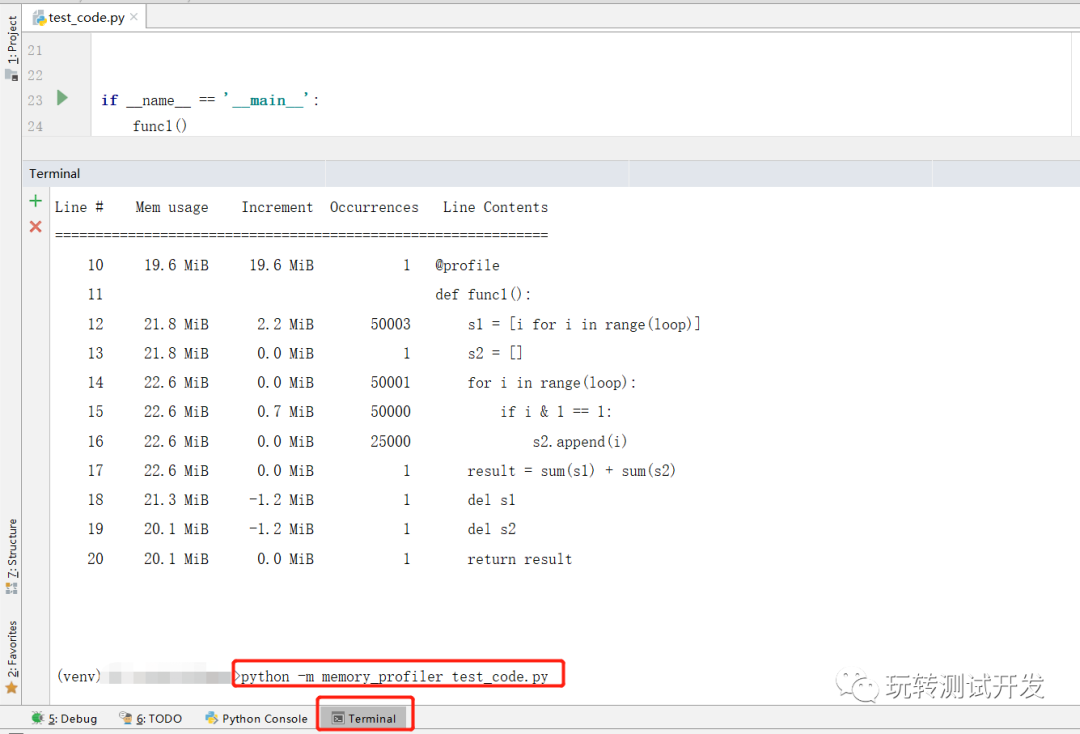
2、通过命令行运行
python -m memory_profiler test_code.py
案例源码:
# -*- coding: utf-8 -*-
# time: 2022/6/11 21:17
# file: test_code.py
# 公众号: 玩转测试开发
from memory_profiler import profile

loop = 50000


@profile
def func1():
    s1 = [i for i in range(loop)]
    s2 = []
    for i in range(loop):
        if i & 1 == 1:
            s2.append(i)
    result = sum(s1) + sum(s2)
    del s1
    del s2
    return result


if __name__ == '__main__':
    result = func1()
    print(result)
方法1运行结果:
方法2运行结果:
微信公众号:玩转测试开发
欢迎关注,共同进步,谢谢!


 3132
3132


 被折叠的 条评论
为什么被折叠?
被折叠的 条评论
为什么被折叠?
 到【灌水乐园】发言


