


memory_profile
安装
pip install memory_profiler使用
请参考以下文章,写的很详细 【精选】Python代码优化工具——memory_profiler_被Python玩的Kenny的博客-CSDN博客
本文要增加介绍的是API使用
目录结构
|--my.py
|--tests
|  |-- test_my_func.py
相关代码
my.py
def func(x: int, y: int):
    a = [1] * (10**x)
    b = [2] * (2 * 10**y)
    del b
    return a
test_my_func.py
from memory_profiler import LineProfiler, show_results

from my import func

def test_my_func():
    lp = LineProfiler()
    lp_wrapper = lp(func)
    lp_wrapper(6, **{"y": 7})
    show_results(lp)
执行结果
pytest ./tests/test_my_func.py -s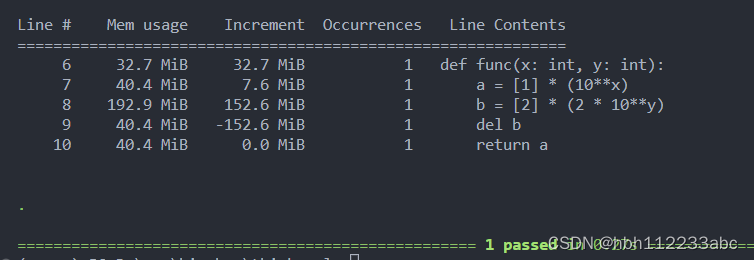
好处
- 以上操作不需要针方法增加装饰器,代码不必反复修改
- 可以结合单元测试,单独运行测试脚本


 1462
1462


 被折叠的 条评论
为什么被折叠?
被折叠的 条评论
为什么被折叠?
 到【灌水乐园】发言


