


文章目录
一、平移变换
1.1 推导
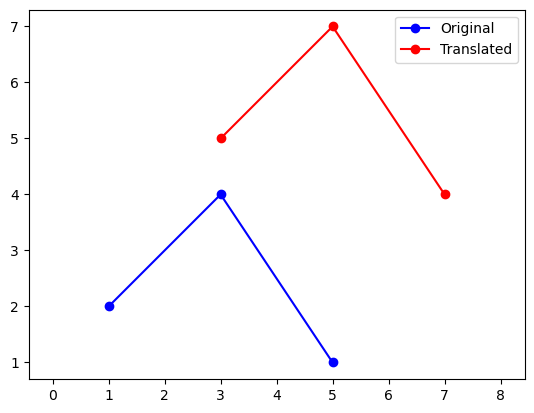
平移变换是将图形在二维平面上按照某个向量 ( Δ x , Δ y ) (\Delta x, \Delta y) (Δx,Δy)进行移动。对于平面上的任意一点 ( x , y ) (x, y) (x,y),平移后的坐标 ( x ′ , y ′ ) (x', y') (x′,y′)可以通过以下公式计算:
x ′ = x + Δ x y ′ = y + Δ y \begin{aligned} x' = x + \Delta x\\ y' = y + \Delta y \end{aligned} x′=x+Δxy′=y+Δy
1.2 C++ 代码示例
#include <iostream>
#include <vector>

struct Point {
    double x, y;
};

void translate(std::vector<Point>& points, double dx, double dy) {
    for (auto& p : points) {
        p.x += dx;
        p.y += dy;
    }
}

int main() {
    std::vector<Point> polygon = {{1, 2}, {3, 4}, {5, 1}};
    double dx = 2, dy = 3;
    translate(polygon, dx, dy);
    for (const auto& p : polygon) {
        std::cout << "Translated Point: (" << p.x << ", " << p.y << ")" << std::endl;
    }
    return 0;
}
1.3 Python 代码示例
import matplotlib.pyplot as plt

def translate(points, dx, dy):
    return [(x + dx, y + dy) for x, y in points]

points = [(1, 2), (3, 4), (5, 1)]
dx, dy = 2, 3
translated_points = translate(points, dx, dy)

plt.figure()
plt.plot(*zip(*points), 'bo-', label='Original')
plt.plot(*zip(*translated_points), 'ro-', label='Translated')
plt.axis("equal")
plt.legend()
plt.show()
运行结果如下
二、比例变换(缩放变换)
2.1 推导
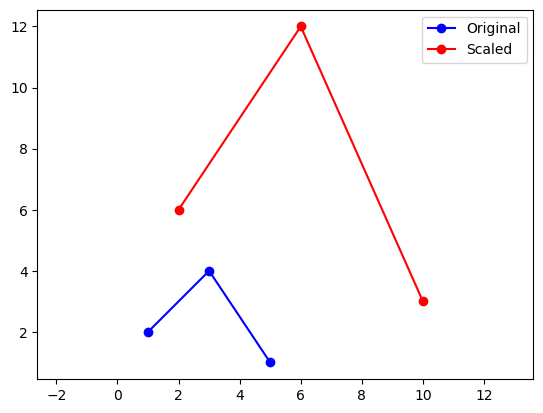
比例变换是改变图形的大小的操作。设 k x k_x kx和 k y k_y ky 分别是沿 x x x轴和 y y y轴的缩放因子,则点 ( x , y ) (x, y) (x,y)缩放后的坐标 ( x ′ , y ′ ) (x', y') (x′,y′)可以通过以下方式计算:
x ′ = k x ⋅ x y ′ = k y ⋅ y \begin{aligned} x' = k_x \cdot x \\ y' = k_y \cdot y \end{aligned} x′=kx⋅xy′=ky⋅y
2.2 C++ 代码示例
#include <iostream>
#include <vector>

struct Point {
    double x, y;
};

void scale(std::vector<Point>& points, double kx, double ky) {
    for (auto& p : points) {
        p.x *= kx;
        p.y *= ky;
    }
}

int main() {
    std::vector<Point> polygon = {{1, 2}, {3, 4}, {5, 1}};
    double kx = 2, ky = 3;
    scale(polygon, kx, ky);
    for (const auto& p : polygon) {
        std::cout << "Scaled Point: (" << p.x << ", " << p.y << ")" << std::endl;
    }
    return 0;
}
2.2 Python 代码示例
import matplotlib.pyplot as plt

def scale(points, kx, ky):
    return [(x * kx, y * ky) for x, y in points]

points = [(1, 2), (3, 4), (5, 1)]
kx, ky = 2, 3
scaled_points = scale(points, kx, ky)

plt.figure()
plt.plot(*zip(*points), 'bo-', label='Original')
plt.plot(*zip(*scaled_points), 'ro-', label='Scaled')
plt.axis("equal")
plt.legend()
plt.show()
运行结果如下
三、旋转变换
3.1 推导
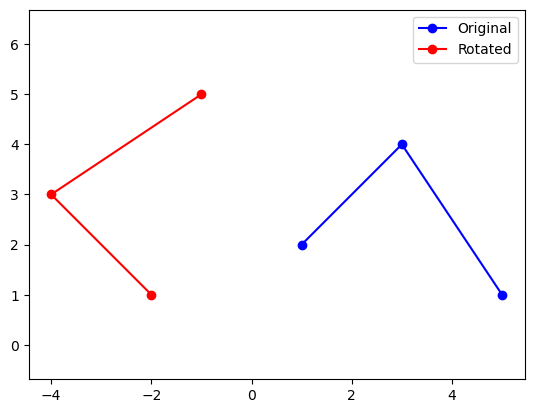
旋转变换是将图形绕原点或某一点旋转一定角度 θ \theta θ(以弧度为单位)。对于平面上的任意一点 ( x , y ) (x, y) (x,y),旋转后的坐标 ( x ′ , y ′ ) (x', y') (x′,y′) 可以通过以下公式计算:
x ′ = x ⋅ cos ( θ ) − y ⋅ sin ( θ ) y ′ = x ⋅ sin ( θ ) + y ⋅ cos ( θ ) \begin{aligned} x' = x \cdot \cos(\theta) - y \cdot \sin(\theta) \\ y' = x \cdot \sin(\theta) + y \cdot \cos(\theta) \end{aligned} x′=x⋅cos(θ)−y⋅sin(θ)y′=x⋅sin(θ)+y⋅cos(θ)
3.2 C++ 代码示例
#include <iostream>
#include <vector>
#include <cmath> // For cos(), sin()

struct Point {
    double x, y;
};

void rotate(std::vector<Point>& points, double theta) {
    theta = theta * M_PI / 180.0; // Convert degrees to radians
    for (auto& p : points) {
        double x_temp = p.x;
        p.x = p.x * cos(theta) - p.y * sin(theta);
        p.y = x_temp * sin(theta) + p.y * cos(theta);
    }
}

int main() {
    std::vector<Point> polygon = {{1, 2}, {3, 4}, {5, 1}};
    double theta = 90; // Rotate 90 degrees
    rotate(polygon, theta);
    for (const auto& p : polygon) {
        std::cout << "Rotated Point: (" << p.x << ", " << p.y << ")" << std::endl;
    }
    return 0;
}
3.3 Python 代码示例
import matplotlib.pyplot as plt
import math

def rotate(points, theta):
    theta = math.radians(theta)  # Convert degrees to radians
    return [(x * math.cos(theta) - y * math.sin(theta),
             x * math.sin(theta) + y * math.cos(theta))
            for x, y in points]

points = [(1, 2), (3, 4), (5, 1)]
theta = 90  # Rotate 90 degrees
rotated_points = rotate(points, theta)

plt.figure()
plt.plot(*zip(*points), 'bo-', label='Original')
plt.plot(*zip(*rotated_points), 'ro-', label='Rotated')
plt.axis("equal")
plt.legend()
plt.show()
运行结果如下


 4000
4000

 被折叠的 条评论
为什么被折叠?
被折叠的 条评论
为什么被折叠?
 到【灌水乐园】发言


