


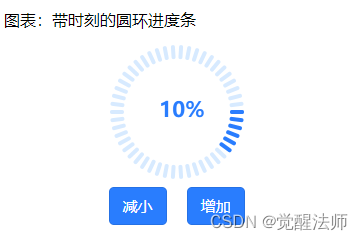
还是在之前几篇基础上,讲下圆环衍生出一种新的圆环进度条,以针表的刻度来绘制出一个进度条。图形如下:

一、创建相应文件
1.1 charts.js文件创建
/**
 * 图表 - 带刻度的圆环进度条
 */
export class CircleBox {

	//构造函数
	constructor(_context){

	}

	//绘制图表
	drawCircle(){

	}

}
1.2 vue页面创建
<template>
	<view class="wrap-box">
		<view class="echart-box chart01">
			<view class="title">图表:带时刻的圆环进度条</view>
			<view class="content">
				<canvas canvas-id="chartBox3" id="chartBox3" class="chart"></canvas>

				<view class="btn-box">
					<button type="default" class="btn" @click="mulEvent()">减小</button>
					<button type="default" class="btn" @click="addEvent">增加</button>
				</view>
			</view>
		</view>
	</view>
</template>

<script>
	import { CircleBox } from './charts.js';

	export default {
		data() {
			return {
				cbox1: null,       //画布实例对象
				percent: 0,        //当前进度值
				step: .01           //每次修改递增或递减值
			}
		},
		mounted() {
			this.initCircle1();
		},
		methods: {
			mulEvent(){
				//递减
				this.percent = this.percent - this.step <= 0 ? 0 : this.percent - this.step;
				//修改进度值
				this.cbox1.percent = this.percent;
				//开始绘制
				this.cbox1.drawCircle();
			},
			addEvent(){
				//递增
				this.percent = this.percent + this.step >= 1 ? 1 : this.percent + this.step;
				//修改进度值
				this.cbox1.percent = this.percent;
				//开始绘制
				this.cbox1.drawCircle();
			},
			initCircle1(){
				//实例对象
				this.cbox1 = new CircleBox(uni.createCanvasContext('chartBox3'));
				//开始绘制
				this.cbox1.drawCircle();
			}
		}
	}
</script>

<style lang="scss">
@import '../index.scss';
</style>
1.3 scss样式文件
样式文件就不展示了,和第二篇中一样。
二、实现charts.js业务逻辑
2.1 构造函数中定义相应变量
//构造函数
constructor(_context){
	this.ctx = _context;
	//刻度数
	this.number = 50;
	//直径
	this.radius = uni.upx2px(300);
	//内填充
	this.padding = uni.upx2px(20);
	//线宽(即刻度长度)
	this.lineWidth = uni.upx2px(20);
	//刻度高度
	this.scaleHeight = uni.upx2px(8);
	//线颜色
	this.lineColor = "#D7EAFF";
	//占比
	this.percent = 0;
	//百分比颜色
	this.percentColor = "#297DFE";
	//字体大小
	this.fontSize = uni.upx2px(42);
	//字段颜色
	this.fontColor = '#297DFE';
}
2.2 绘制刻度条
在JS中Math.PI表示180度,所以360度一圈则是Math.PI*2。在2.1中定义number为50,则每个刻度所对应的角度为Math.PI*2/number。从第一个刻度开始 ,每增加一个,其角度则为索引乘以角度的平均值。
另外,刻度线条开始位置和结束位置点的计算。线宽则表示刻度线条长度,刻度开始位置为radius(画布总宽度)-padding(四周内填充) * 2,结束位置为radius(画布总宽度)-padding(四周内填充) * 2 - lineWidth(线宽,即刻度长度)。
进度条高亮部分显示长度,则通过百分比值 乘以 刻度数量即可,则为:number*percent。
这样下面相关计算,大家就很好理解了。绘制图片drawCircle()函数定义代码如下:
drawCircle(){
//清空画布
this.ctx.clearRect(0, 0, this.radius, this.radius);
//计算角度值(倾斜平均值)
let _depth = Math.PI*2/this.number;
let _radius = this.radius - this.padding * 2;
//开始底色部分绘制
this.ctx.beginPath();
this.ctx.strokeStyle = this.lineColor;
this.ctx.lineCap = 'round';
//循环绘制刻度
for(var i=0;i<this.number;i++){
this.ctx.save();
this.ctx.lineWidth=this.scaleHeight;
//把基点设置为圆心
this.ctx.translate(this.radius/2,this.radius/2);
//每增加一个角度,其角度则为索引乘以角度平均值。
this.ctx.rotate(_depth*i);
this.ctx.moveTo(_radius/2 ,0);
this.ctx.lineTo(_radius/2-this.lineWidth,0);
this.ctx.stroke();
this.ctx.restore();
}
// 绘制高亮刻度
this.ctx.beginPath();
this.ctx.strokeStyle = this.percentColor;
//四舍五入,获取高亮刻度数
let _highNumber = Math.round(parseFloat(this.number*this.percent).toFixed(2));
for(var i=0;i<_highNumber;i++){
this.ctx.save();
this.ctx.lineWidth= this.scaleHeight;
//把基点设置为圆心
this.ctx.translate(this.radius/2,this.radius/2);
this.ctx.rotate(
_depth*i-(_depth*Math.round(this.number/4))
);
this.ctx.moveTo(_radius/2 ,0);
this.ctx.lineTo(_radius/2-this.lineWidth,0);
this.ctx.stroke();
this.ctx.restore();
}
//绘制文字
this.ctx.font = 'bold '+this.fontSize+'px sans-serif';
this.ctx.setFillStyle(this.fontColor);
this.ctx.setTextAlign('center');
this.ctx.fillText(parseInt((this.percent*100))+'%', this.radius/2+(this.lineWidth/2), this.radius/2+(this.lineWidth/2), this.radius);
//绘制到画布上
this.ctx.draw();
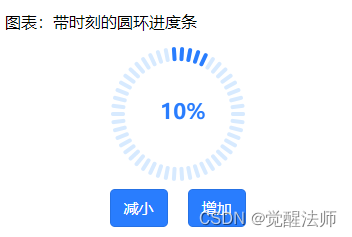
}高亮部分可能有部分大家不太理解,就是角度计算时,会减去用角度值 乘以 刻度数量的四分之一值。
因为角度从0度开始,如果不加,则如下图位置开始绘制:
这时就很好理解为什么要减去 四分之一角度值了,将开始位置往后移四分之一位置。如下图:


 1870
1870


 被折叠的 条评论
为什么被折叠?
被折叠的 条评论
为什么被折叠?
 到【灌水乐园】发言


