


1. valgrind 简介
1.1. 概图
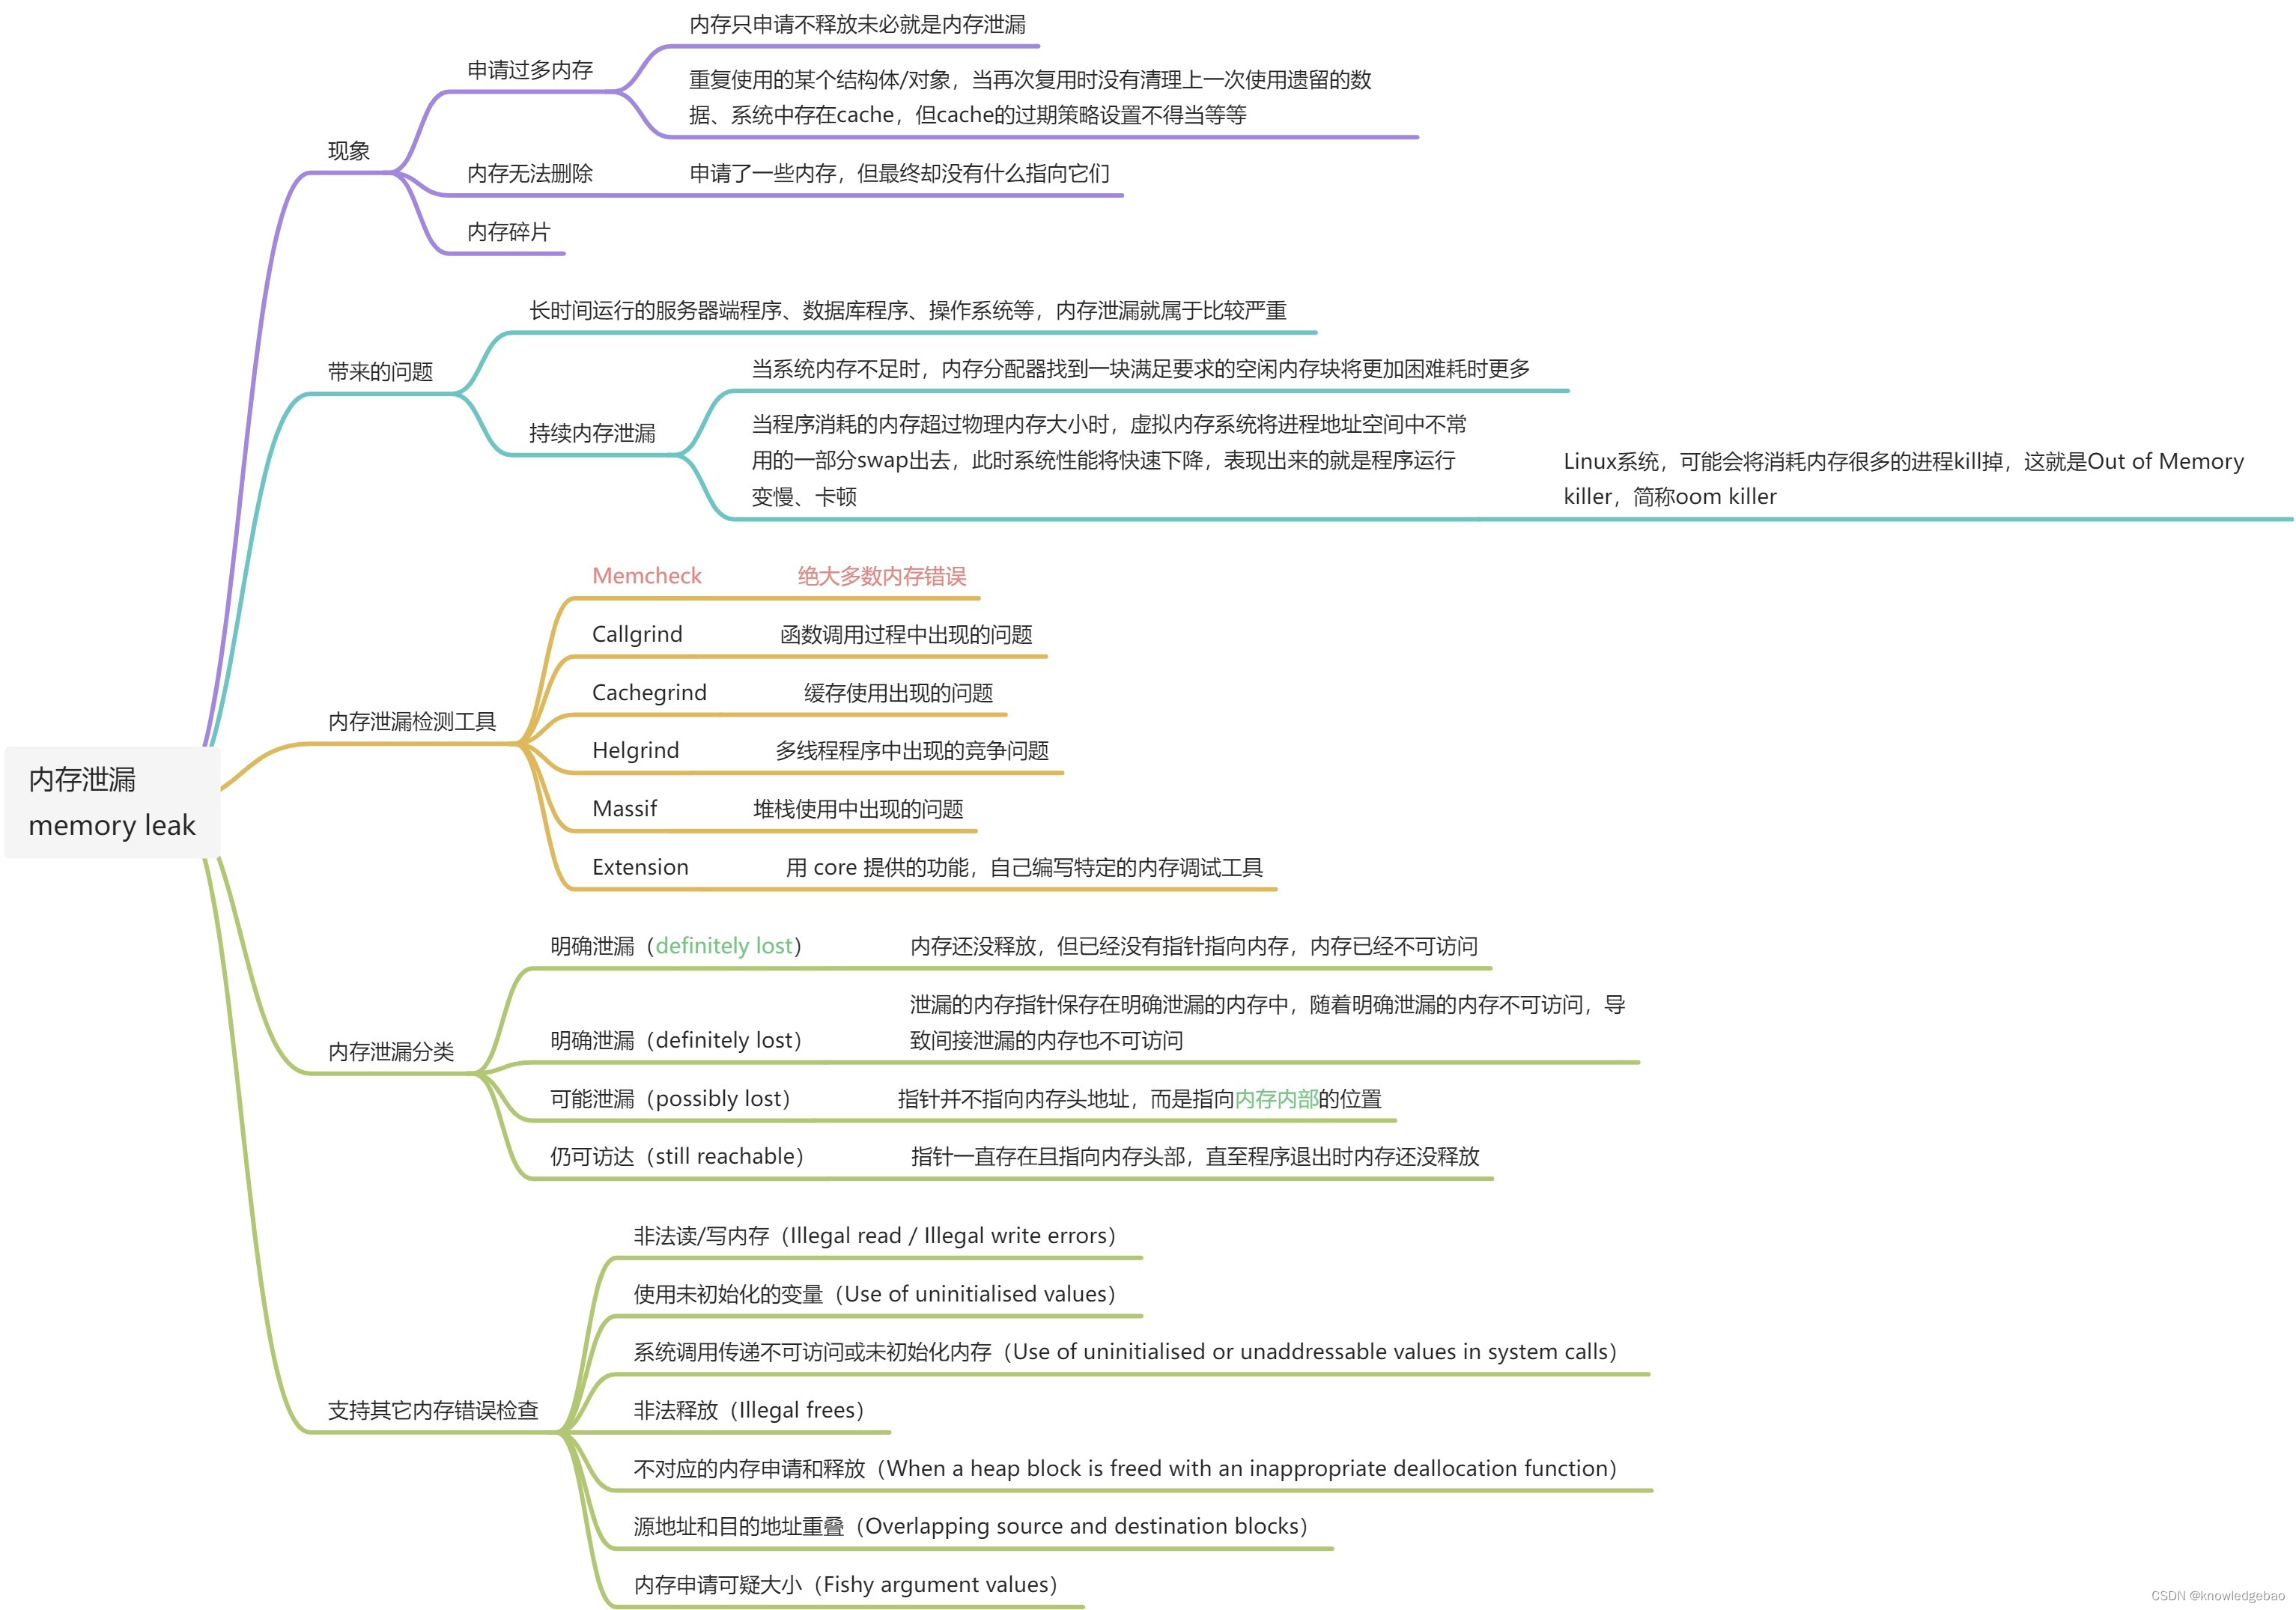
[外链图片转存失败,源站可能有防盗链机制,建议将图片保存下来直接上传(img-kapgUzof-1662377304084)(./memory-leak.jpg)]]
1.2. 特点
- 可以在几个流行的平台上运行,例如 x86/Linux、AMD64/Linux 和 PPC32/Linux。
- 适用于所有主要的 Linux 发行版,包括 Red Hat、SuSE、Debian、Gentoo、Slackware、Mandrake 等。
- 使用动态二进制检测,因此您无需修改、重新编译或重新链接您的应用程序。可以在没有源代码的程序上使用。
- 适用于以任何语言编写的程序,无论是编译的、即时编译的还是解释的。它可以用于调试和分析以混合语言编写的系统。
- 工具使用更多的语言是 C 和 C++ 编写的程序。
- Valgrind 会让程序运行速度明显变慢。
- valgrind 不能用于调试正在运行的程序
1.3. 使用示例
valgrind --malloc-fill=98 --free-fill=97 --leak-check=full --show-leak-kinds=all --track-origins=yes --verbose --log-file=valgrind.log ./helloword.exe argc1 argc2
说明:详见参数说明
1.4. 参数说明
valgrind -h 可以查看帮助
1.4.1. 常用参数
-
--tool=<toolname> [default: memcheck]- valgrind 支持不少检查工具,用的更多的是内存检查(memcheck), --tool= 用于选择你需要执行的工具,如果不指明则默认为 memcheck。
-
检测类型
-
--show-leak-kinds=<set> [default: definite,possible]- 设置检查泄露类型,
definite 明确的indirect 间接possible 可能reachable 可达这4种可以设置多个,以逗号相隔 - 可以用 all 表示全部类型,none 表示啥都不显示
- 设置检查泄露类型,
-
--show-reachable=<yes | no>控制是否检测 reachable、indirect 类型泄露,默认只检测 definite,possible 类型--show-reachable=yes 等效于--show-leak-kinds=all
-
--show-possibly-lost=<yes | no>控制是否检测 possible 类型泄露 -
填充数据
-
--malloc-fill=<hexnumber>- 对用 malloc 和 new 分配出的内存块,用 hexnumber 对其进行初始化填充,但 calloc 分配的则不用。
- 这个选项可能对那些不易察觉的 memory corruption(内存损坏)问题有用, 便于观察内存数据那些使用了,那些没使用
-
--free-fill=<hexnumber>一般和 malloc-fill 配合使用- 当用 free 和 delete 释放一个内存块时,用 hexnumber 对内存块进行填充。便于观察内存数据那些释放了,那些没释放
- 它的好处与 --malloc-fill 的相同,被填充的内存仍不能被访问,它只影响它里面的内容。
-
未定义错误
-
--undef-value-errors=<yes|no>- 默认是 yes,即 memcheck 会报道引用未定义错误(uses of undefined value errors),这对检测速度有点影响。
-
--track-origins=<yes | no> [default: no]- undef-value-errors 设置为 yes 有效
- 对使用非初始化的变量的异常,是否跟踪其来源
- 在确定要分析
使用未初始化内存错误时设置即可,平时设置这个会导致程序执行非常慢。
1.4.2. 展示
--leak-check=<no|summary|yes|full>- 如果设为 yes 或 full,在被调程序结束后,valgrind 会详细叙述每一个内存泄露情况
- 默认是summary,只报道发生了几次内存泄露
--verbose显示详细信息--log-file=<filename>--log-fd=<number> [default: 2, stderr]- valgrind 打印日志转存到指定文件或者文件描述符。
- 如果没有这个参数,valgrind 的日志会连同用户程序的日志一起输出,会显得非常乱。
--leak-resolution=<low|med|high>- 这个选项设定内存检查工具在检测出多个内存泄露时,如何将这些内存泄露归结为同一个泄露(合并那些由相同原因引起的)
- 设为 low 时,试图合并前两个泄露情况
- 设为 med,则是前四个
- 默认是high,试图合并所有的泄露情况。
- 这个选项不影响memcheck找泄露的能力,只是影响它的检测结果显示。
1.4.3. 子进程、动态加载库及记录时机
--trace-children=<yes | no> [default: no]- 是否跟踪子进程,若是多进程的程序,则建议使用这个功能。不过单进程使能了也不会有多大影响。
--keep-debuginfo=<yes | no> [default: no]- 如果程序有使用 动态加载库(dlopen),在动态库卸载时(dlclose),debug信息都会被清除。使能这个选项后,即使动态库被卸载,也会保留调用栈信息。
--keep-stacktraces=<alloc | free | alloc-and-free | alloc-then-free | none> [default: alloc-and-free]- 内存泄漏不外乎申请和释放不配对,函数调用栈是只在申请时记录,还是在申请释放时都记录
- 如果我们只关注内存泄漏,其实完全没必要申请释放都记录,因为这会占用非常多的额外内存和更多的 CPU 损耗,让本来就执行慢的程序雪上加霜。
1.4.4. 查错内存优化
--freelist-vol=<number>- 当客户程序用 free 或 delete 释放一个内存块时,这个内存块不会立即可用于再分配,它只会被放在一个freed blocks的队列中(freelist)并被标记为不可访问,这样有利于探测到在一段很重要的时间后,客户程序又对被释放的块进行访问的错误。
- 这个选项规定了队列所占的字节块大小,默认是20MB。
- 增大这个选项的会增大memcheck的内存开销,但查这类错的能力也会提升。
--freelist-big-blocks=<number>- 当从 freelist 队列中取可用内存块用于再分配时,memcheck 将会从那些比 number 大的内存块中按优先级取出一个块出来用。
- 这个选项就防止了 freelist 中那些小的内存块的频繁调用,这个选项提高了 查到针对小内存块的野指针错误的几率。
- 若这个选项设为0,则所有的块将按先进先出的原则用于再分配。
- 默认是1M。
1.4.5. 其他不常用
--partial-loads-ok=<yes|no>- 这个选项决定 memcheck 如何处理 word-sized 和 word-aligned 数据(来自 addresses)的加载情况,addresses处的一些字节块的地址是可重分配地址的,其余的不可。
- 若设为 yes,这种加载不会产生任何错误,当从非法地址处加载字节时会被标记为 uninitialised,从合法地址加载的则按正常方式处理。
- 默认是 no,即将从部分无效的地址处的加载与从完全无效地址处的加载作同等处理,非法地址错误会被报道出来,相应的字节块被标记为initialised。
- 其实这样的代码是不符 ISO C/C++ 标准的,它应该被视为 broken,不管如何,应该修正这样的代码,这个选项应该被作为最后的手段。
--workaround-gcc296-bugs=<yes|no>- 若开启这个选项,则当对栈顶指针下不远处进行读写时不会报错(gcc2.96的bug)
- 默认是no。
- 尽量不要开启这个选项,因为它真有可能造成错误而又不易被察觉,解决方法是用最新的 GCC,它会修正这个错误。
- 在老一点的GCC版本上,可能要用到这个选项。
--ignore-ranges=0x12-0x34[,0x56-0x78]- 这些区间之间的地址,在 memcheck 的寻址检查时将被省略,
- 可以有多个地址区间,逗号隔开。
1.4.6. 程序自解释
valgrind -h
usage: valgrind [options] prog-and-args

  tool-selection option, with default in [ ]:
    --tool=<name>             use the Valgrind tool named <name> [memcheck]

  basic user options for all Valgrind tools, with defaults in [ ]:
    -h --help                 show this message
    --help-debug              show this message, plus debugging options
    --help-dyn-options        show the dynamically changeable options
    --version                 show version
    -q --quiet                run silently; only print error msgs
    -v --verbose              be more verbose -- show misc extra info
    --trace-children=no|yes   Valgrind-ise child processes (follow execve)? [no]
    --trace-children-skip=patt1,patt2,...    specifies a list of executables
                              that --trace-children=yes should not trace into
    --trace-children-skip-by-arg=patt1,patt2,...   same as --trace-children-skip=
                              but check the argv[] entries for children, rather
                              than the exe name, to make a follow/no-follow decision
    --child-silent-after-fork=no|yes omit child output between fork & exec? [no]
    --vgdb=no|yes|full        activate gdbserver? [yes]
                              full is slower but provides precise watchpoint/step
    --vgdb-error=<number>     invoke gdbserver after <number> errors [999999999]
                              to get started quickly, use --vgdb-error=0
                              and follow the on-screen directions
    --vgdb-stop-at=event1,event2,... invoke gdbserver for given events [none]
         where event is one of:
           startup exit valgrindabexit all none
    --track-fds=no|yes|all    track open file descriptors? [no]
                              all includes reporting stdin, stdout and stderr
    --time-stamp=no|yes       add timestamps to log messages? [no]
    --log-fd=<number>         log messages to file descriptor [2=stderr]
    --log-file=<file>         log messages to <file>
    --log-socket=ipaddr:port  log messages to socket ipaddr:port

  user options for Valgrind tools that report errors:
    --xml=yes                 emit error output in XML (some tools only)
    --xml-fd=<number>         XML output to file descriptor
    --xml-file=<file>         XML output to <file>
    --xml-socket=ipaddr:port  XML output to socket ipaddr:port
    --xml-user-comment=STR    copy STR verbatim into XML output
    --demangle=no|yes         automatically demangle C++ names? [yes]
    --num-callers=<number>    show <number> callers in stack traces [12]
    --error-limit=no|yes      stop showing new errors if too many? [yes]
    --exit-on-first-error=no|yes exit code on the first error found? [no]
    --error-exitcode=<number> exit code to return if errors found [0=disable]
    --error-markers=<begin>,<end> add lines with begin/end markers before/after
                              each error output in plain text mode [none]
    --show-error-list=no|yes  show detected errors list and
                              suppression counts at exit [no]
    -s                        same as --show-error-list=yes
    --keep-debuginfo=no|yes   Keep symbols etc for unloaded code [no]
                              This allows saved stack traces (e.g. memory leaks)
                              to include file/line info for code that has been
                              dlclose'd (or similar)
    --show-below-main=no|yes  continue stack traces below main() [no]
    --default-suppressions=yes|no
                              load default suppressions [yes]
    --suppressions=<filename> suppress errors described in <filename>
    --gen-suppressions=no|yes|all    print suppressions for errors? [no]
    --input-fd=<number>       file descriptor for input [0=stdin]
    --dsymutil=no|yes         run dsymutil on Mac OS X when helpful? [yes]
    --max-stackframe=<number> assume stack switch for SP changes larger
                              than <number> bytes [2000000]
    --main-stacksize=<number> set size of main thread's stack (in bytes)
                              [min(max(current 'ulimit' value,1MB),16MB)]

  user options for Valgrind tools that replace malloc:
    --alignment=<number>      set minimum alignment of heap allocations [16]
    --redzone-size=<number>   set minimum size of redzones added before/after
                              heap blocks (in bytes). [16]
    --xtree-memory=none|allocs|full   profile heap memory in an xtree [none]
                              and produces a report at the end of the execution
                              none: no profiling, allocs: current allocated
                              size/blocks, full: profile current and cumulative
                              allocated size/blocks and freed size/blocks.
    --xtree-memory-file=<file>   xtree memory report file [xtmemory.kcg.%p]

  uncommon user options for all Valgrind tools:
    --fullpath-after=         (with nothing after the '=')
                              show full source paths in call stacks
    --fullpath-after=string   like --fullpath-after=, but only show the
                              part of the path after 'string'.  Allows removal
                              of path prefixes.  Use this flag multiple times
                              to specify a set of prefixes to remove.
    --extra-debuginfo-path=path    absolute path to search for additional
                              debug symbols, in addition to existing default
                              well known search paths.
    --debuginfo-server=ipaddr:port    also query this server
                              (valgrind-di-server) for debug symbols
    --allow-mismatched-debuginfo=no|yes  [no]
                              for the above two flags only, accept debuginfo
                              objects that don't "match" the main object
    --smc-check=none|stack|all|all-non-file [all-non-file]
                              checks for self-modifying code: none, only for
                              code found in stacks, for all code, or for all
                              code except that from file-backed mappings
    --read-inline-info=yes|no read debug info about inlined function calls
                              and use it to do better stack traces.
                              [yes] on Linux/Android/Solaris for the tools
                              Memcheck/Massif/Helgrind/DRD only.
                              [no] for all other tools and platforms.
    --read-var-info=yes|no    read debug info on stack and global variables
                              and use it to print better error messages in
                              tools that make use of it (Memcheck, Helgrind,
                              DRD) [no]
    --vgdb-poll=<number>      gdbserver poll max every <number> basic blocks [5000]
    --vgdb-shadow-registers=no|yes   let gdb see the shadow registers [no]
    --vgdb-prefix=<prefix>    prefix for vgdb FIFOs [/tmp/vgdb-pipe]
    --run-libc-freeres=no|yes free up glibc memory at exit on Linux? [yes]
    --run-cxx-freeres=no|yes  free up libstdc++ memory at exit on Linux
                              and Solaris? [yes]
    --sim-hints=hint1,hint2,...  activate unusual sim behaviours [none]
         where hint is one of:
           lax-ioctls lax-doors fuse-compatible enable-outer
           no-inner-prefix no-nptl-pthread-stackcache fallback-llsc none
    --fair-sched=no|yes|try   schedule threads fairly on multicore systems [no]
    --kernel-variant=variant1,variant2,...
         handle non-standard kernel variants [none]
         where variant is one of:
           bproc android-no-hw-tls
           android-gpu-sgx5xx android-gpu-adreno3xx none
    --merge-recursive-frames=<number>  merge frames between identical
           program counters in max <number> frames) [0]
    --num-transtab-sectors=<number> size of translated code cache [32]
           more sectors may increase performance, but use more memory.
    --avg-transtab-entry-size=<number> avg size in bytes of a translated
           basic block [0, meaning use tool provided default]
    --aspace-minaddr=0xPP     avoid mapping memory below 0xPP [guessed]
    --valgrind-stacksize=<number> size of valgrind (host) thread's stack
                               (in bytes) [1048576]
    --show-emwarns=no|yes     show warnings about emulation limits? [no]
    --require-text-symbol=:sonamepattern:symbolpattern    abort run if the
                              stated shared object doesn't have the stated
                              text symbol.  Patterns can contain ? and *.
    --soname-synonyms=syn1=pattern1,syn2=pattern2,... synonym soname
              specify patterns for function wrapping or replacement.
              To use a non-libc malloc library that is
                  in the main exe:  --soname-synonyms=somalloc=NONE
                  in libxyzzy.so:   --soname-synonyms=somalloc=libxyzzy.so
    --sigill-diagnostics=yes|no  warn about illegal instructions? [yes]
    --unw-stack-scan-thresh=<number>   Enable stack-scan unwind if fewer
                  than <number> good frames found  [0, meaning "disabled"]
                  NOTE: stack scanning is only available on arm-linux.
    --unw-stack-scan-frames=<number>   Max number of frames that can be
                  recovered by stack scanning [5]
    --resync-filter=no|yes|verbose [yes on MacOS, no on other OSes]
              attempt to avoid expensive address-space-resync operations
    --max-threads=<number>    maximum number of threads that valgrind can
                              handle [500]

  user options for Memcheck:
    --leak-check=no|summary|full     search for memory leaks at exit?  [summary]
    --leak-resolution=low|med|high   differentiation of leak stack traces [high]
    --show-leak-kinds=kind1,kind2,.. which leak kinds to show?
                                            [definite,possible]
    --errors-for-leak-kinds=kind1,kind2,..  which leak kinds are errors?
                                            [definite,possible]
        where kind is one of:
          definite indirect possible reachable all none
    --leak-check-heuristics=heur1,heur2,... which heuristics to use for
        improving leak search false positive [all]
        where heur is one of:
          stdstring length64 newarray multipleinheritance all none
    --show-reachable=yes             same as --show-leak-kinds=all
    --show-reachable=no --show-possibly-lost=yes
                                     same as --show-leak-kinds=definite,possible
    --show-reachable=no --show-possibly-lost=no
                                     same as --show-leak-kinds=definite
    --xtree-leak=no|yes              output leak result in xtree format? [no]
    --xtree-leak-file=<file>         xtree leak report file [xtleak.kcg.%p]
    --undef-value-errors=no|yes      check for undefined value errors [yes]
    --track-origins=no|yes           show origins of undefined values? [no]
    --partial-loads-ok=no|yes        too hard to explain here; see manual [yes]
    --expensive-definedness-checks=no|auto|yes
                                     Use extra-precise definedness tracking [auto]
    --freelist-vol=<number>          volume of freed blocks queue     [20000000]
    --freelist-big-blocks=<number>   releases first blocks with size>= [1000000]
    --workaround-gcc296-bugs=no|yes  self explanatory [no].  Deprecated.
                                     Use --ignore-range-below-sp instead.
    --ignore-ranges=0xPP-0xQQ[,0xRR-0xSS]   assume given addresses are OK
    --ignore-range-below-sp=<number>-<number>  do not report errors for
                                     accesses at the given offsets below SP
    --malloc-fill=<hexnumber>        fill malloc'd areas with given value
    --free-fill=<hexnumber>          fill free'd areas with given value
    --keep-stacktraces=alloc|free|alloc-and-free|alloc-then-free|none
        stack trace(s) to keep for malloc'd/free'd areas       [alloc-and-free]
    --show-mismatched-frees=no|yes   show frees that don't match the allocator? [yes]

  Extra options read from ~/.valgrindrc, $VALGRIND_OPTS, ./.valgrindrc

  Memcheck is Copyright (C) 2002-2022, and GNU GPL'd, by Julian Seward et al.
  Valgrind is Copyright (C) 2000-2017, and GNU GPL'd, by Julian Seward et al.
  LibVEX is Copyright (C) 2004-2017, and GNU GPL'd, by OpenWorks LLP et al.

  Bug reports, feedback, admiration, abuse, etc, to: www.valgrind.org.


 2万+
2万+

 被折叠的 条评论
为什么被折叠?
被折叠的 条评论
为什么被折叠?
 到【灌水乐园】发言


