matlab meanshift

用MATLAB 编写的meanshift 寻找聚类中心的程序 有些简陋

%% mean shift
%% 产生随机点
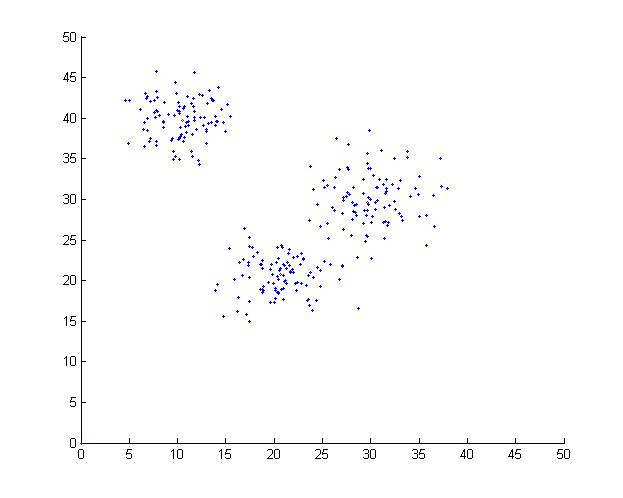
x1 = 30 + sqrt(9) * randn(1,100);
y1 = 30 +sqrt(9) * randn(1,100);

x2 =20+sqrt(7) * randn(1,100);
y2 =20+sqrt(7) * randn(1,100);

x3 =10+sqrt(6) * randn(1,100);
y3 =40+sqrt(6) * randn(1,100);

x=[x1 x2 x3];
y=[y1 y2 y3];

h =5;
pointx =[x(1),y(1)];
points=[x' y'];
%% 
%% 
ddd =size(points);
centers=zeros(10,2);
count =1;
for i=1:ddd(1);
    pointx =points(i,:);
    flag=0;
    while(1)
     [number,mh]=FindPoint(pointx,points,h);%返回漂移向量mh。
      if sqrt(mh(1)^2+mh(2)^2)<0.001 
      break;
      end
      pointx=pointx+mh;
    end
    if count==1
       tempcenter=centers(count,:); 
    else
       tempcenter=centers(count-1,:); 
    end
    
    if sqrt((pointx(1)-tempcenter(1))^2+(pointx(2)-tempcenter(2))^2)>5
        for ii=1:count
            tep =centers(ii,:);
            if sqrt((tep(1)-pointx(1))^2+(tep(2)-pointx(2))^2)<1
                flag=1;
                break;
            end
        end
        if flag==0
        centers(count,:)=pointx;
        count=count+1;
        end
    end
end

scatter(x,y,3,'filled');
axis([0 50 0 50]);
hold on
scatter(centers(:,1),centers(:,2),5,[1 0 0],'filled');


函数
FindPoint求出均值漂移向量
function [ number,mh] = FindPoint( pointx,points,radis )
%FINDPOINT Summary of this function goes here
%   Detailed explanation goes here
    a=size(points);
    num=0;
    sum=[0,0];
    total =a(1);
    for i=1:total
        temppoint =points(i,:);
        r=sqrt((pointx(1)-temppoint(1))*(pointx(1)-temppoint(1))+(pointx(2)-temppoint(2))*(pointx(2)-temppoint(2)));
        if(r<=radis)
            num=num+1;
            sum=sum+[temppoint(1)-pointx(1),temppoint(2)-pointx(2)];
        end
    end
    number=num;
    mh=sum/num;
end


效果图:


  • 3
    点赞
  • 5
    收藏
    觉得还不错? 一键收藏
  • 0
    评论
以下是MeanShiftMatlab代码演示[^1]: ```matlab % Mean Shift Clustering Example % Code written by Dr. Matthew E. Martin % Assistant Professor, Department of Computer Science % The University of Oklahoma % % This code demonstrates the Mean Shift clustering algorithm % % The data set used consists of 1000 points in 3D space. % These points are divided into two clusters. % One cluster is centered at position (30,30,30) and the other % at position (80,80,80) % Each point in the cluster is normally distributed with a standard % deviation of 5 units. % % The Mean Shift clustering algorithm is then run on this data set and the % resulting clusters are plotted using different colors for better visualization % % NOTE: This code is for educational purposes only and is not intended % for commercial use without permission from the author. % % Code is provided "as is" and the author assumes no responsibility % for any errors or problems that may arise from using this code. % Create Data Set x = [randn(1000,1)*5+30 randn(1000,1)*5+30 randn(1000,1)*5+30; ... randn(1000,1)*5+80 randn(1000,1)*5+80 randn(1000,1)*5+80]; % Implement Mean Shift ms = MeanShift(); ms.bandwidth = 8; ms.min_points = 10; result = ms.cluster(x); % Plot Results figure; hold on; scatter3(result(:,1),result(:,2),result(:,3)); view(-115,40); % Define MeanShift Class classdef MeanShift properties bandwidth = 8; min_points = 10; end methods function cluster_result = cluster(obj,X) n = size(X,1); labels = zeros(n,1); cluster_center = []; visited = false(n,1); for i=1:n if ~visited(i) visited(i) = true; [new_cluster,labels] = obj.pointsInRange(X,X(i,:),visited); while size(new_cluster,1) > 0 [new_cluster,labels2] = obj.pointsInRange(X,new_cluster(1,:),visited); if size(new_cluster,1) >= obj.min_points labels(labels2) = size(cluster_center,1)+1; cluster_center = [cluster_center; mean(new_cluster)]; end visited(labels2) = true; new_cluster(1,:) = []; end if labels(i) == 0 cluster_center = [cluster_center; X(i,:)]; labels(i) = size(cluster_center,1); end end end cluster_result = cluster_center(labels,:); end function [new_cluster,labels] = pointsInRange(obj,X,x,visited) distance = sqrt(sum((X-repmat(x,size(X,1),1)).^2,2)); in_range = distance < obj.bandwidth; labels = find(in_range); new_cluster = X(in_range,:); new_cluster = new_cluster(~visited(in_range),:); end end end ``` 另外,还可以使用Python实现Mean Shift聚类算法,以下是Python代码示例[^2]: ```python import numpy as np import matplotlib.pyplot as plt from sklearn.cluster import MeanShift, estimate_bandwidth from itertools import cycle #Input dataset X = np.array([[1, 2], [1, 4], [1, 0], [10, 2], [10, 4], [10, 0]]) #Estimate bandwidth bandwidth = estimate_bandwidth(X, quantile=0.2, n_samples=500) #Fit mean shift algorithm to data ms = MeanShift(bandwidth=bandwidth, bin_seeding=True) ms.fit(X) #Extract cluster assignments for each data point labels = ms.labels_ #Extract centroids centroids = ms.cluster_centers_ #Number of clusters n_clusters_ = len(np.unique(labels)) #Plot result print("Number of estimated clusters : %d" % n_clusters_) colors = cycle('bgrcmykbgrcmykbgrcmykbgrcmyk') for k, col in zip(range(n_clusters_), colors): my_members = labels == k cluster_center = centroids[k] plt.plot(X[my_members, 0], X[my_members, 1], col + '.') plt.plot(cluster_center, cluster_center, 'o', markerfacecolor=col, markeredgecolor='k', markersize=14) plt.title('Estimated number of clusters: %d' % n_clusters_) plt.show() ```
评论
添加红包

请填写红包祝福语或标题

红包个数最小为10个

红包金额最低5元

当前余额3.43前往充值 >
需支付:10.00
成就一亿技术人!
领取后你会自动成为博主和红包主的粉丝 规则
hope_wisdom
发出的红包
实付
使用余额支付
点击重新获取
扫码支付
钱包余额 0

抵扣说明:

1.余额是钱包充值的虚拟货币,按照1:1的比例进行支付金额的抵扣。
2.余额无法直接购买下载,可以购买VIP、付费专栏及课程。

余额充值