


1、柱状图
语法:
barplot(height, width = 1, space = NULL,
names.arg = NULL, legend.text = NULL, beside = FALSE,
horiz = FALSE, density = NULL, angle = 45,
col = NULL, border = par(“fg”),
main = NULL, sub = NULL, xlab = NULL, ylab = NULL,
xlim = NULL, ylim = NULL, xpd = TRUE, log = “”,
axes = TRUE, axisnames = TRUE,
cex.axis = par(“cex.axis”), cex.names = par(“cex.axis”),
inside = TRUE, plot = TRUE, axis.lty = 0, offset = 0,
add = FALSE, args.legend = NULL, …)
解析:
height:一个向量或矩阵。
当height是一组向量时,那么柱图的高度是向量的数值;
当height是矩阵且beside=FALSE时,柱图的高度是矩阵的数值,柱状图是水平堆叠的
当height是矩阵且beside=TRUE时,柱图的高度是矩阵的数值,柱状图是并列的
barplot(as.matrix(student[1:5,2:4]),col=c('red','green','blue'),beside=FALSE)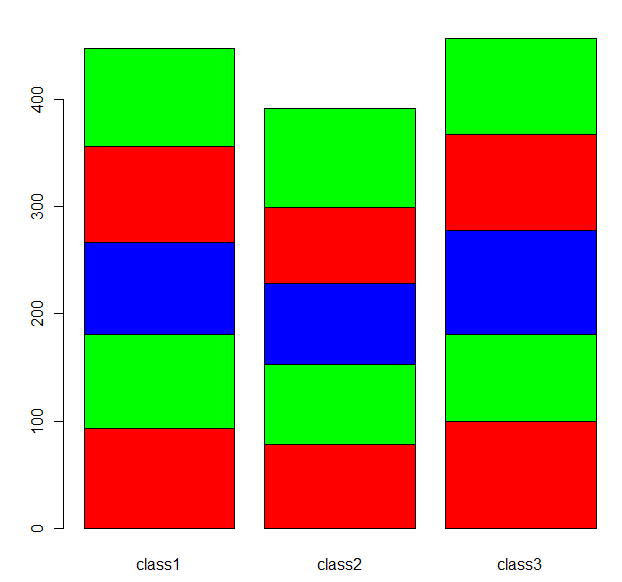
> barplot(as.matrix(student[1:5,2:4]),col=c('red','green','blue'),beside=TRUE)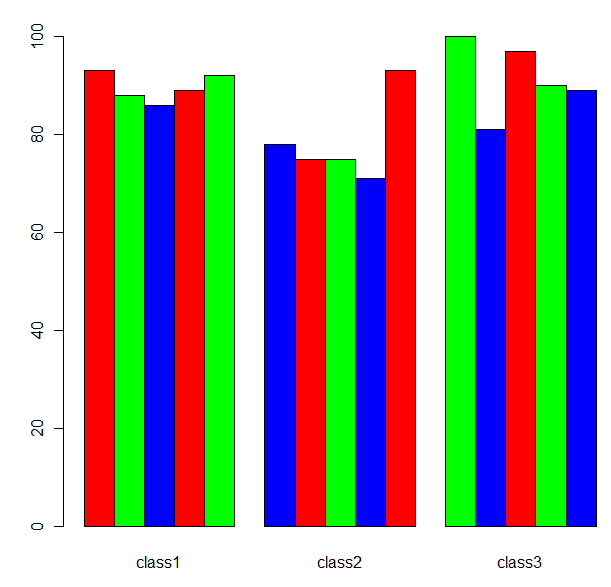
width:可选 设置柱子的宽度的向量
space:每两个柱子间的距离,默认c(0,1)
> barplot(as.matrix(student[1:5,2:4]),col=c('red','green','blue'),beside=TRUE,space=c(0,1))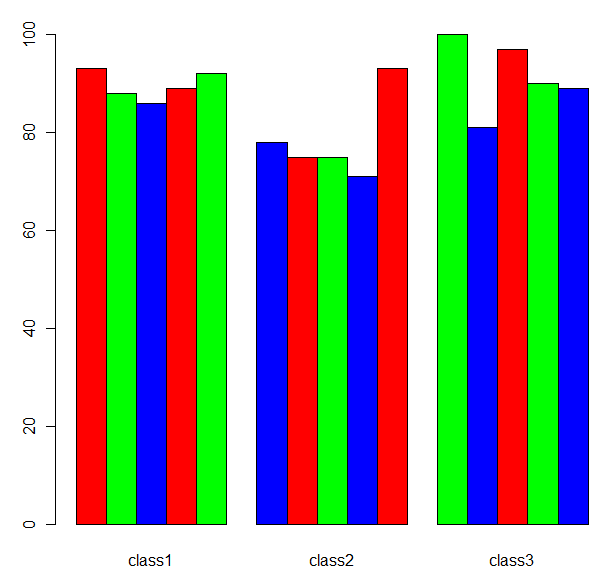
> barplot(as.matrix(student[1:5,2:4]),col=c('red','green','blue'),beside=TRUE,space=c(1,1))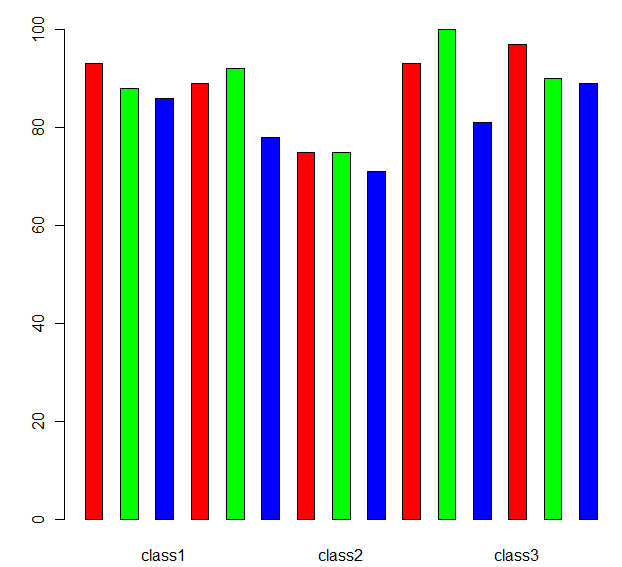
names.arg
legend.text
beside
horiz:一个逻辑值。horiz=TRUE y轴在水平展示
>barplot(as.matrix(student[1:5,2:4]),col=c('red','green','blue'),beside=TRUE,horiz=TRUE)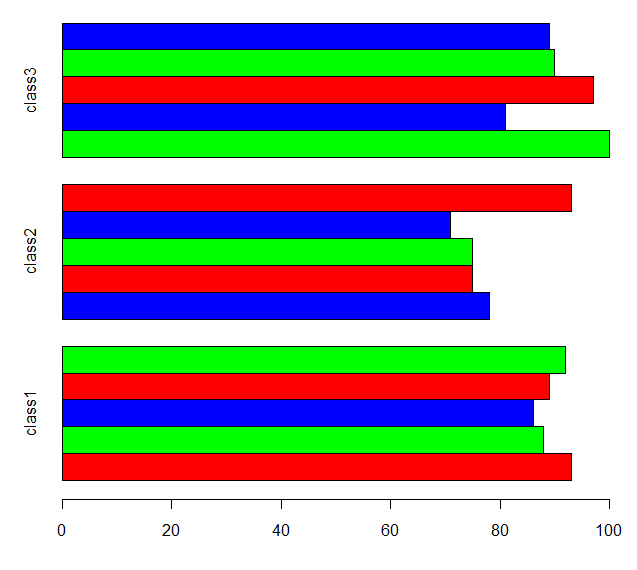
density
angle
col
border
main,sub
xlab
ylab
xlim
ylim
xpd
log
axes
axisnames
cex.axis
cex.names
inside
plot
axis.lty
offset
add
args.legend
…


 145
145

 被折叠的 条评论
为什么被折叠?
被折叠的 条评论
为什么被折叠?
 到【灌水乐园】发言


