【HIVE】问题汇总(持续更新)

1、hive sql报错Error: Error while compiling statement: FAILED: SemanticException UDF reflect is not allowed。

set hive.server2.builtin.udf.blacklist=empty_blacklist; set hive.server2.builtin.udf.blacklist; select t1.device_id, t1.appsflyer_id, t1.dt as server_date, t1.event_time, t1.platform, t1.device_model, t1.device_manufacturer, t1.app_version, t2.media_source, t2.install_time from ( – 每天 按事件时间 全量计算设备增加日期 select device_id, appsflyer_id, event_time, platform, device_model, device_manufacturer, app_version, dt from ( select device_id, appsflyer_id, event_time, platform, device_model, device_manufacturer, app_version, dt, row_number() over(partition by device_id order by event_time) rn from opay_dw.dwd_owallet_client_first_visit_base_di where dt <= ‘2021-04-12’ and device_id != ‘’ and platform != ‘h5’ ) tx where rn = 1 ) t1 left join ( – 设备关联渠道信息 SELECT appsflyer_id, media_source, app_name, install_time from ( SELECT appsflyer_id, media_source, app_name, install_time, row_number() over(PARTITION BY appsflyer_id ORDER BY install_time) rn from opay_dw.dwd_opay_tracker_appsflyer_di where dt<= if(‘2021-04-12’ <= ‘2020-11-30’, ‘2020-11-30’, ‘2021-04-12’) and event_name = ‘install’ and app_id=‘team.opay.pay’ ) t0 where rn = 1 ) t2 on nvl(t1.appsflyer_id, regexp_replace(reflect(“java.util.UUID”, “randomUUID”), “-”, “”)) = t2.appsflyer_id

在使用HiveServer2使用hive内置的UDF函数reflect 的时候,提示“semanticexception udf reflect is not allowed”,“reflect ”不允许被使用,默认情况下,HiveServer2为了安全,禁用了部分udf函数。
可以通过修改hive-site.xml,重启HiveServer2,即可生效(无法使用set进行修改)。

 <property>
    <name>hive.server2.builtin.udf.blacklist</name>
    <value>empty_blacklist</value>
  </property>
  <property>
    <name>hive.server2.builtin.udf.whitelist</name>
    <value></value>
  </property>

2、TEZ引擎一直卡主
在这里插入图片描述
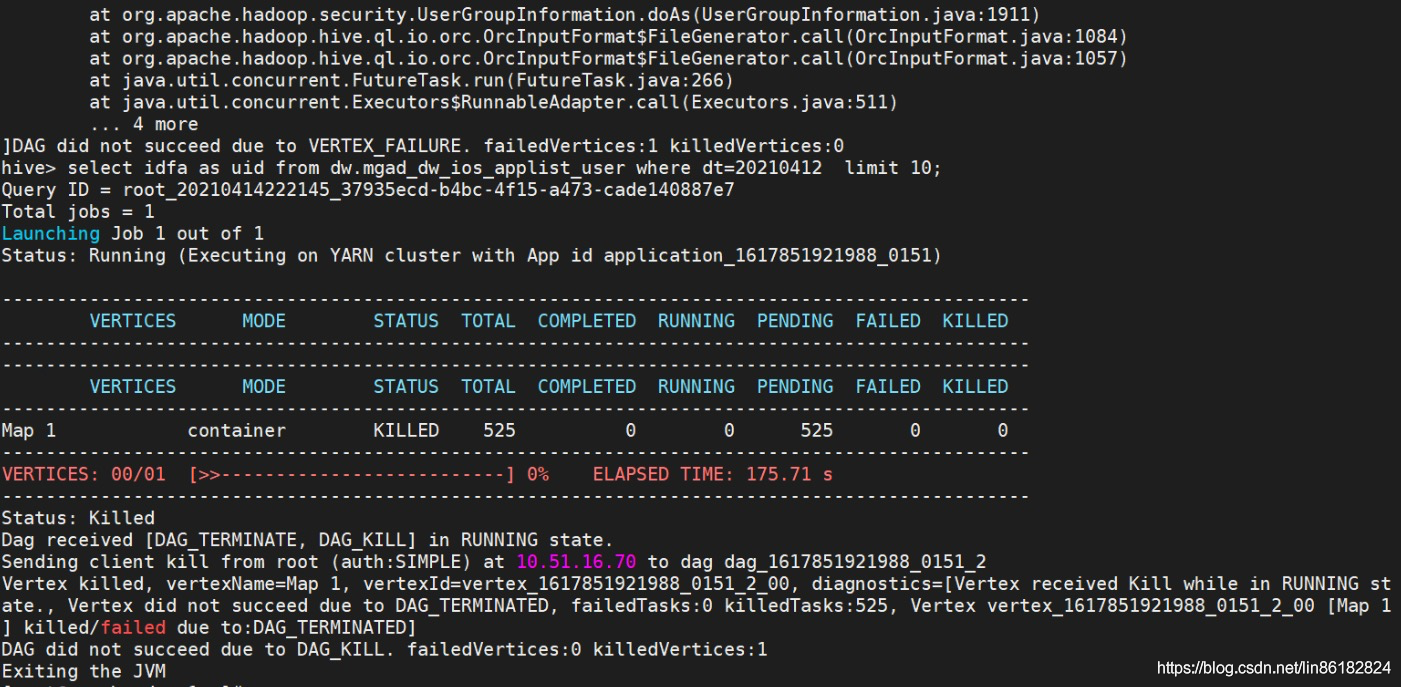
原因是:集群的 mapreduce.map.cpu.vcores 改成了 4,hive 默认会使用这个参数作为 tez container 的 vcores。tez vcores 大于 1 时会导致无法正常启动 container,可以设置参数 hive.tez.cpu.vcores=1 来解决。

3、MR报错

2021-06-25 21:12:29,906 Stage-1 map = 11%, reduce = 0%, Cumulative CPU 211.65 sec
2021-06-25 21:12:31,967 Stage-1 map = 12%, reduce = 0%, Cumulative CPU 240.86 sec
2021-06-25 21:12:34,038 Stage-1 map = 13%, reduce = 0%, Cumulative CPU 257.37 sec
2021-06-25 21:12:35,070 Stage-1 map = 14%, reduce = 0%, Cumulative CPU 269.01 sec
2021-06-25 21:12:39,204 Stage-1 map = 15%, reduce = 0%, Cumulative CPU 296.87 sec
2021-06-25 21:12:41,266 Stage-1 map = 17%, reduce = 0%, Cumulative CPU 364.57 sec
2021-06-25 21:12:43,328 Stage-1 map = 19%, reduce = 0%, Cumulative CPU 396.36 sec
2021-06-25 21:12:49,520 Stage-1 map = 20%, reduce = 0%, Cumulative CPU 423.19 sec
2021-06-25 21:12:53,643 Stage-1 map = 22%, reduce = 0%, Cumulative CPU 432.38 sec
2021-06-25 21:13:02,921 Stage-1 map = 23%, reduce = 0%, Cumulative CPU 455.76 sec
2021-06-25 21:13:12,186 Stage-1 map = 24%, reduce = 0%, Cumulative CPU 466.36 sec
2021-06-25 21:13:15,277 Stage-1 map = 25%, reduce = 0%, Cumulative CPU 524.85 sec
2021-06-25 21:13:26,614 Stage-1 map = 26%, reduce = 0%, Cumulative CPU 582.57 sec
2021-06-25 21:13:28,671 Stage-1 map = 27%, reduce = 0%, Cumulative CPU 644.05 sec
2021-06-25 21:13:31,756 Stage-1 map = 28%, reduce = 0%, Cumulative CPU 719.1 sec
2021-06-25 21:13:37,934 Stage-1 map = 100%, reduce = 100%, Cumulative CPU 660.27 sec
MapReduce Total cumulative CPU time: 11 minutes 0 seconds 270 msec
Ended Job = job_1623809152303_0587 with errors
Error during job, obtaining debugging information…
Job Tracking URL: http://emr-header-1.cluster-230631:20888/proxy/application_1623809152303_0587/
Examining task ID: task_1623809152303_0587_m_000008 (and more) from job job_1623809152303_0587
Examining task ID: task_1623809152303_0587_m_000012 (and more) from job job_1623809152303_0587
Examining task ID: task_1623809152303_0587_m_000001 (and more) from job job_1623809152303_0587
Examining task ID: task_1623809152303_0587_m_000010 (and more) from job job_1623809152303_0587
Examining task ID: task_1623809152303_0587_m_000033 (and more) from job job_1623809152303_0587
Examining task ID: task_1623809152303_0587_m_000040 (and more) from job job_1623809152303_0587

Task with the most failures(4):
Task ID:
task_1623809152303_0587_m_000010

URL:
http://0.0.0.0:8088/taskdetails.jsp?jobid=job_1623809152303_0587&tipid=task_1623809152303_0587_m_000010
Diagnostic Messages for this Task:
Container [pid=23152,containerID=container_e03_1623809152303_0587_01_000055] is running beyond physical memory limits. Current usage: 8.7 GB of 8.2 GB physical memory used; 16.5 GB of 75.0 TB virtual memory used. Killing container.
Dump of the process-tree for container_e03_1623809152303_0587_01_000055 :
|- PID PPID PGRPID SESSID CMD_NAME USER_MODE_TIME(MILLIS) SYSTEM_TIME(MILLIS) VMEM_USAGE(BYTES) RSSMEM_USAGE(PAGES) FULL_CMD_LINE
|- 23152 23150 23152 23152 (bash) 0 0 116043776 680 /bin/bash -c /usr/lib/jvm/java-1.8.0/bin/java -Djava.net.preferIPv4Stack=true -Dhadoop.metrics.log.level=WARN -Xmx8392m -XX:ParallelGCThreads=2 -XX:CICompilerCount=2 -Djava.io.tmpdir=/mnt/disk4/yarn/usercache/root/appcache/application_1623809152303_0587/container_e03_1623809152303_0587_01_000055/tmp -Dlog4j.configuration=container-log4j.properties -Dyarn.app.container.log.dir=/mnt/disk2/log/hadoop-yarn/containers/application_1623809152303_0587/container_e03_1623809152303_0587_01_000055 -Dyarn.app.container.log.filesize=0 -Dhadoop.root.logger=INFO,CLA -Dhadoop.root.logfile=syslog org.apache.hadoop.mapred.YarnChild 192.168.20.19 37771 attempt_1623809152303_0587_m_000010_3 3298534883383 1>/mnt/disk2/log/hadoop-yarn/containers/application_1623809152303_0587/container_e03_1623809152303_0587_01_000055/stdout 2>/mnt/disk2/log/hadoop-yarn/containers/application_1623809152303_0587/container_e03_1623809152303_0587_01_000055/stderr
|- 23169 23152 23152 23152 (java) 1738 979 17575825408 2270358 /usr/lib/jvm/java-1.8.0/bin/java -Djava.net.preferIPv4Stack=true -Dhadoop.metrics.log.level=WARN -Xmx8392m -XX:ParallelGCThreads=2 -XX:CICompilerCount=2 -Djava.io.tmpdir=/mnt/disk4/yarn/usercache/root/appcache/application_1623809152303_0587/container_e03_1623809152303_0587_01_000055/tmp -Dlog4j.configuration=container-log4j.properties -Dyarn.app.container.log.dir=/mnt/disk2/log/hadoop-yarn/containers/application_1623809152303_0587/container_e03_1623809152303_0587_01_000055 -Dyarn.app.container.log.filesize=0 -Dhadoop.root.logger=INFO,CLA -Dhadoop.root.logfile=syslog org.apache.hadoop.mapred.YarnChild 192.168.20.19 37771 attempt_1623809152303_0587_m_000010_3 3298534883383

Container killed on request. Exit code is 143
Container exited with a non-zero exit code 143

FAILED: Execution Error, return code 2 from org.apache.hadoop.hive.ql.exec.mr.MapRedTask
MapReduce Jobs Launched:
Stage-Stage-1: Map: 130 Reduce: 1 Cumulative CPU: 660.27 sec HDFS Read: 10551786453 HDFS Write: 0 FAIL
Total MapReduce CPU Time Spent: 11 minutes 0 seconds 270 msec
hive>

这个报错是因为 MapReduce 任务的 mapreduce.map.memory.mb 和 mapreduce.map.java.opts 配置的内存值太接近(都是8.2G),建议前者是后者的1.2倍

4、hive创建表时快时慢
一般这种问题就是gc问题。
jstat -gc pid 200
在这里插入图片描述
建议调大metastore的内存。
参数 hive_metastore_heapsize
另外连接数也蛮多的话建议使用hiveserver2这种,会复用之前的metaStoreClient实例。
在这里插入图片描述

5、beeline上select * 和select count不一致
【问题】hue中查询数据, select count(1) from …可以查到数据总量,但是select * from …就查不出来数据。
首先确定表里确实是没有数据的。跑的时候还加了参数。
当hive.compute.query.using.stats=true时,select count(*) from直接从元数据保存的统计信息中获取表中记录条数。
当时元数据里的信息还是你当时有数据的时候的可能,然后直接从里面获取的。select * 的时候走了mr计算所以两个结果就不一样。
有的时候hive.cbo.enable这种参数也需要关掉。

6、如何添加第三方jar
需要在hive_aux_jars_path添加jar包路径,或者将jar包放入lib/下

7、hive作业的case when 操作时报错:Internal error: Cannot add expression of different type to set
在这里插入图片描述
这是calcite的bug,建议把CBO关掉,set hive.cbo.enable=false

8、当hive.vectorized.execution.enabled为true时,对空分区表的查询因NPE而失败
在这里插入图片描述
在这里插入图片描述

https://issues.apache.org/jira/browse/HIVE-17272
hive向量化的bug。

9、hive on spark 查询结果为空,原因是hive on spark 社区版本的一个 bug
(1)可以切换到mr引擎,进行测试
(2)如果切换到tez引擎,查询结果报如下错误,
Caused by: java.lang.ClassCastException: org.apache.hadoop.hive.ql.exec.vector.LongColumnVector cannot be cast to org.apache.hadoop.hive.ql.exec.vector.DecimalColumnVector
需要在客户端设置属性 set hive.vectorized.execution.enabled=false 后才可执行,属性作用不使用向量化执行可以解决vector强转。

10、hive的metastore正常但是经常报连接失败
2021-02-26T04:24:39,825 INFO [HiveServer2-Handler-Pool: Thread-93876] hive.metastore: Trying to connect to metastore with URI thrift://emr-header-2.cluster-75930:9083
2021-02-26T04:24:39,826 WARN [HiveServer2-Handler-Pool: Thread-93876] hive.metastore: Failed to connect to the MetaStore Server…
2021-02-26T04:24:39,826 INFO [HiveServer2-Handler-Pool: Thread-93876] hive.metastore: Trying to connect to metastore with URI thrift://emr-header-1.cluster-75930:9083
基本上1毫秒就切换到去连第二个metastore了,这个应该是metastore机器开的连接数太少
可以调大 linux参数 net.core.somaxconn

11、使用mongodb数据库导入表到hive中报错org/apache/hadoop/hive/serde2/SerDe
1.将这三个jar传到各个节点的/usr/lib/hive-current/lib/
2.重启hive服务 测试会出现 org/apache/hadoop/hive/serde2/SerDe报错
然后使用下面方法,但是还是报错
3.尝试在hive cli中add这三个jar再建表测试 add jar /home/dxh/mongo-hadoop-core-1.3.0.jar; add jar /home/dxh/mongo-hadoop-hive-1.3.0.jar; add jar /home/dxh/mongo-java-driver-2.12.2.jar;
报错信息:FAILED: Execution Error, return code 1 from org.apache.hadoop.hive.ql.exec.DDLTask. org/apache/hadoop/hive/serde2/SerDe
解决办法:HIVE_AUX_JARS_PATH 加一下 这个 jar , hive-serde-xxxx.jar ,在/usr/lib/hive-current/jars

  • 0
    点赞
  • 7
    收藏
    觉得还不错? 一键收藏
  • 0
    评论

“相关推荐”对你有帮助么?

  • 非常没帮助
  • 没帮助
  • 一般
  • 有帮助
  • 非常有帮助
提交
评论
添加红包

请填写红包祝福语或标题

红包个数最小为10个

红包金额最低5元

当前余额3.43前往充值 >
需支付:10.00
成就一亿技术人!
领取后你会自动成为博主和红包主的粉丝 规则
hope_wisdom
发出的红包
实付
使用余额支付
点击重新获取
扫码支付
钱包余额 0

抵扣说明:

1.余额是钱包充值的虚拟货币,按照1:1的比例进行支付金额的抵扣。
2.余额无法直接购买下载,可以购买VIP、付费专栏及课程。

余额充值