


 本文介绍如何使用WPFToolKit库中的System.Windows.Controls.DataVisualization.Toolkit.dll和WPFToolkit.dll组件在WPF应用程序中生成柱状图,并提供了详细的代码示例。
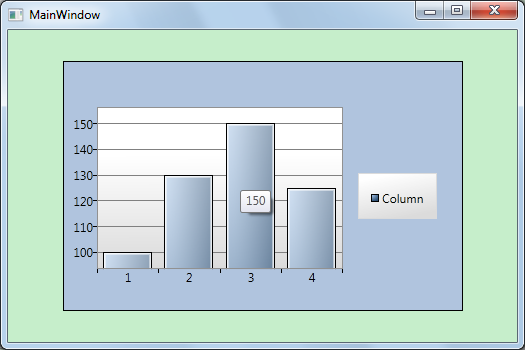
刚认识一个WPF的工具,WPF ToolKit 先用来生成图表,不错。
操作步骤:
1.下载并安装WPF ToolKit
2.创建WPF项目并加载相应组件:
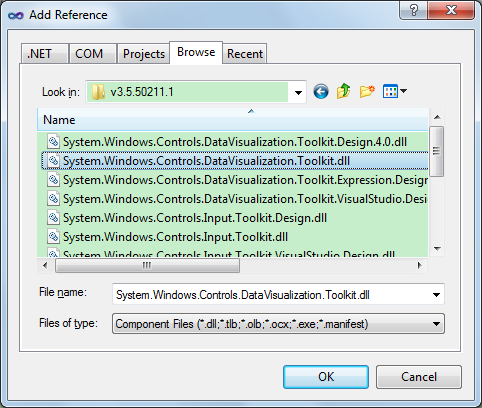
这里主要应用System.Windows.Controls.DataVisualization.Toolkit.dll 和WPFToolkit.dll。

 代码
代码
     <


     Window x:Class


     =


     "


     Wpftest.MainWindow


     "


        xmlns


     =


     "


     http://schemas.microsoft.com/winfx/2006/xaml/presentation


     "


        xmlns:x


     =


     "


     http://schemas.microsoft.com/winfx/2006/xaml


     "


        xmlns:dc


     =


     "


     clr-namespace:System.Windows.Controls.DataVisualization.Charting;assembly=System.Windows.Controls.DataVisualization.Toolkit


     "


        xmlns:dv


     =


     "


     clr-namespace:System.Windows.Controls.DataVisualization;assembly=System.Windows.Controls.DataVisualization.Toolkit


     "


        Title


     =


     "


     MainWindow


     "


      Height


     =


     "


     350


     "


      Width


     =


     "


     525


     "


      Loaded


     =


     "


     Window_Loaded


     "


     >


     <


     Grid


     >


     <


     dc:Chart Canvas.Top


     =


     "


     80


     "


      Canvas.Left


     =


     "


     10


     "


      Name


     =


     "


     mcChart


     "


           Width


     =


     "


     400


     "


      Height


     =


     "


     250


     "


           Background


     =


     "


     LightSteelBlue


     "


     >


     <


     dc:Chart.Series


     >


     <


     dc:ColumnSeries Title


     =


     "


     Column


     "


            IndependentValueBinding


     =


     "


     {Binding Path=Key}


     "


            DependentValueBinding


     =


     "


     {Binding Path=Value}


     "


     >


     </


     dc:ColumnSeries


     >


     </


     dc:Chart.Series


     >


     </


     dc:Chart


     >


     </


     Grid


     >


     </


     Window


     >
代码
     using


      System;


     using


      System.Collections.Generic;


     using


      System.Linq;


     using


      System.Text;


     using


      System.Windows;


     using


      System.Windows.Controls;


     using


      System.Windows.Data;


     using


      System.Windows.Documents;


     using


      System.Windows.Input;


     using


      System.Windows.Media;


     using


      System.Windows.Media.Imaging;


     using


      System.Windows.Navigation;


     using


      System.Windows.Shapes;


     using


      System.Windows.Controls.DataVisualization.Charting;


     namespace


      Wpftest

{


     ///


     <summary>


     ///


      Interaction logic for MainWindow.xaml


     ///


     </summary>


     public


     partial


     class


      MainWindow : Window

    {


     public


      MainWindow()

        {

            InitializeComponent();

        }


     private


     void


      Window_Loaded(


     object


      sender, RoutedEventArgs e)

        {


            ((ColumnSeries)mcChart.Series[


     0


     ]).ItemsSource


     =


     new


      KeyValuePair


     <


     int


     ,


     int


     >


     []{


     new


      KeyValuePair


     <


     int


     ,


     int


     >


     (


     1


     ,


     100


     ),


     new


      KeyValuePair


     <


     int


     ,


     int


     >


     (


     2


     ,


     130


     ),


     new


      KeyValuePair


     <


     int


     ,


     int


     >


     (


     3


     ,


     150


     ),


     new


      KeyValuePair


     <


     int


     ,


     int


     >


     (


     4


     ,


     125


     )


            };


        }

    }

}
它有很多样式可以选择的: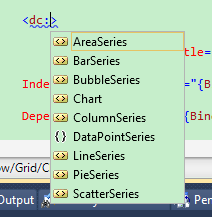 。
。
BubbleSeries: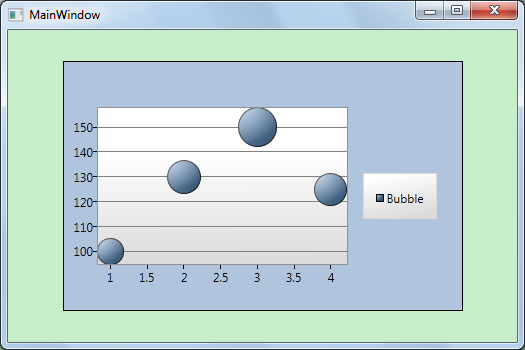
LineSeries: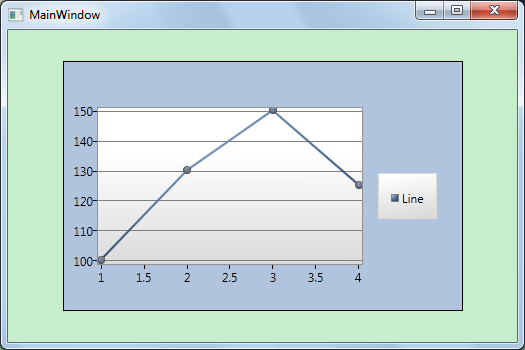
PieSeries: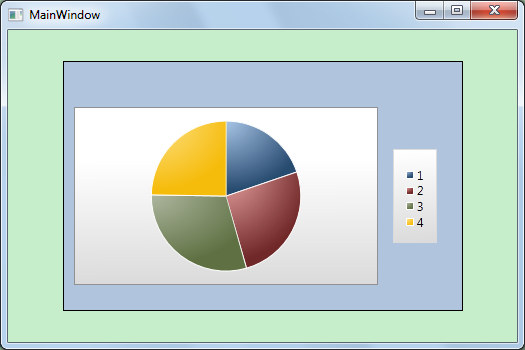


 1265
1265

 被折叠的 条评论
为什么被折叠?
被折叠的 条评论
为什么被折叠?
 到【灌水乐园】发言


