


大家好,我是执念斩长河。最近在学习python绘图。遇到一个“2018年、2019年物流行业的快递业务量”画图问题。在刚开始接触此题时,有点心慌意乱,上网查阅资料发现,题目原来这么简单。
文章目录
1.题目再现
表:2018年、2019年物流行业的快递业务量
| 月份 | 2018年业务量 | 2019年业务量 |
|---|---|---|
| 1月 | 39 | 45 |
| 2月 | 20 | 28 |
| 3月 | 40 | 48 |
| 4月 | 38 | 49 |
| 5月 | 42 | 50 |
| 6月 | 43 | 51 |
| 7月 | 41 | 50 |
| 8月 | 41 | 50 |
| 9月 | 45 | 51 |
| 10月 | 48 | 52 |
| 11月 | 52 | 70 |
| 12月 | 50 | 65 |
根据表的数据绘制图表,具体要求如下.
- 绘制反映2018年、2019年快递业务量趋势的折线图
- 折线图的x轴为月份;y轴为业务量,y轴的标签为"业务量(亿件)"
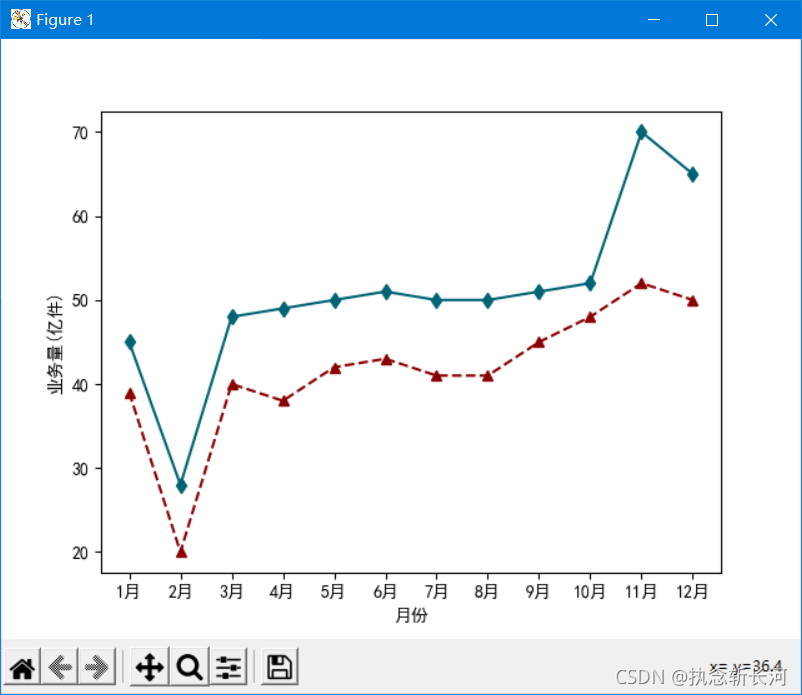
- 代表2018年折线样式:颜色为"#8B0000",标记为正三角形,线型为长虚线,线宽为1.5
- 代表2019年的折线样式:颜色“#006374”,标记为长菱形,线型为实线,线宽为1.5
- 折线图的主题风格切换为"fivethirtyeight"
代码效果:
2.题目拆解
首先明确是折线图
2.1 折线图什么命令
折线图就是直接plot,那么幻化成python语句又是什么呢?
import matplotlib.pyplot as plt
plt.plot(..........)
就是这个
2.2 x轴为月份,y轴为业务量,也要设置标签,咋整?
题目进行拆解,x轴为月份,y轴为业务量,这是明确x轴代表啥,y代表啥,也莫慌,这是xlabel,ylabel设置,改成python语句是这样子的。
fig = plt.figure()
ax = fig.add_subplot(111)
# 绘制具有不同线条样式的折线图
ax.set_ylabel('业务量(亿件)')
ax.set_xlabel('月份')
ax.set_xticks(np.arange(0,len(sale_a)+1))
ax.set_xticklabels([str(i) +'月' for i in range(1,13)])
2.3 2018年业务,长实线,颜色,线宽,正三角形
长实线是指一种风格叫做linestyle,颜色是color,线宽是linewidth,正三角形markcolor。语句为
ax.plot(sale_a, '--',marker='^',color='#8B0000',linewidth=1.5)
2.4 2019年业务,实线,长菱形,线宽,颜色
同理也是这几个选项,主要的难点在于,实线是指:linestyle=’-’,长菱形是markcolor=‘d’,线宽linewidth=1.5,颜色是color
ax.plot(sale_b,'-',marker='d',color='#006374',linewidth=1.5)
2.5 折线图主题风格 “fivethirtyeight”
主题风格在于matplotlib的一个库里,如果不仔细研究,根本不知道.
import matplotlib.style as ms
ms.use('fivethirtyeight')
3 完整代码
import numpy as np
import matplotlib.pyplot as plt
import matplotlib.style as ms

plt.rcParams["font.sans-serif"] = ["SimHei"]
plt.rcParams["axes.unicode_minus"] = False
sale_a = [39, 20, 40, 38, 42, 43, 41, 41, 45, 48, 52, 50]
sale_b = [45, 28, 48, 49, 50, 51, 50, 50, 51, 52, 70, 65]

fig = plt.figure()
ax = fig.add_subplot(111)
# 绘制具有不同线条样式的折线图
ax.plot(sale_a, '--', marker='^', color='#8B0000', linewidth=1.5)
ax.plot(sale_b, '-', marker='d', color='#006374', linewidth=1.5)
ax.set_ylabel('业务量(亿件)')
ax.set_xlabel('月份')
ax.set_xticks(np.arange(0, len(sale_a) ))
stringA = [str(i) + '月' for i in range(1,13)]
ax.set_xticklabels(stringA)
ms.use('fivethirtyeight')
plt.show()


 1616
1616

 被折叠的 条评论
为什么被折叠?
被折叠的 条评论
为什么被折叠?
 到【灌水乐园】发言


