


# 昨日知识点回顾
分析CSV文件头报错误,原因是自建doc文件,输入内容改后缀生成的CSV文件
下载CSV文件链接:sitka_weather_07-2018_simple.csv等文件网盘链接免费下载_temps.csv下载-CSDN博客![]() https://blog.csdn.net/Xx_Studying/article/details/121376020 切换文件后成功运行
https://blog.csdn.net/Xx_Studying/article/details/121376020 切换文件后成功运行
import csv

filename = 'D:/Program Files/JetBrains/jetbra/scripts/sitka_weather_07-2018_simple.csv'
with open(filename) as f:
    reader = csv.reader(f)
    header_row = next(reader)

    print(header_row)

# 运行结果:['STATION', 'NAME', 'DATE', 'PRCP', 'TAVG', 'TMAX', 'TMIN']
# 今日知识点学习
16.1.2 打印文件头及其位置
import csv

filename = 'D:/Program Files/JetBrains/jetbra/scripts/sitka_weather_07-2018_simple.csv'
with open(filename) as f:
    reader = csv.reader(f)
    header_row = next(reader)

    #enumerate()函数获取每个元素的索引及其值
    for index, coumn_header in enumerate(header_row):
        print(index, coumn_header)

# 运行结果:
# 0 STATION
# 1 NAME
# 2 DATE
# 3 PRCP
# 4 TAVG
# 5 TMAX
# 6 TMIN
16.1.3 提取并读取数据
import csv

filename = 'D:/Program Files/JetBrains/jetbra/scripts/sitka_weather_07-2018_simple.csv'
with open(filename) as f:
    reader = csv.reader(f)
    header_row = next(reader)

    # 从文件中获取最高温度
    highs = []
    for row in reader:
        high = int(row[5])
        highs.append(high)

    print(highs)

# 运行结果:
# [62, 58, 70, 70, 67, 59, 58, 62, 66, 59, 56, 63, 65, 58, 56, 59, 64, 60, 60, 61, 65, 65, 63, 59, 64, 65, 68, 66, 64, 67, 65]
16.1.4 绘制温度图表
import csv
import matplotlib.pyplot as plt
import matplotlib
matplotlib.use('TkAgg')

filename = 'D:/Program Files/JetBrains/jetbra/scripts/sitka_weather_07-2018_simple.csv'
with open(filename) as f:
    reader = csv.reader(f)
    header_row = next(reader)

    highs = []
    for row in reader:
        high = int(row[5])
        highs.append(high)

    # 根据最高温度绘制图形
    plt.style.use('seaborn-v0_8')
    fig, ax = plt.subplots()
    ax.plot(highs, c='red')

    # 设置图形的格式
    ax.set_title("2018年7月每日最高温度", fontsize=24)
    ax.set_xlabel('', fontsize=16)
    ax.set_ylabel("温度(F)", fontsize=16)
    ax.tick_params(axis='both', which='major', labelsize=16)

    plt.show()
运行结果:

16.1.5 模块datetime
终端运行:strptime()函数可接受各种实参
>>> from datetime import datetime
>>> first_date = datetime.strptime('2018-07-01','%Y-%m-%d')
>>> print(first_date)
2018-07-01 00:00:00
16.1.6 在图表中添加日期
import csv
from datetime import datetime
import matplotlib.pyplot as plt
import matplotlib
matplotlib.use('TkAgg')

filename = 'D:/Program Files/JetBrains/jetbra/scripts/sitka_weather_07-2018_simple.csv'
with open(filename) as f:
    reader = csv.reader(f)
    header_row = next(reader)

    # 从文件中获取日期和最高温度
    dates, highs = [], []
    for row in reader:
        current_date = datetime.strptime(row[2], '%Y-%m-%d')
        high = int(row[5])
        dates.append(current_date)
        highs.append(high)

    # 根据最高温度绘制图形
    plt.style.use('seaborn-v0_8')
    fig, ax = plt.subplots()
    ax.plot(dates, highs, c='red')

    # 设置图形的格式
    ax.set_title("2018年7月每日最高温度", fontsize=24)
    ax.set_xlabel('', fontsize=16)
    # 绘制倾斜的标签
    fig.autofmt_xdate()
    ax.set_ylabel("温度(F)", fontsize=16)
    ax.tick_params(axis='both', which='major', labelsize=16)

    plt.show()
运行结果:

16.1.7 涵盖更长的时间
import csv
from datetime import datetime
import matplotlib.pyplot as plt
import matplotlib
matplotlib.use('TkAgg')

filename = 'D:/Program Files/JetBrains/jetbra/scripts/sitka_weather_2018_simple.csv'
with open(filename) as f:
    reader = csv.reader(f)
    header_row = next(reader)

    # 从文件中获取日期和最高温度
    dates, highs = [], []
    for row in reader:
        current_date = datetime.strptime(row[2], '%Y-%m-%d')
        high = int(row[5])
        dates.append(current_date)
        highs.append(high)

    # 根据最高温度绘制图形
    plt.style.use('seaborn-v0_8')
    fig, ax = plt.subplots()
    ax.plot(dates, highs, c='red')

    # 设置图形的格式
    ax.set_title("2018年每日最高温度", fontsize=24)
    ax.set_xlabel('', fontsize=16)
    # 绘制倾斜的标签
    fig.autofmt_xdate()
    ax.set_ylabel("温度(F)", fontsize=16)
    ax.tick_params(axis='both', which='major', labelsize=16)

    plt.show()
运行结果: 
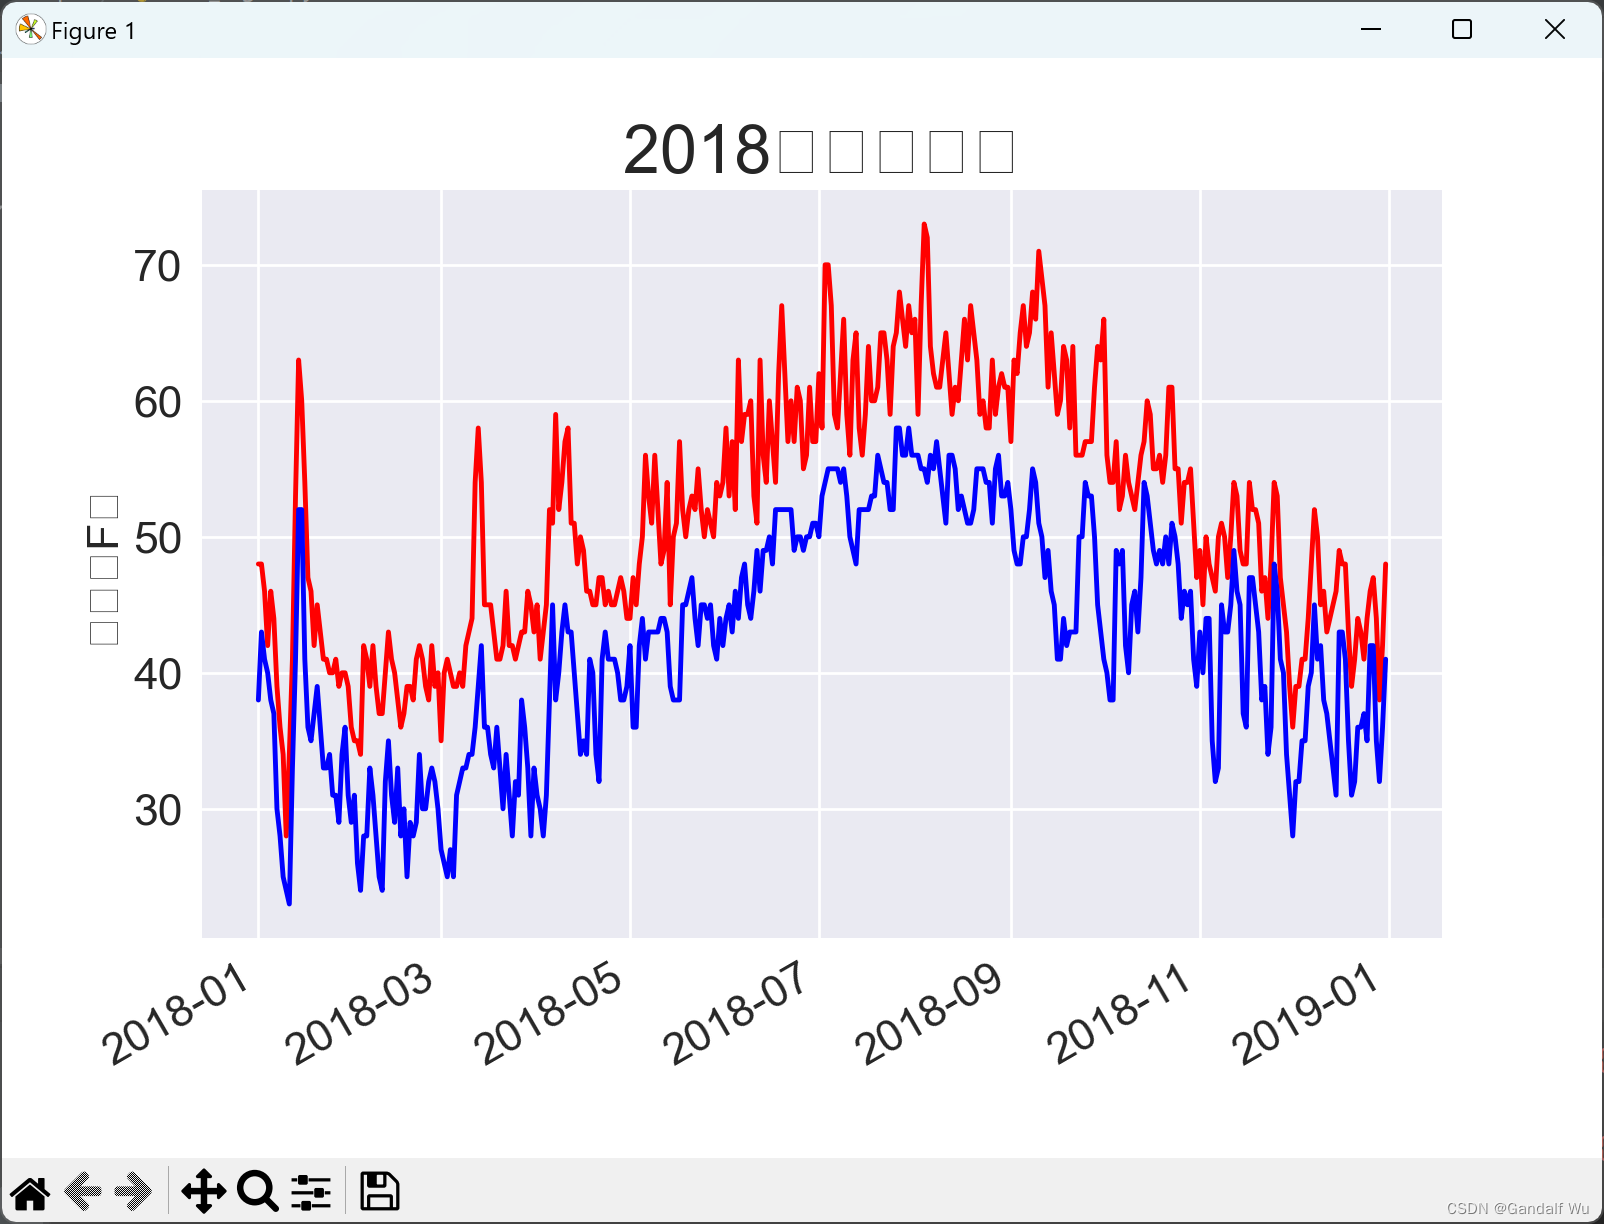
16.1.8 再绘制一个数据系列
import csv
from datetime import datetime
import matplotlib.pyplot as plt
import matplotlib
matplotlib.use('TkAgg')

filename = 'D:/Program Files/JetBrains/jetbra/scripts/sitka_weather_2018_simple.csv'
with open(filename) as f:
    reader = csv.reader(f)
    header_row = next(reader)

    # 从文件中获取日期、最高温度和最低温度
    dates, highs, lows = [], [], []
    for row in reader:
        current_date = datetime.strptime(row[2], '%Y-%m-%d')
        high = int(row[5])
        low = int(row[6])
        dates.append(current_date)
        highs.append(high)
        lows.append(low)

    # 根据最高温度和最低温度绘制图形
    plt.style.use('seaborn-v0_8')
    fig, ax = plt.subplots()
    ax.plot(dates, highs, c='red')
    ax.plot(dates, lows, c='blue')

    # 设置图形的格式
    ax.set_title("2018年每日温度", fontsize=24)
    ax.set_xlabel('', fontsize=16)
    # 绘制倾斜的标签
    fig.autofmt_xdate()
    ax.set_ylabel("温度(F)", fontsize=16)
    ax.tick_params(axis='both', which='major', labelsize=16)

    plt.show()
运行结果:
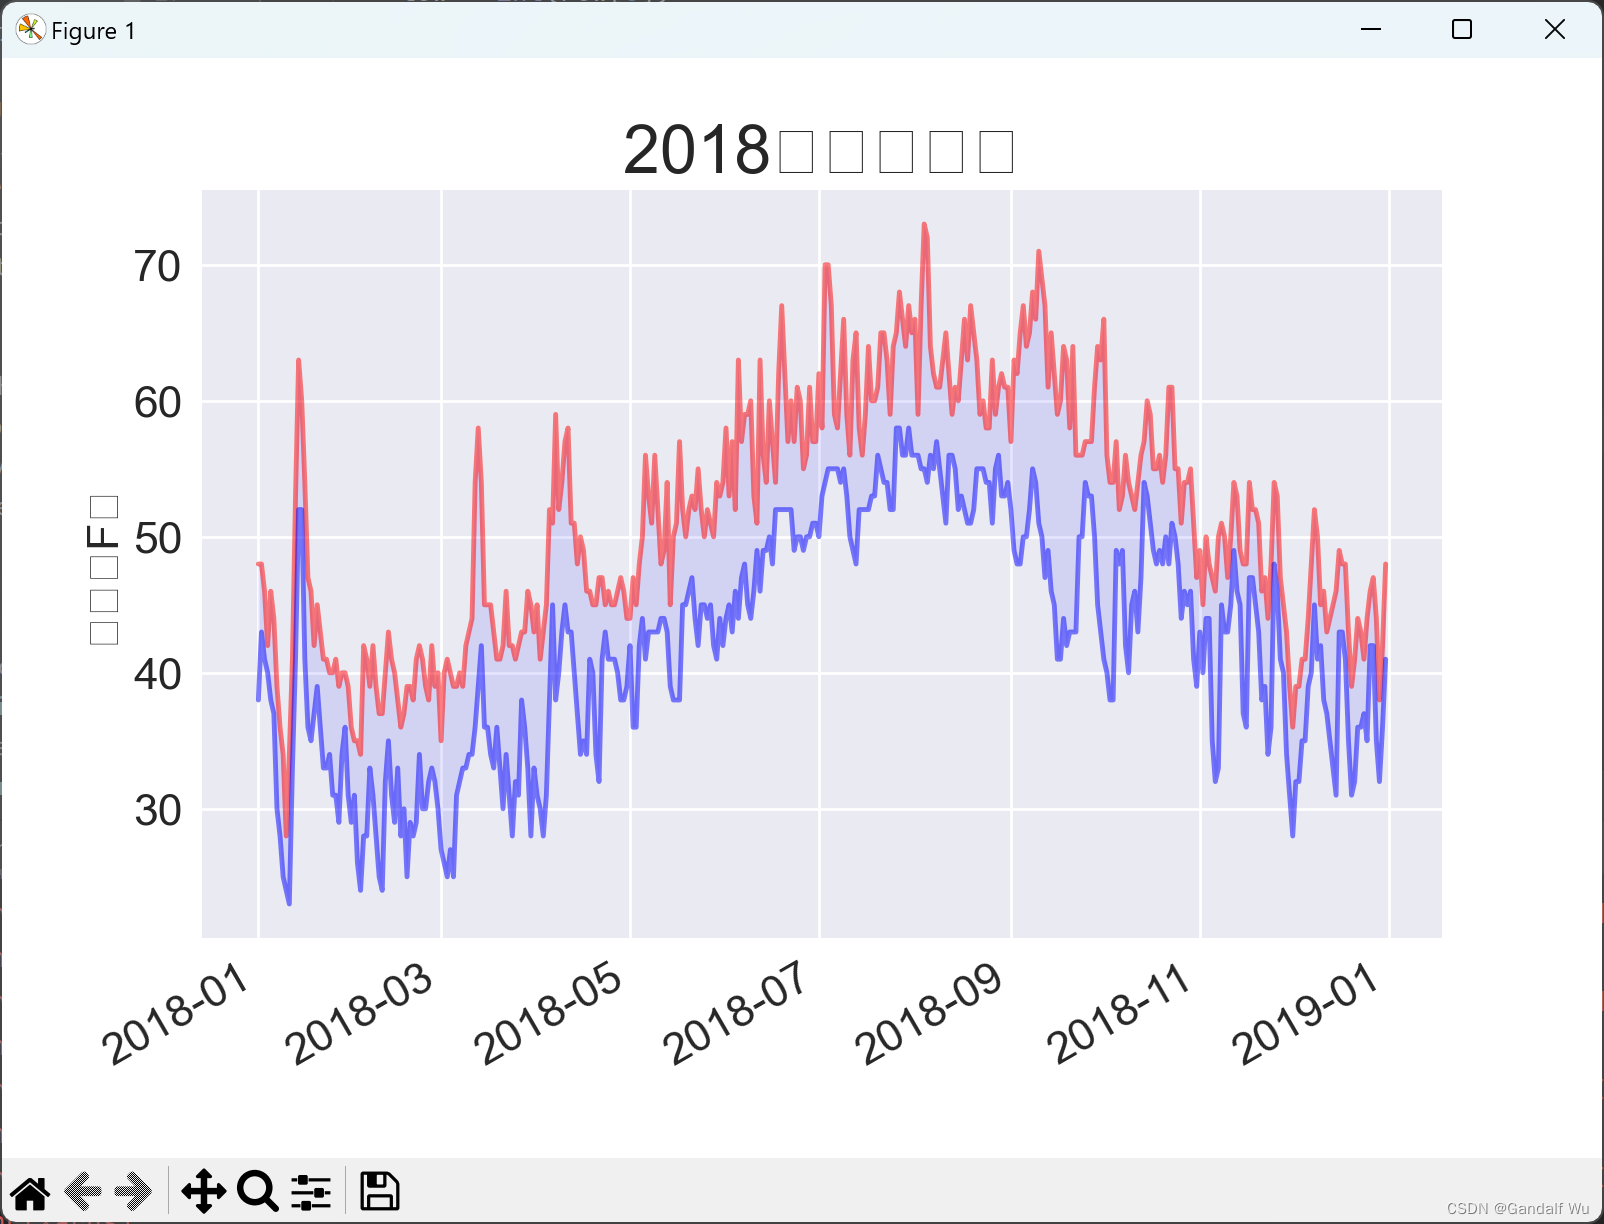
16.1.9 给图表区域着色
---snip---
# 根据最高温度和最低温度绘制图形
    plt.style.use('seaborn-v0_8')
    fig, ax = plt.subplots()
    # 实参alpha指定颜色透明度,0表示完全透明,1表示完全不透明
    ax.plot(dates, highs, c='red', alpha=0.5)
    ax.plot(dates, lows, c='blue', alpha=0.5)
    ax.fill_between(dates, highs, lows, facecolor='blue', alpha=0.1)
---snip---
运行结果:
16.1.10 错误检查
import csv

filename = 'D:/Program Files/JetBrains/jetbra/scripts/death_valley_2018_simple.csv'
with open(filename) as f:
    reader = csv.reader(f)
    header_row = next(reader)

    # enumerate()函数获取每个元素的索引及其值
    for index, coumn_header in enumerate(header_row):
        print(index, coumn_header)

#运行结果:
# 0 STATION
# 1 NAME
# 2 DATE
# 3 PRCP
# 4 TMAX
# 5 TMIN
# 6 TOBS
import csv
from datetime import datetime
import matplotlib.pyplot as plt
import matplotlib
matplotlib.use('TkAgg')
filename = 'D:/Program Files/JetBrains/jetbra/scripts/death_valley_2018_simple.csv'
with open(filename) as f:
reader = csv.reader(f)
header_row = next(reader)
# 从文件中获取日期、最高温度和最低温度
dates, highs, lows = [], [], []
for row in reader:
current_date = datetime.strptime(row[2], '%Y-%m-%d')
high = int(row[4])
low = int(row[5])
dates.append(current_date)
highs.append(high)
lows.append(low)
# 根据最高温度和最低温度绘制图形
plt.style.use('seaborn-v0_8')
fig, ax = plt.subplots()
# 实参alpha指定颜色透明度,0表示完全透明,1表示完全不透明
ax.plot(dates, highs, c='red', alpha=0.5)
ax.plot(dates, lows, c='blue', alpha=0.5)
ax.fill_between(dates, highs, lows, facecolor='blue', alpha=0.1)
# 设置图形的格式
ax.set_title("2018年每日温度", fontsize=24)
ax.set_xlabel('', fontsize=16)
# 绘制倾斜的标签
fig.autofmt_xdate()
ax.set_ylabel("温度(F)", fontsize=16)
ax.tick_params(axis='both', which='major', labelsize=16)
plt.show()
# 运行结果:
# Traceback (most recent call last):
# File "D:\Program Files\JetBrains\jetbra\scripts\death_valley_highs_lows.py", line 16, in <module>
# high = int(row[4])
# ^^^^^^^^^^^
# ValueError: invalid literal for int() with base 10: ''无法处理其中某一天的最高温度,因为无法将空字符串(' ')转换为整数
处理异常:
import csv
from datetime import datetime
import matplotlib.pyplot as plt
import matplotlib
matplotlib.use('TkAgg')


filename = 'D:/Program Files/JetBrains/jetbra/scripts/death_valley_2018_simple.csv'
with open(filename) as f:
    reader = csv.reader(f)
    header_row = next(reader)

    # 从文件中获取日期、最高温度和最低温度
    dates, highs, lows = [], [], []
    for row in reader:
        current_date = datetime.strptime(row[2], '%Y-%m-%d')
        try:
            high = int(row[4])
            low = int(row[5])
        except ValueError:
            print(f"Missing date for {current_date}")
        else:
            dates.append(current_date)
            highs.append(high)
            lows.append(low)

    # 根据最高温度和最低温度绘制图形
    plt.style.use('seaborn-v0_8')
    fig, ax = plt.subplots()
    # 实参alpha指定颜色透明度,0表示完全透明,1表示完全不透明
    ax.plot(dates, highs, c='red', alpha=0.5)
    ax.plot(dates, lows, c='blue', alpha=0.5)
    ax.fill_between(dates, highs, lows, facecolor='blue', alpha=0.1)

    # 设置图形的格式
    title = "2018年每日最高温度和最低温度\n 美国加利福尼亚州死亡谷"
    ax.set_title(title, fontsize=20)
    ax.set_xlabel('', fontsize=16)
    # 绘制倾斜的标签
    fig.autofmt_xdate()
    ax.set_ylabel("温度(F)", fontsize=16)
    ax.tick_params(axis='both', which='major', labelsize=16)

    plt.show()

# 运行结果:
# Missing date for 2018-02-18 00:00:00
图表显示结果:

16.1.11 自己动手下载数据
NOAA网址:Hourly/Sub-Hourly Observational Data (noaa.gov)NOAA网站气象台站数据下载教程_noaa数据下载-CSDN博客![]() https://blog.csdn.net/qq_39855224/article/details/112149945
https://blog.csdn.net/qq_39855224/article/details/112149945


 2089
2089


 被折叠的 条评论
为什么被折叠?
被折叠的 条评论
为什么被折叠?
 到【灌水乐园】发言


