


# 昨日知识点回顾
scatter()函数绘制点、线
改变显示颜色
savefig()自动保存图表
# 今日知识点学习
15.3 随机漫步
每次行走都是随机没有明确方向的
15.3.1 创建RandomWalk()类
from random import choice


class RandomWalk():
    """一个生成随机漫步数据的类"""

    def __init__(self, num_points=5000):
        """初始化随机漫步的属性"""
        self.num_points = num_points

        # 所有随机漫步都始于(0,0)
        self.x_values = [0]
        self.y_values = [0]
15.3.2 选择方向
from random import choice


class RandomWalk():
    """一个生成随机漫步数据的类"""

    def __init__(self, num_points=5000):
        """初始化随机漫步的属性"""
        self.num_points = num_points

        # 所有随机漫步都始于(0,0)
        self.x_values = [0]
        self.y_values = [0]

    def fill_walk(self):
        """计算随机漫步包含的所有点"""
        # 不断漫步,直到列表达到指定的长度
        while len(self.x_values) < self.num_points:
            # 决定前进方向以及沿这个方向前进的距离
            x_direction = choice([1, -1])
            x_distance = choice([0, 1, 2, 3, 4])
            x_step = x_direction * x_distance

            y_direction = choice([1, -1])
            y_distance = choice([0, 1, 2, 3, 4])
            y_step = y_direction * y_distance

            # 拒绝原地踏步
            if x_step == 0 and y_step == 0:
                continue

            # 计算下一个点的x和y值
            next_x = self.x_values[-1] + x_step
            next_y = self.y_values[-1] + y_step

            self.x_values.append(next_x)
            self.y_values.append(next_y)
15.3.3 绘制随机漫步图
# rw_visual.py
import matplotlib.pyplot as plt
import matplotlib
matplotlib.use('TkAgg')
from random_walk import RandomWalk
# 创建一个RandomWalk实例,并将其包含的点都绘制出来
rw = RandomWalk()
rw.fill_walk()
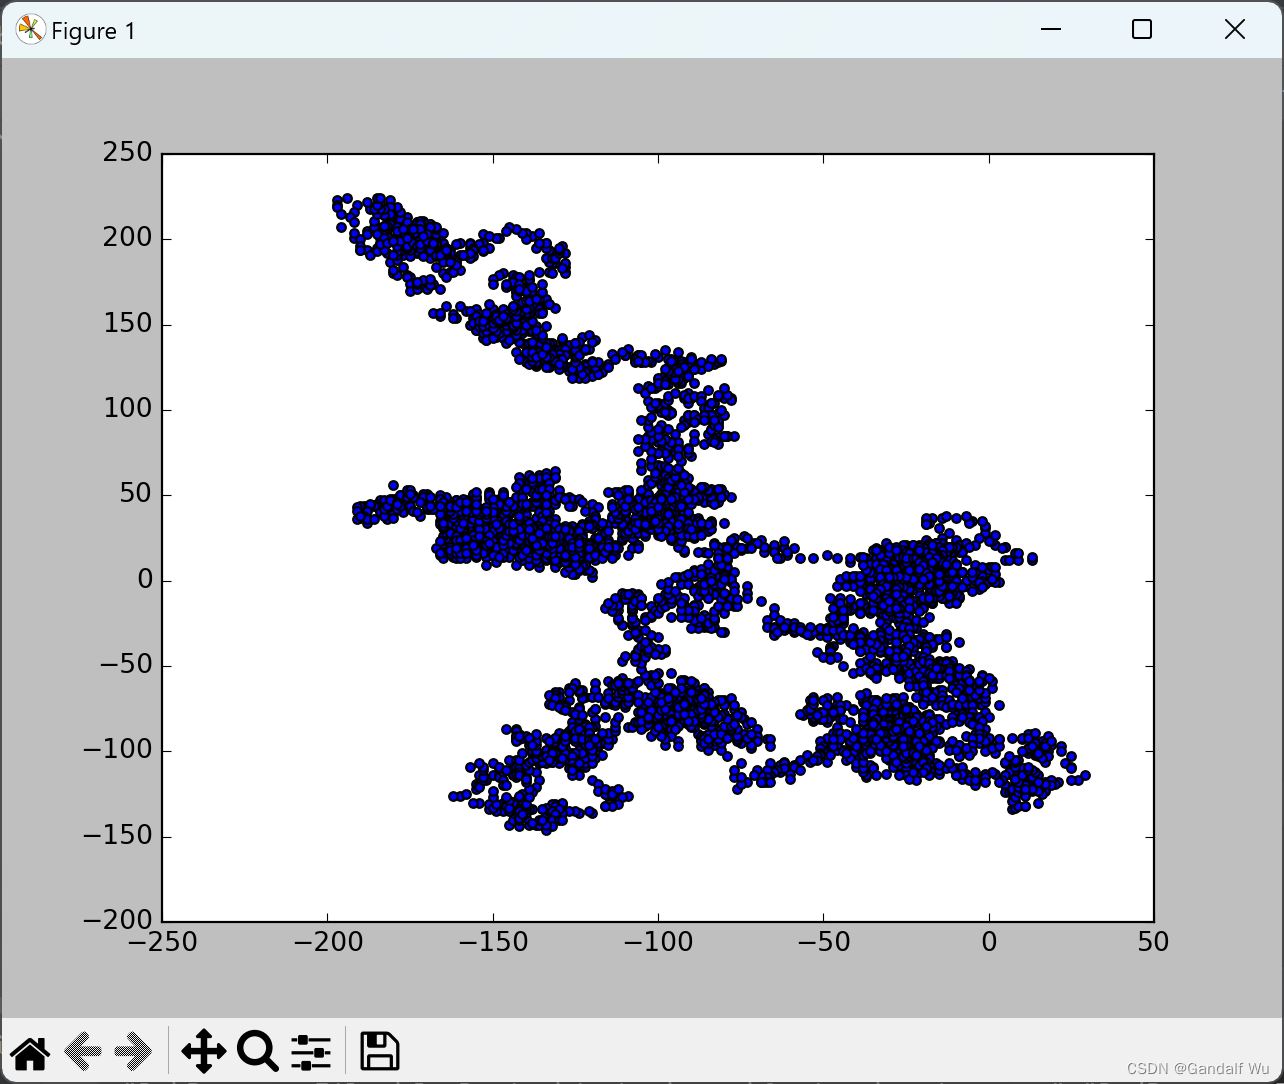
plt.scatter(rw.x_values, rw.y_values, s=15)
plt.show()运行结果:

15.3.4 模拟多次随机漫步
from random_walk import RandomWalk
import matplotlib.pyplot as plt
import matplotlib
matplotlib.use('TkAgg')

# 只要程序处于活动状态,就不断地模拟随机漫步
while True:
    # 创建一个RandomWalk实例,并将其包含的点都绘制出来
    rw = RandomWalk()
    rw.fill_walk()
    plt.style.use('classic')
    fig, ax = plt.subplots()
    ax.scatter(rw.x_values, rw.y_values, s=15)

    plt.show()
    keep_running = input('Make another walk?(y/n)')
    if keep_running == 'n':
        break

# 运行结果:
# Make another walk?(y/n)y
# Make another walk?(y/n)n

# 进程已结束,退出代码0
运行结果:
15.3.5 设置随机漫步图的样式
1. 给点着色
from random_walk import RandomWalk
import matplotlib.pyplot as plt
import matplotlib
matplotlib.use('TkAgg')

# 只要程序处于活动状态,就不断地模拟随机漫步
while True:
    # 创建一个RandomWalk实例,并将其包含的点都绘制出来
    rw = RandomWalk()
    rw.fill_walk()
    plt.style.use('classic')
    fig, ax = plt.subplots()
    point_numbers = range(rw.num_points)
    ax.scatter(rw.x_values, rw.y_values, c=point_numbers, cmap=plt.cm.Blues, edgecolors='None', s=15)

    plt.show()
    keep_running = input('Make another walk?(y/n)')
    if keep_running == 'n':
        break
运行结果:

2. 重新绘制起点和终点
from random_walk import RandomWalk
import matplotlib.pyplot as plt
import matplotlib
matplotlib.use('TkAgg')
# 只要程序处于活动状态,就不断地模拟随机漫步
while True:
# 创建一个RandomWalk实例,并将其包含的点都绘制出来
rw = RandomWalk()
rw.fill_walk()
plt.style.use('classic')
fig, ax = plt.subplots()
point_numbers = range(rw.num_points)
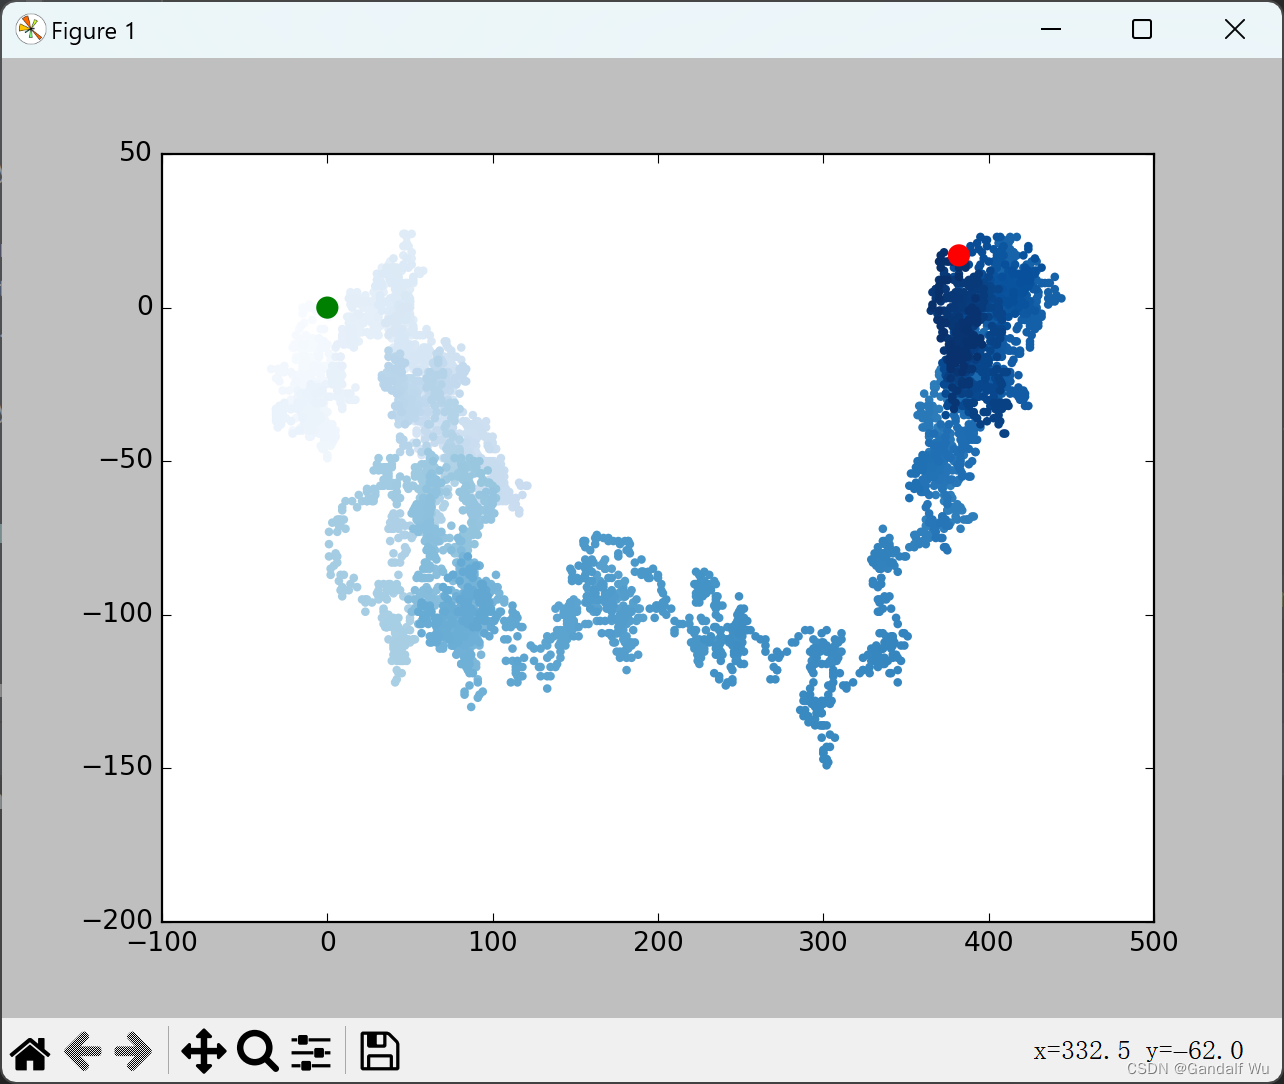
ax.scatter(rw.x_values, rw.y_values, c=point_numbers, cmap=plt.cm.Blues, edgecolors='None', s=15)
# 突出起点和终点
ax.scatter(0, 0, c='green', edgecolors='none', s=100)
ax.scatter(rw.x_values[-1], rw.y_values[-1], c='red', edgecolor='none', s=100)
plt.show()
keep_running = input('Make another walk?(y/n)')
if keep_running == 'n':
break运行结果:
3. 隐藏坐标轴
---snip---
# 隐藏坐标轴
    ax.get_xaxis().set_visible(False)
    ax.get_yaxis().set_visible(False)
---snip---
运行结果:
 4.增加点数
from random_walk import RandomWalk
import matplotlib.pyplot as plt
import matplotlib
matplotlib.use('TkAgg')

# 只要程序处于活动状态,就不断地模拟随机漫步
while True:
    # 创建一个RandomWalk实例,并将其包含的点都绘制出来
    rw = RandomWalk(50_000)
    rw.fill_walk()
    # 将所有点绘制出来
    plt.style.use('classic')
    fig, ax = plt.subplots()
    point_numbers = range(rw.num_points)
    ax.scatter(rw.x_values, rw.y_values, c=point_numbers, cmap=plt.cm.Blues, edgecolors='None', s=1)

    # 突出起点和终点
    ax.scatter(0, 0, c='green', edgecolors='none', s=100)
    ax.scatter(rw.x_values[-1], rw.y_values[-1], c='red', edgecolor='none', s=100)

    # 隐藏坐标轴
    ax.get_xaxis().set_visible(False)
    ax.get_yaxis().set_visible(False)

    plt.show()
    keep_running = input('Make another walk?(y/n)')
    if keep_running == 'n':
        break
运行结果:(每个点的大小设置为1,一共50000个点)
 5. 调整尺寸以适合屏幕
from random_walk import RandomWalk
import matplotlib.pyplot as plt
import matplotlib
matplotlib.use('TkAgg')

# 只要程序处于活动状态,就不断地模拟随机漫步
while True:
    # 创建一个RandomWalk实例,并将其包含的点都绘制出来
    rw = RandomWalk(50_000)
    rw.fill_walk()
    # 将所有点绘制出来
    plt.style.use('classic')
    fig, ax = plt.subplots(figsize=(10,6), dpi=128)
    point_numbers = range(rw.num_points)
    ax.scatter(rw.x_values, rw.y_values, c=point_numbers, cmap=plt.cm.Blues, edgecolors='None', s=1)

    # 突出起点和终点
    ax.scatter(0, 0, c='green', edgecolors='none', s=100)
    ax.scatter(rw.x_values[-1], rw.y_values[-1], c='red', edgecolor='none', s=100)

    # 隐藏坐标轴
    ax.get_xaxis().set_visible(False)
    ax.get_yaxis().set_visible(False)

    plt.show()
    keep_running = input('Make another walk?(y/n)')
    if keep_running == 'n':
        break
运行结果:

15.4 使用Plotly模拟掷骰子
15.4.1 安装Plotly

15.4.2 创建Die类
# die.py
from random import randint


class Die:
    """表示一个骰子的类"""

    def __init__(self, num_sides=6):
        """骰子默认为6面"""
        self.num_sides = num_sides

    def roll(self):
        """返回一个位于1和骰子面数之间的随机值"""
        return randint(1, self.num_sides)
15.4.3 掷骰子
# die_visual.py
from die import Die

# 创建一个D6
die = Die()

# 掷几次骰子并将结果存储在一个列表中
results = []
for roll_num in range(100):
    result = die.roll()
    results.append(result)

print(results)

# 运行结果:
# [3, 6, 6, 2, 1, 3, 1, 1, 2, 3, 4, 3, 3, 1, 5, 1, 3, 3, 6, 6, 2, 1, 2, 4, 5, 2, 6, 1, 1, 2, 4, 4, 3, 1, 1, 5, 3, 2, 5, 2, 2, 1, 6, 4, 1, 5, 6, 6, 1, 6, 4, 3, 3, 5, 2, 6, 5, 2, 6, 1, 2, 3, 6, 3, 6, 6, 2, 3, 1, 5, 2, 5, 6, 5, 4, 4, 2, 3, 1, 2, 5, 5, 2, 4, 4, 5, 6, 3, 3, 3, 5, 1, 6, 5, 3, 1, 1, 3, 1, 3]
15.4.4 分析结果
# die_visual.py
from die import Die

# 创建一个D6
die = Die()

# 掷几次骰子并将结果存储在一个列表中
results = []
for roll_num in range(1000):
    result = die.roll()
    results.append(result)

# 分析结果
frequencies = []
for value in range(1, die.num_sides+1):
    frequency = results.count(value)
    frequencies.append(frequency)

print(frequencies)

# 运行结果:
# [178, 163, 178, 149, 175, 157]
15.4.5 绘制直方图
# die_visual.py
from plotly.graph_objs import Bar, Layout
from plotly import offline
from die import Die
# 创建一个D6
die = Die()
# 掷几次骰子并将结果存储在一个列表中
results = []
for roll_num in range(1000):
result = die.roll()
results.append(result)
# 分析结果
frequencies = []
for value in range(1, die.num_sides+1):
frequency = results.count(value)
frequencies.append(frequency)
print(frequencies)
# 对结果进行可视化
x_values = list(range(1, die.num_sides+1))
# 可能出现的点数存储在x_values中,Plotly不能接受函数range()的结果
data = [Bar(x=x_values, y=frequencies)]
# Plotly类Bar()必须放在方括号内,该数据集包含(x,y)等多个元素
x_axis_config = {'title': '结果'}
y_axis_config = {'title': '结果的频率'}
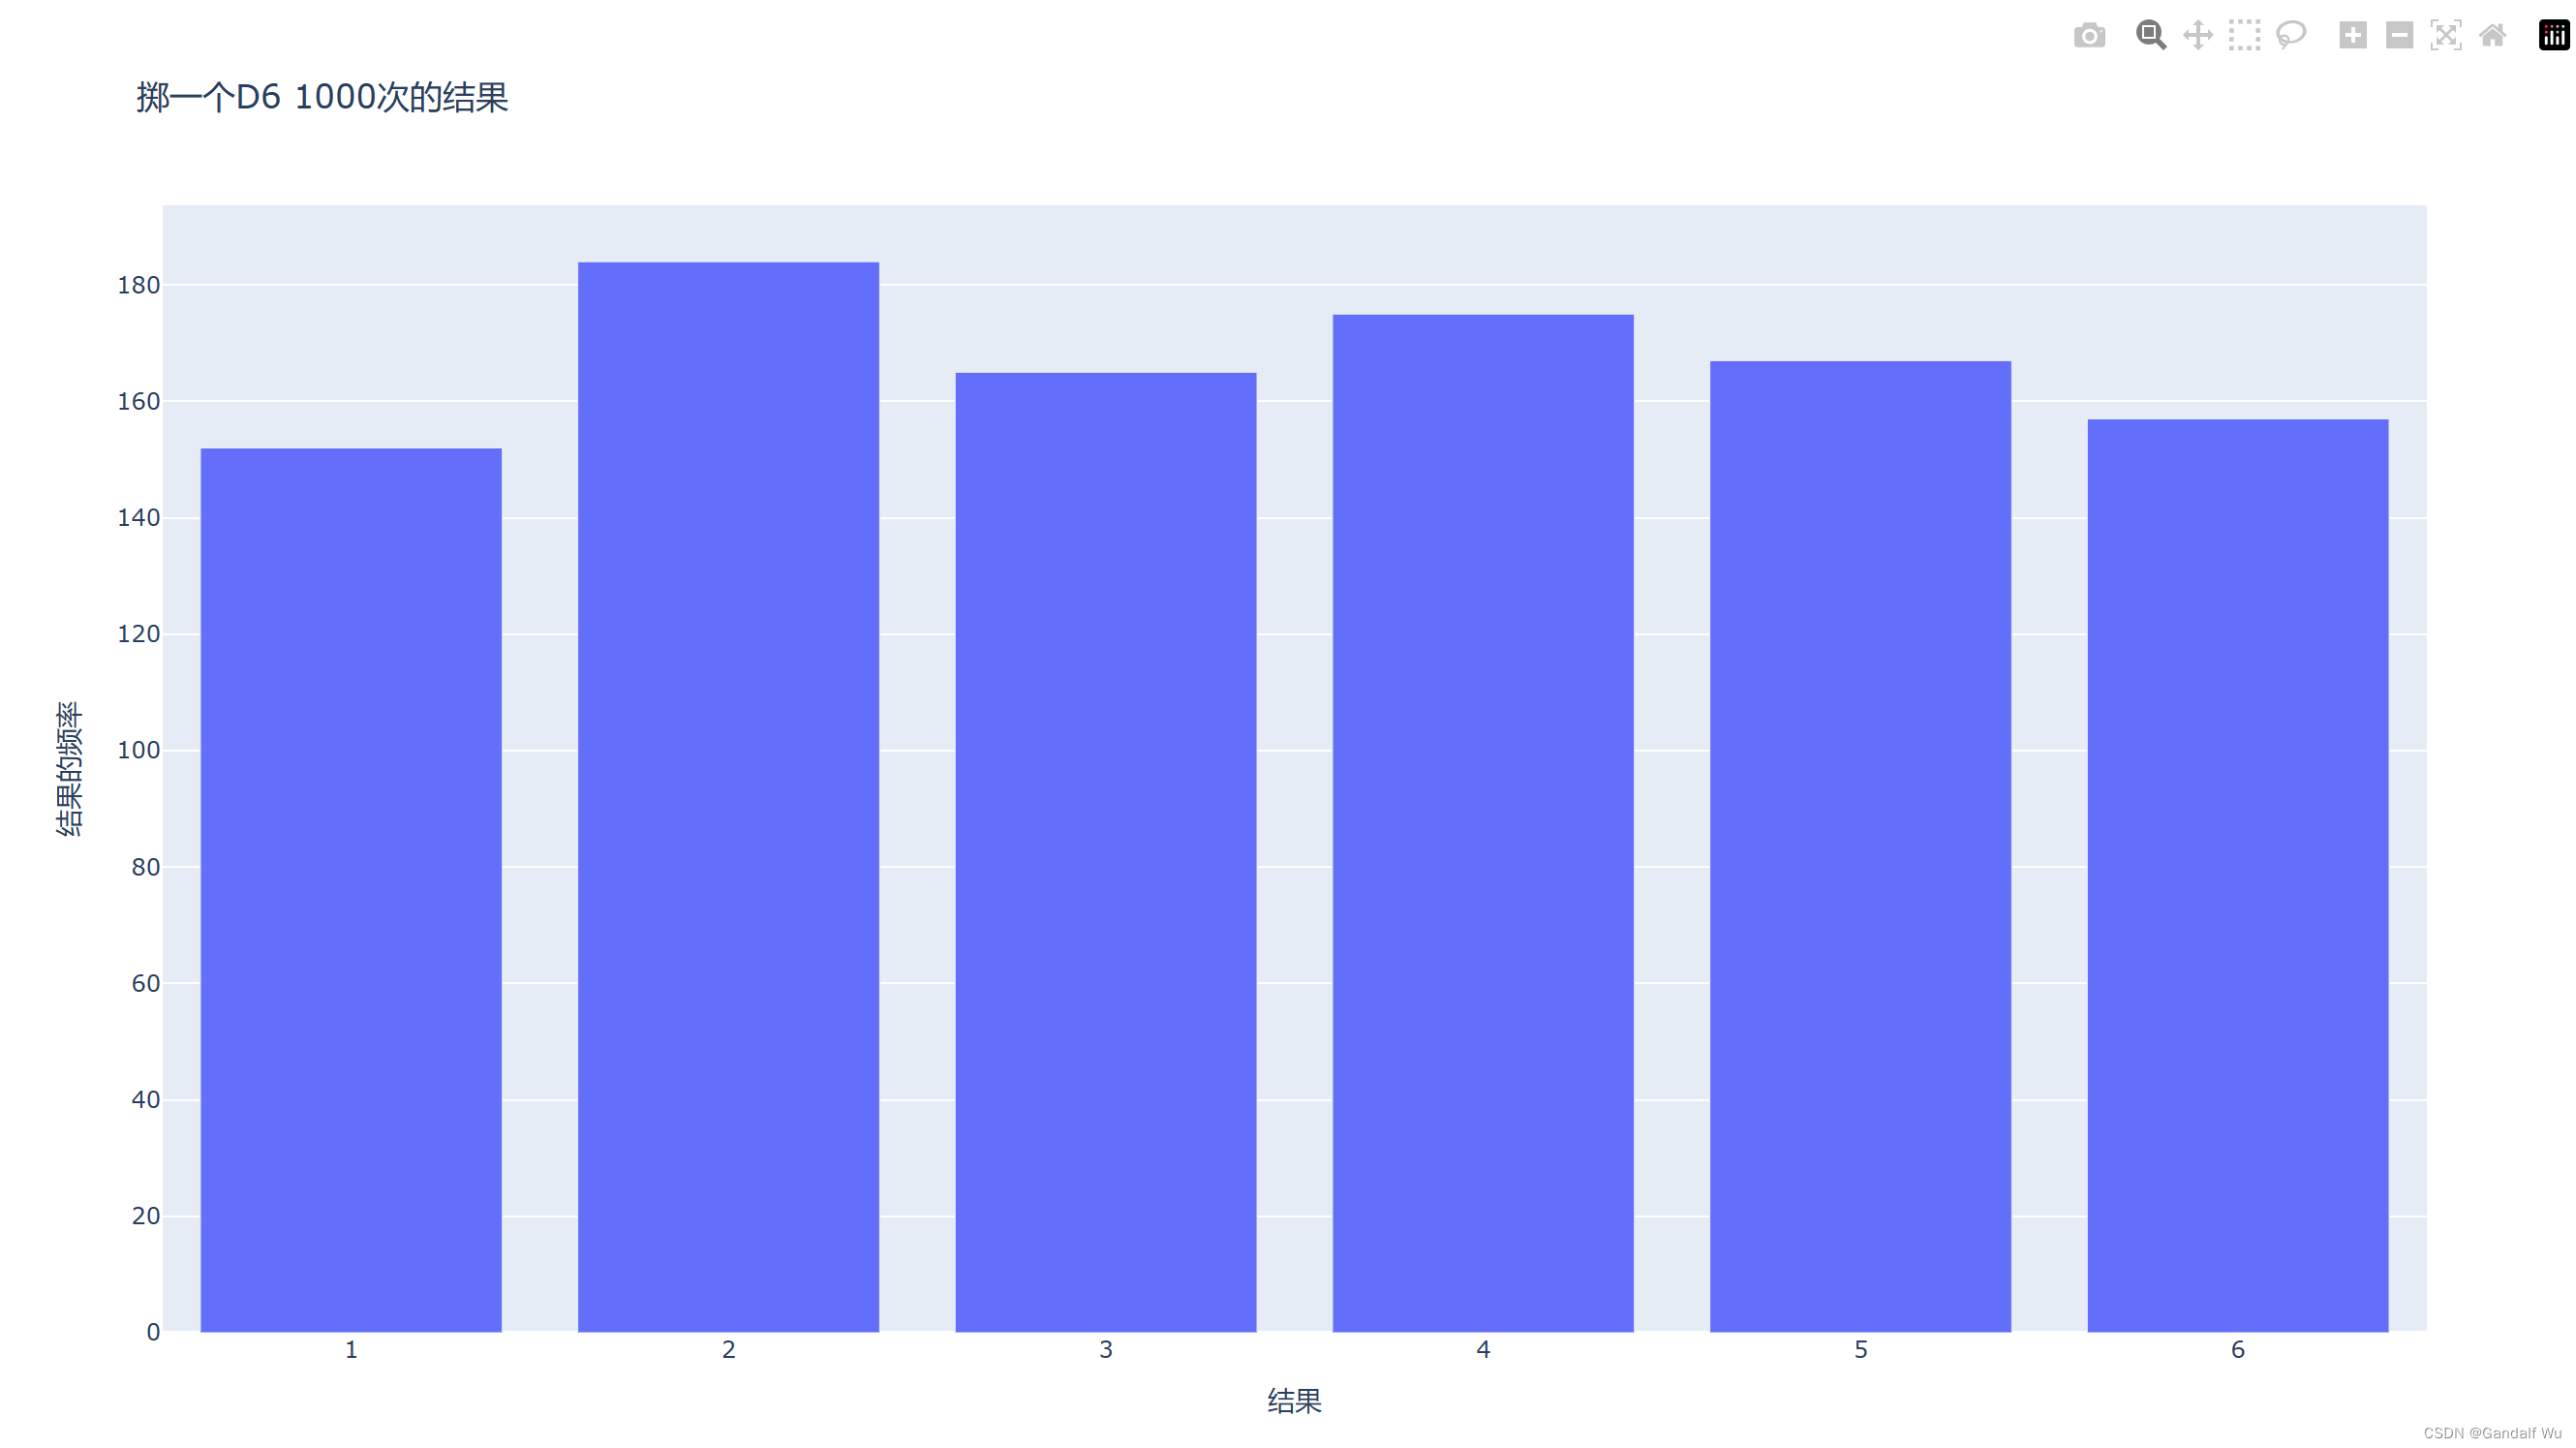
my_layout = Layout(title='掷一个D6 1000次的结果', xaxis=x_axis_config, yaxis=y_axis_config)
# 类Layout()返回图表布局和配置的对象
offline.plot({'data': data, 'layout': my_layout}, filename='d6.html')
# 类offline.plot()包含数据和布局对象的字典,另外接受一个文件名运行结果:
15.4.6 同时掷两个骰子
from plotly.graph_objs import Bar, Layout
from plotly import offline
from die import Die
# 创建两个D6
die_1 = Die()
die_2 = Die()
# 掷几次骰子并将结果存储在一个列表中
results = []
for roll_num in range(1000):
result = die_1.roll() + die_2.roll()
results.append(result)
# 分析结果
frequencies = []
max_result = die_1.num_sides + die_2.num_sides
for value in range(2, max_result+1):
frequency = results.count(value)
frequencies.append(frequency)
# print(frequencies)
# 可视化结果
x_values = list(range(2, max_result+1))
# 可能出现的点数存储在x_values中,Plotly不能接受函数range()的结果
data = [Bar(x=x_values, y=frequencies)]
# Plotly类Bar()必须放在方括号内,该数据集包含(x,y)等多个元素
x_axis_config = {'title': '结果', 'dtick': 1}
# dtick键指定x轴显示的刻度间距
y_axis_config = {'title': '结果的频率'}
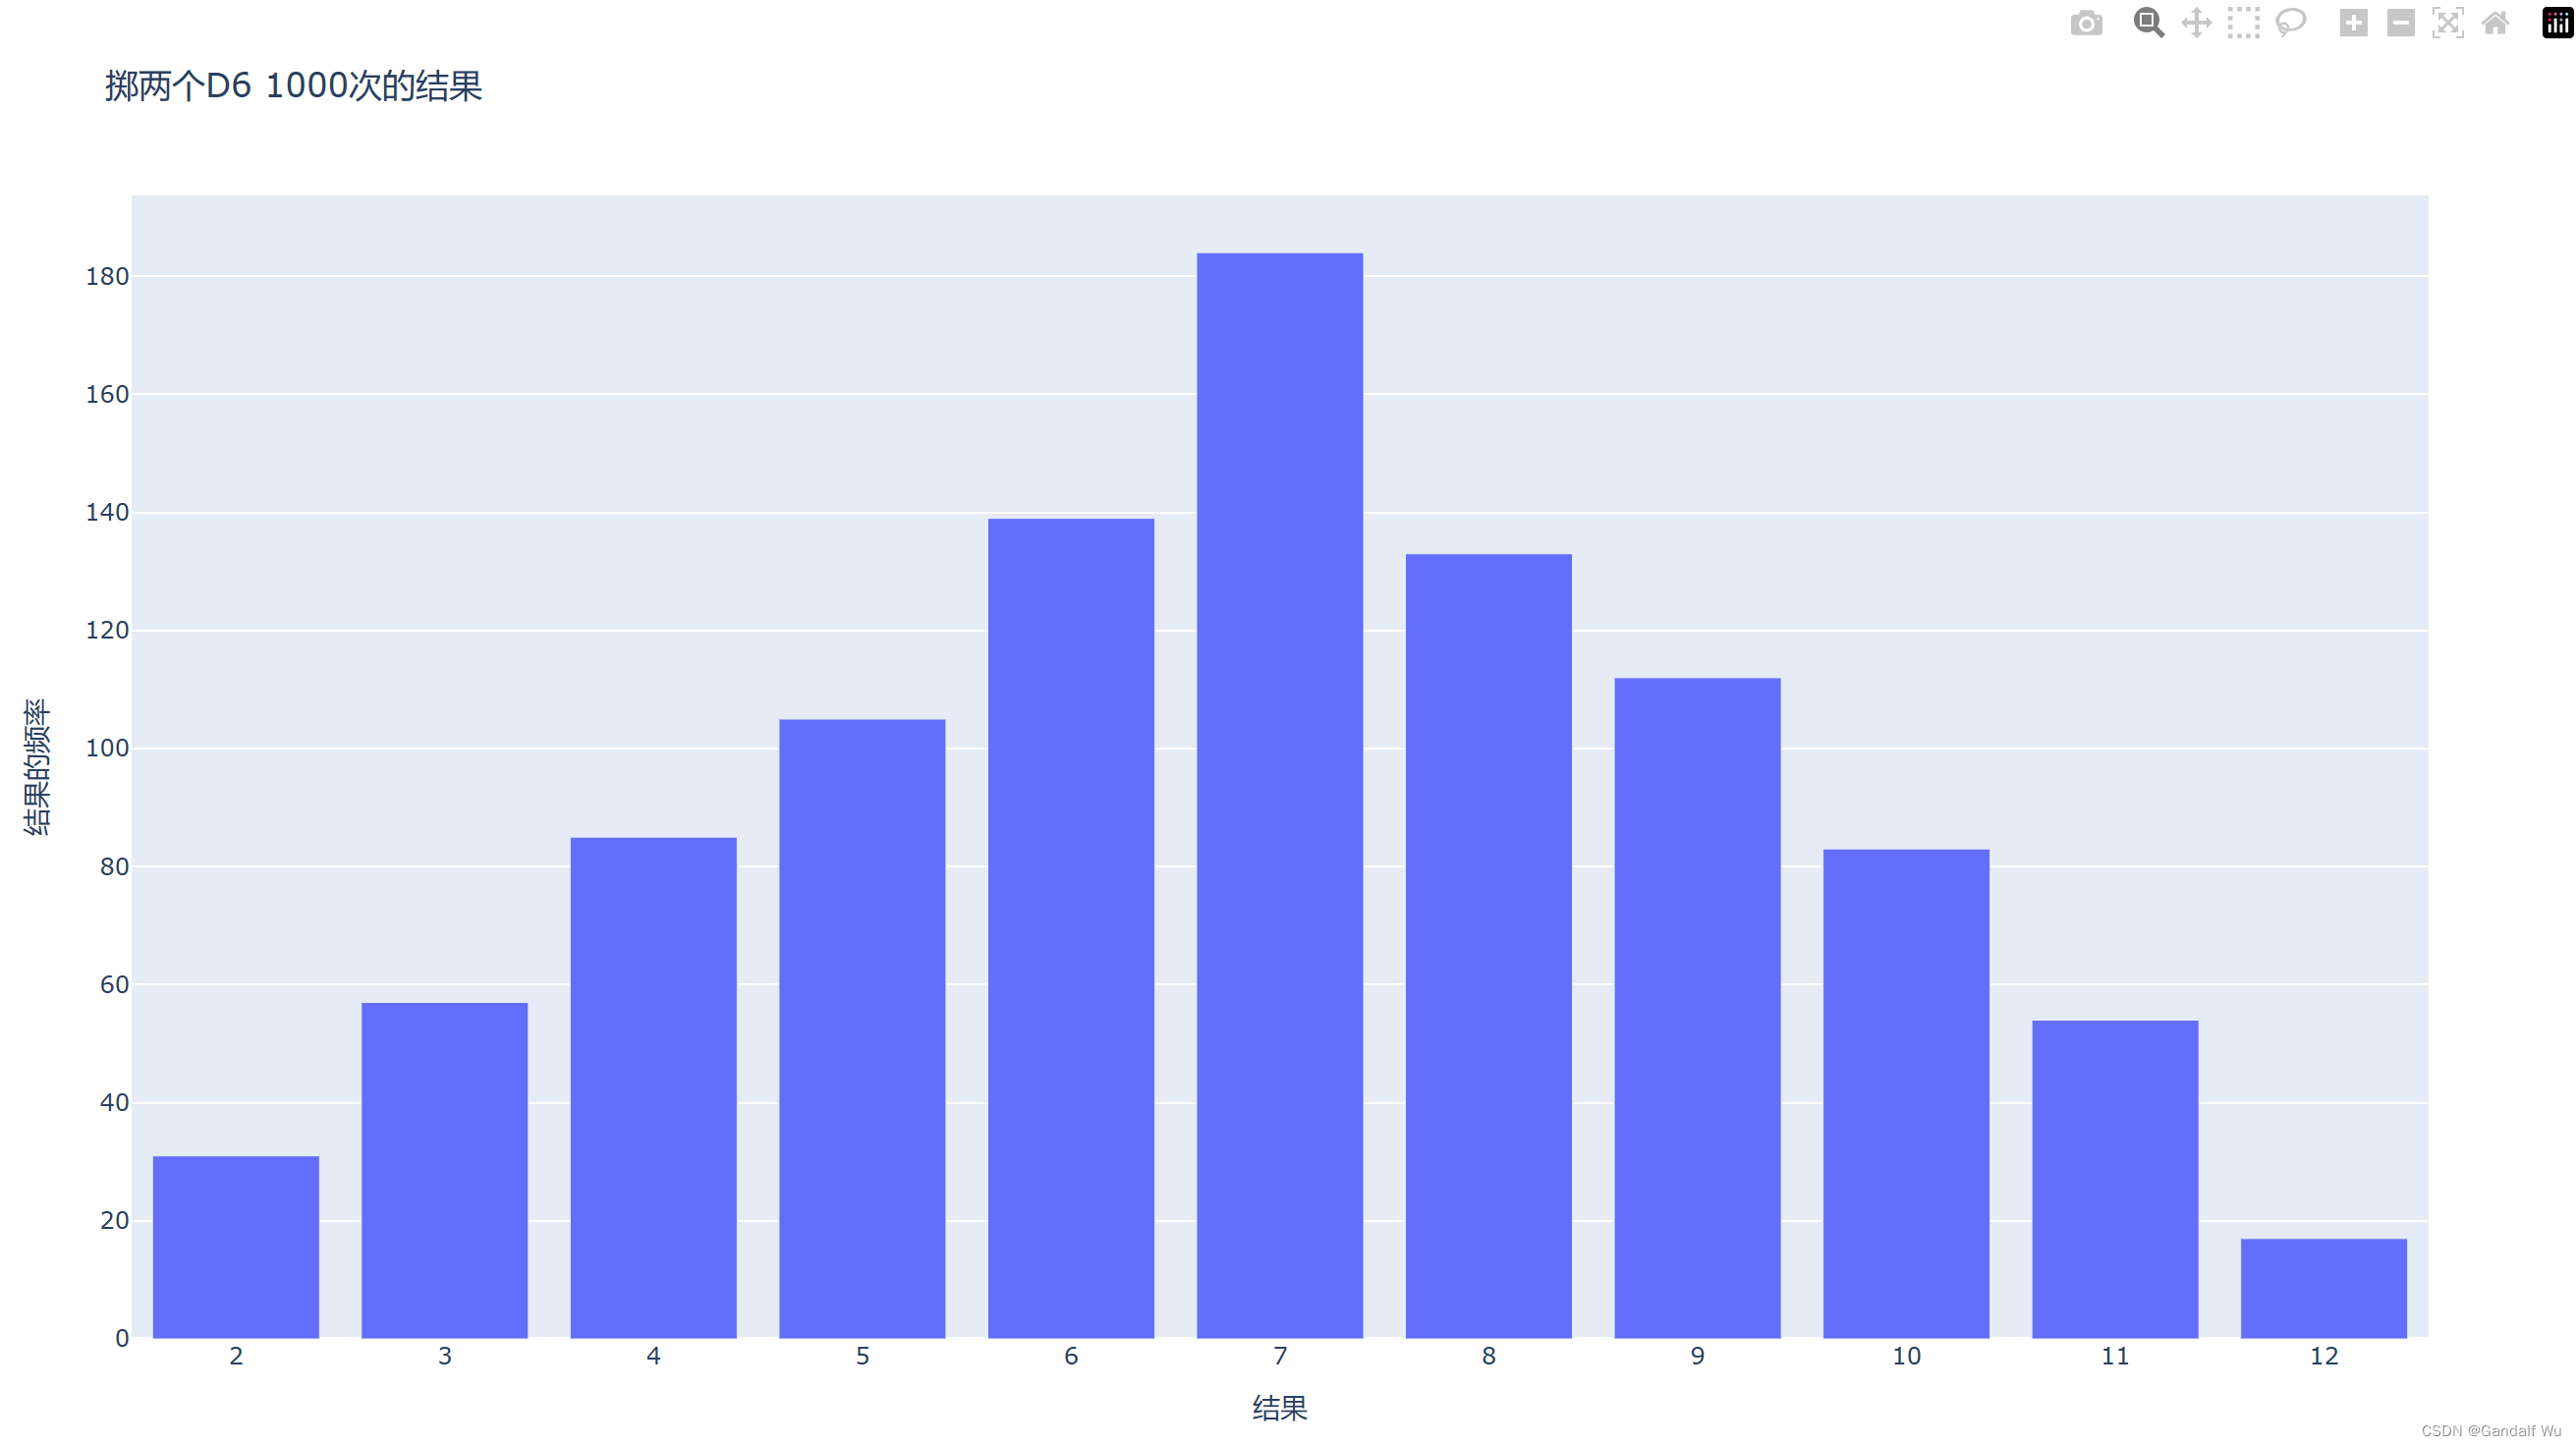
my_layout = Layout(title='掷两个D6 1000次的结果', xaxis=x_axis_config, yaxis=y_axis_config)
# 类Layout()返回图表布局和配置的对象
offline.plot({'data': data, 'layout': my_layout}, filename='d6_d6.html')
# 类offline.plot()包含数据和布局对象的字典,另外接受一个文件名运行结果:
15.4.7 同时掷两个面数不同的骰子
from plotly.graph_objs import Bar, Layout
from plotly import offline

from die import Die

# 创建一个D6和一个D10
die_1 = Die()
die_2 = Die(10)

# 掷几次骰子并将结果存储在一个列表中
results = []
for roll_num in range(50_000):
    result = die_1.roll() + die_2.roll()
    results.append(result)

# 分析结果
frequencies = []
max_result = die_1.num_sides + die_2.num_sides
for value in range(2, max_result+1):
    frequency = results.count(value)
    frequencies.append(frequency)

# print(frequencies)

# 可视化结果
x_values = list(range(2, max_result+1))
# 可能出现的点数存储在x_values中,Plotly不能接受函数range()的结果
data = [Bar(x=x_values, y=frequencies)]
# Plotly类Bar()必须放在方括号内,该数据集包含(x,y)等多个元素

x_axis_config = {'title': '结果', 'dtick': 1}
# dtick键指定x轴显示的刻度间距
y_axis_config = {'title': '结果的频率'}
my_layout = Layout(title='掷一个D6和一个D10 50000次的结果', xaxis=x_axis_config, yaxis=y_axis_config)
# 类Layout()返回图表布局和配置的对象
offline.plot({'data': data, 'layout': my_layout}, filename='d6_d10.html')
# 类offline.plot()包含数据和布局对象的字典,另外接受一个文件名
运行结果:


 280
280

 被折叠的 条评论
为什么被折叠?
被折叠的 条评论
为什么被折叠?
 到【灌水乐园】发言


