


# 昨日知识点回顾
CSV文件绘制图表,处理数据异常
# 今日知识点学习
16.2 制作全球地震散点图
16.2.1 地震数据
eq_data_1_day_m1.json
16.2.2 查看json数据167
import json

# 探索数据的结构
filename = 'data/eq_data_1_day_m1.json'
with open(filename) as f:
    all_eq_data = json.load(f)

readable_file = 'data/readable_eq_data.json'
with open(readable_file, 'w') as f:
    # 参数indent=4让dump()使用与数据结构匹配的缩进量来设置数据的格式
    json.dump(all_eq_data, f, indent=4)

# 运行结果:打开readable_eq_data.json文件显示
# {
#     "type": "FeatureCollection",
#     "metadata": {
#         "generated": 1550361461000,
#         "url": "https://earthquake.usgs.gov/earthquakes/feed/v1.0/summary/1.0_day.geojson",
#         "title": "USGS Magnitude 1.0+ Earthquakes, Past Day",
#         "status": 200,
#         "api": "1.7.0",
#         "count": 158
#     },
#     "features": [
#         {
#             "type": "Feature",
#             "properties": {
# ---snip---
16.2.3 创建地震列表
import json

# 探索数据的结构
filename = 'data/eq_data_1_day_m1.json'
with open(filename) as f:
    all_eq_data = json.load(f)

all_eq_dicts = all_eq_data['features']
print(len(all_eq_data))

# 运行结果:
# 158
16.2.4 提取震级
import json

# 探索数据的结构
filename = 'data/eq_data_1_day_m1.json'
with open(filename) as f:
    all_eq_data = json.load(f)

all_eq_dicts = all_eq_data['features']

mags = []
for eq_dict in all_eq_dicts:
    mag = eq_dict['properties']['mag']
    mags.append(mag)

print(mags[:10])

# 运行结果:
# [0.96, 1.2, 4.3, 3.6, 2.1, 4, 1.06, 2.3, 4.9, 1.8]
16.2.5 提取位置数据
import json
# 探索数据的结构
filename = 'data/eq_data_1_day_m1.json'
with open(filename) as f:
all_eq_data = json.load(f)
all_eq_dicts = all_eq_data['features']
mags, titles, lons, lats = [], [], [], []
for eq_dict in all_eq_dicts:
mag = eq_dict['properties']['mag']
title = eq_dict['properties']['title']
lon = eq_dict['geometry']['coordinates'][0]
lat = eq_dict['geometry']['coordinates'][1]
mags.append(mag)
titles.append(title)
lons.append(lon)
lats.append(lat)
print(mags[:10])
print(titles[:2])
print(lons[:5])
print(lats[:5])
# 运行结果:
# [0.96, 1.2, 4.3, 3.6, 2.1, 4, 1.06, 2.3, 4.9, 1.8]
# ['M 1.0 - 8km NE of Aguanga, CA', 'M 1.2 - 11km NNE of North Nenana, Alaska']
# [-116.7941667, -148.9865, -74.2343, -161.6801, -118.5316667]
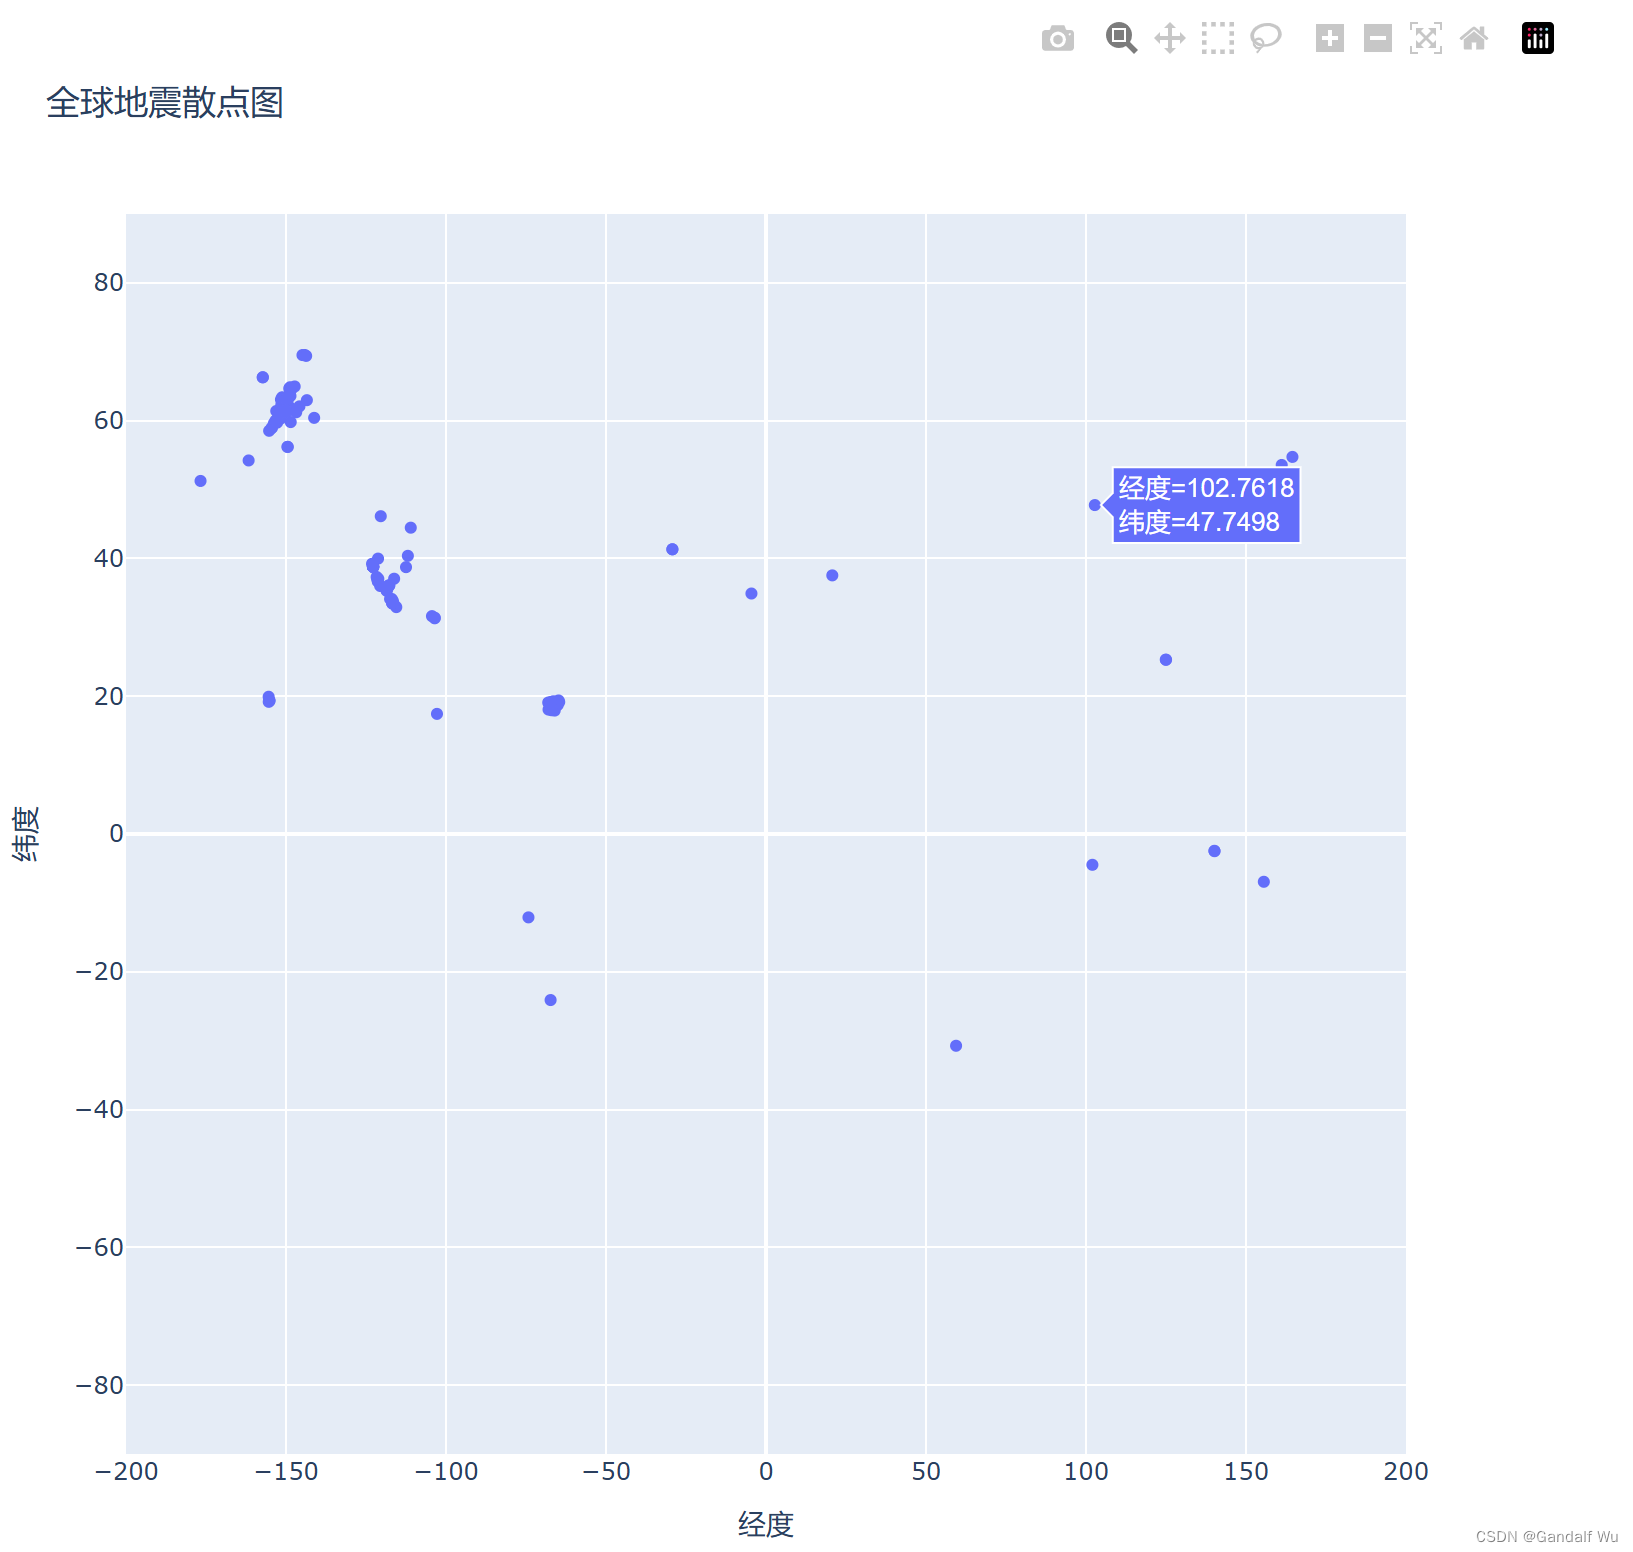
# [33.4863333, 64.6673, -12.1025, 54.2232, 35.3098333]16.2.6 绘制震级散点图
# eq_world_map.py
import plotly.express as px
from eq_explore_data import lons, lats

fig = px.scatter(
    x=lons,
    y=lats,
    labels={'x': '经度', 'y': '纬度'},
    range_x=[-200, 200],
    range_y=[-90, 90],
    width=800,
    height=800,
    title='全球地震散点图'
)
fig.write_html('global_earthquakes.html')
fig.show()
运行结果:
16.2.7 另一种指定图表数据的方式
import plotly.express as px
from eq_explore_data import lons, lats, titles, mags
import pandas as pd

data = pd.DataFrame(
    data=zip(lons, lats, titles, mags), columns=['经度', '纬度', '位置', '震级']
)
data.head()

fig = px.scatter(
    data,
    x='经度',
    y='纬度',
    # x=lons,
    # y=lats,
    # labels={'x': '经度', 'y': '纬度'},
    range_x=[-200, 200],
    range_y=[-90, 90],
    width=800,
    height=800,
    title='全球地震散点图'
)
fig.write_html('global_earthquakes.html')
fig.show()
# 使用pandas数据分析工具创建一个DataFrame,将所需要的数据封装起来
16.2.8 定制标记的尺寸
import plotly.express as px
from eq_explore_data import lons, lats, titles, mags
import pandas as pd

data = pd.DataFrame(
    data=zip(lons, lats, titles, mags), columns=['经度', '纬度', '位置', '震级']
)
data.head()

fig = px.scatter(
    data,
    x='经度',
    y='纬度',
    # x=lons,
    # y=lats,
    # labels={'x': '经度', 'y': '纬度'},
    range_x=[-200, 200],
    range_y=[-90, 90],
    width=800,
    height=800,
    title='全球地震散点图',
    size='震级',
    size_max=10,
)
fig.write_html('global_earthquakes.html')
fig.show()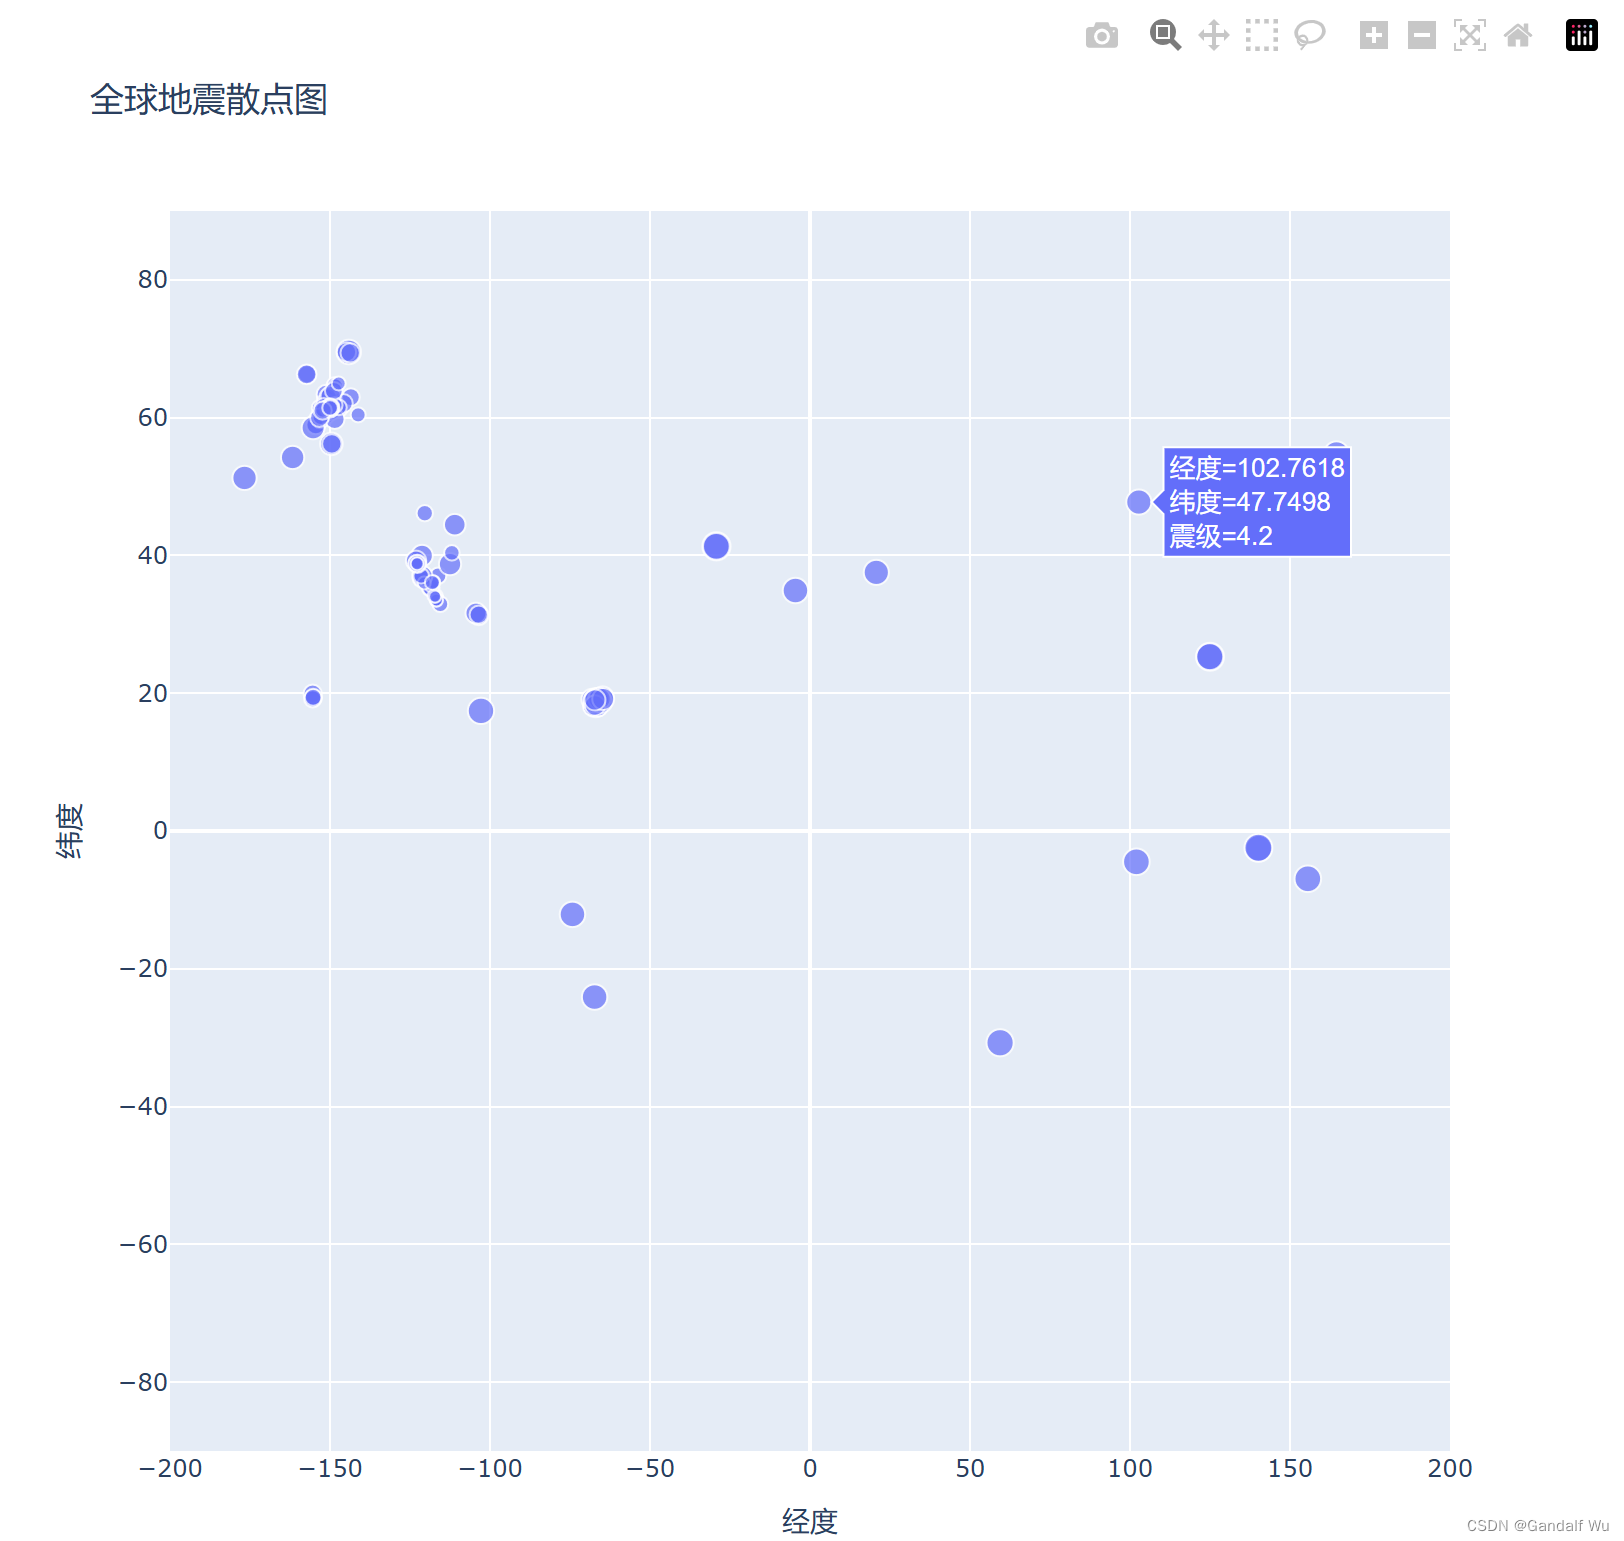
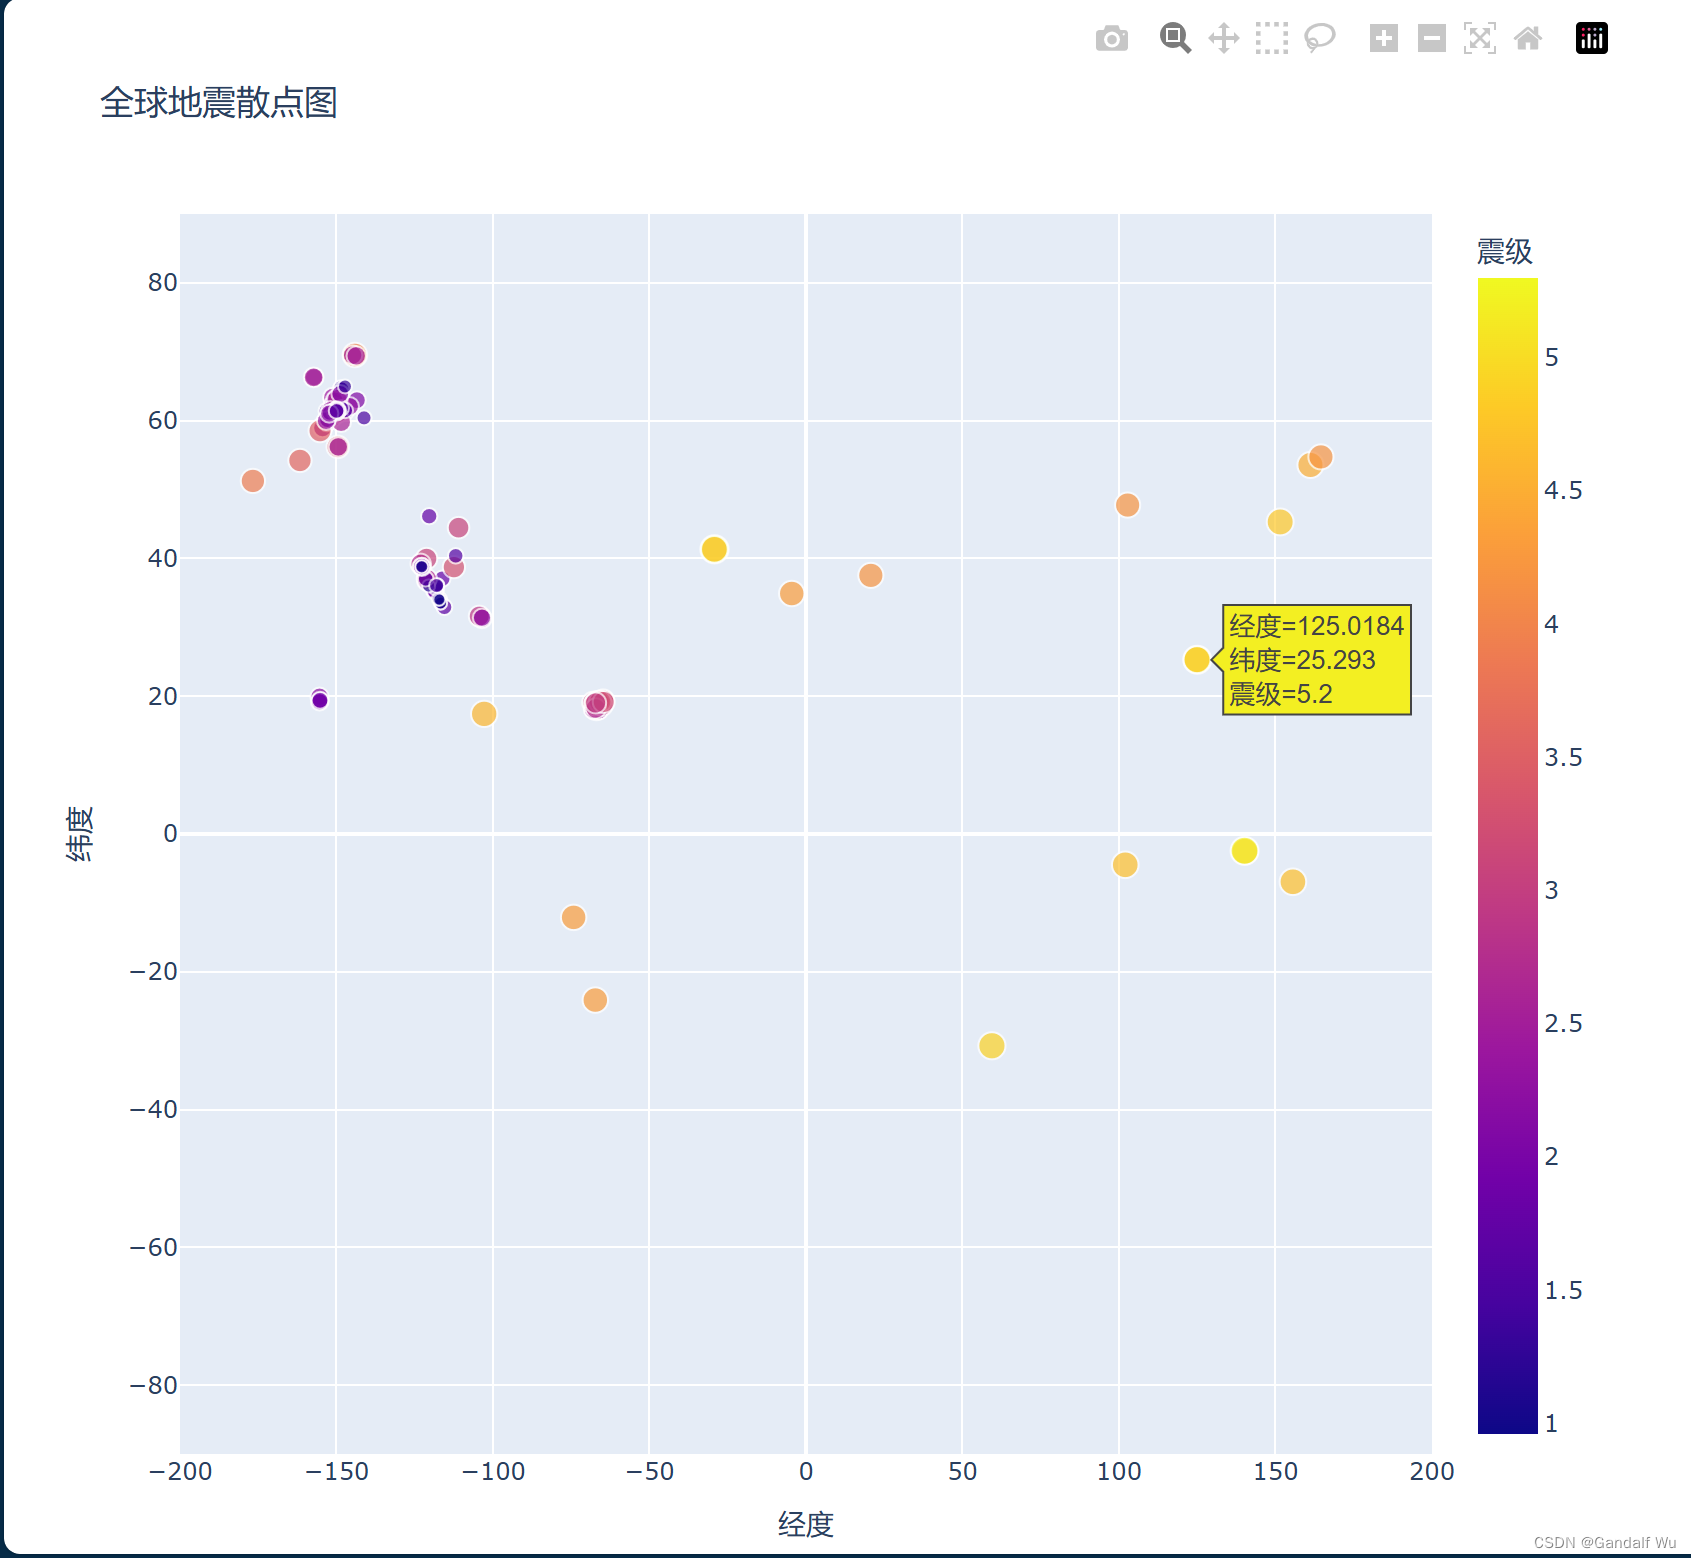
16.2.9 定制标记的颜色
import plotly.express as px
from eq_explore_data import lons, lats, titles, mags
import pandas as pd

filename = 'data/eq_data_30_day_m1.json'
data = pd.DataFrame(
    data=zip(lons, lats, titles, mags), columns=['经度', '纬度', '位置', '震级']
)
data.head()

fig = px.scatter(
    data,
    x='经度',
    y='纬度',
    # x=lons,
    # y=lats,
    # labels={'x': '经度', 'y': '纬度'},
    range_x=[-200, 200],
    range_y=[-90, 90],
    width=800,
    height=800,
    title='全球地震散点图',
    size='震级',
    size_max=10,
    color='震级',
)
fig.write_html('global_earthquakes.html')
fig.show()
16.2.10 其他渐变
# show_color_scales.py
import plotly.express as px
for key in px.colors.named_colorscales():
print(key)
# 运行结果:
# aggrnyl
# agsunset
# blackbody
# bluered
# blues
# blugrn
# bluyl
# brwnyl
# bugn
# bupu
# burg
# burgyl
# cividis
# darkmint
# electric
# emrld
# gnbu
# greens
# greys
# hot
# inferno
# jet
# magenta
# magma
# mint
# orrd
# oranges
# oryel
# peach
# pinkyl
# plasma
# plotly3
# pubu
# pubugn
# purd
# purp
# purples
# purpor
# rainbow
# rdbu
# rdpu
# redor
# reds
# sunset
# sunsetdark
# teal
# tealgrn
# turbo
# viridis
# ylgn
# ylgnbu
# ylorbr
# ylorrd
# algae
# amp
# deep
# dense
# gray
# haline
# ice
# matter
# solar
# speed
# tempo
# thermal
# turbid
# armyrose
# brbg
# earth
# fall
# geyser
# prgn
# piyg
# picnic
# portland
# puor
# rdgy
# rdylbu
# rdylgn
# spectral
# tealrose
# temps
# tropic
# balance
# curl
# delta
# oxy
# edge
# hsv
# icefire
# phase
# twilight
# mrybm
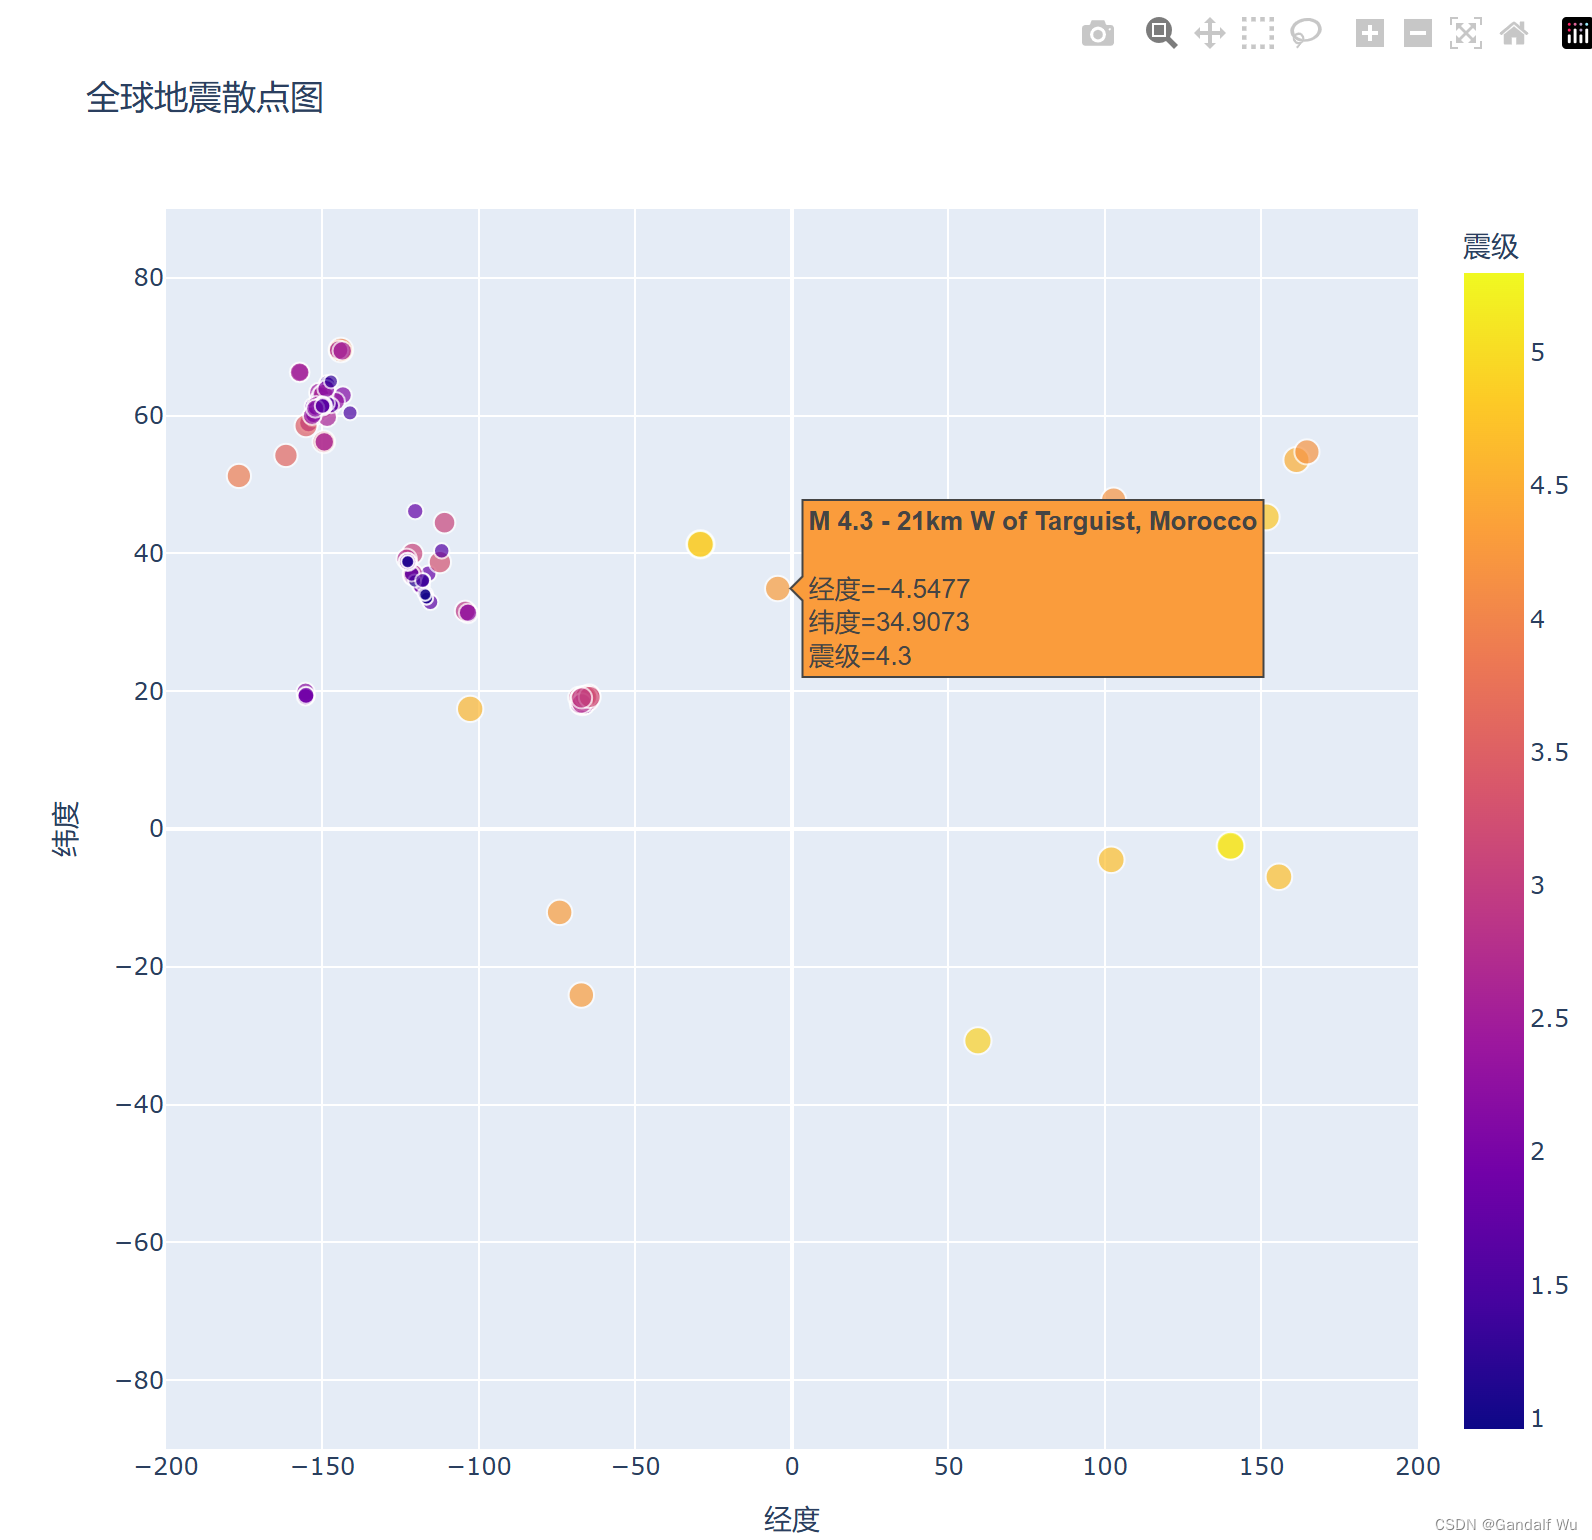
# mygbm16.2.11 添加鼠标指向时显示的文本
import plotly.express as px
from eq_explore_data import lons, lats, titles, mags
import pandas as pd

filename = 'data/eq_data_30_day_m1.json'
data = pd.DataFrame(
    data=zip(lons, lats, titles, mags), columns=['经度', '纬度', '位置', '震级']
)
data.head()

fig = px.scatter(
    data,
    x='经度',
    y='纬度',
    # x=lons,
    # y=lats,
    # labels={'x': '经度', 'y': '纬度'},
    range_x=[-200, 200],
    range_y=[-90, 90],
    width=800,
    height=800,
    title='全球地震散点图',
    size='震级',
    size_max=10,
    color='震级',
    hover_name='位置',
)
fig.write_html('global_earthquakes.html')
fig.show()


 1395
1395

 被折叠的 条评论
为什么被折叠?
被折叠的 条评论
为什么被折叠?
 到【灌水乐园】发言


