


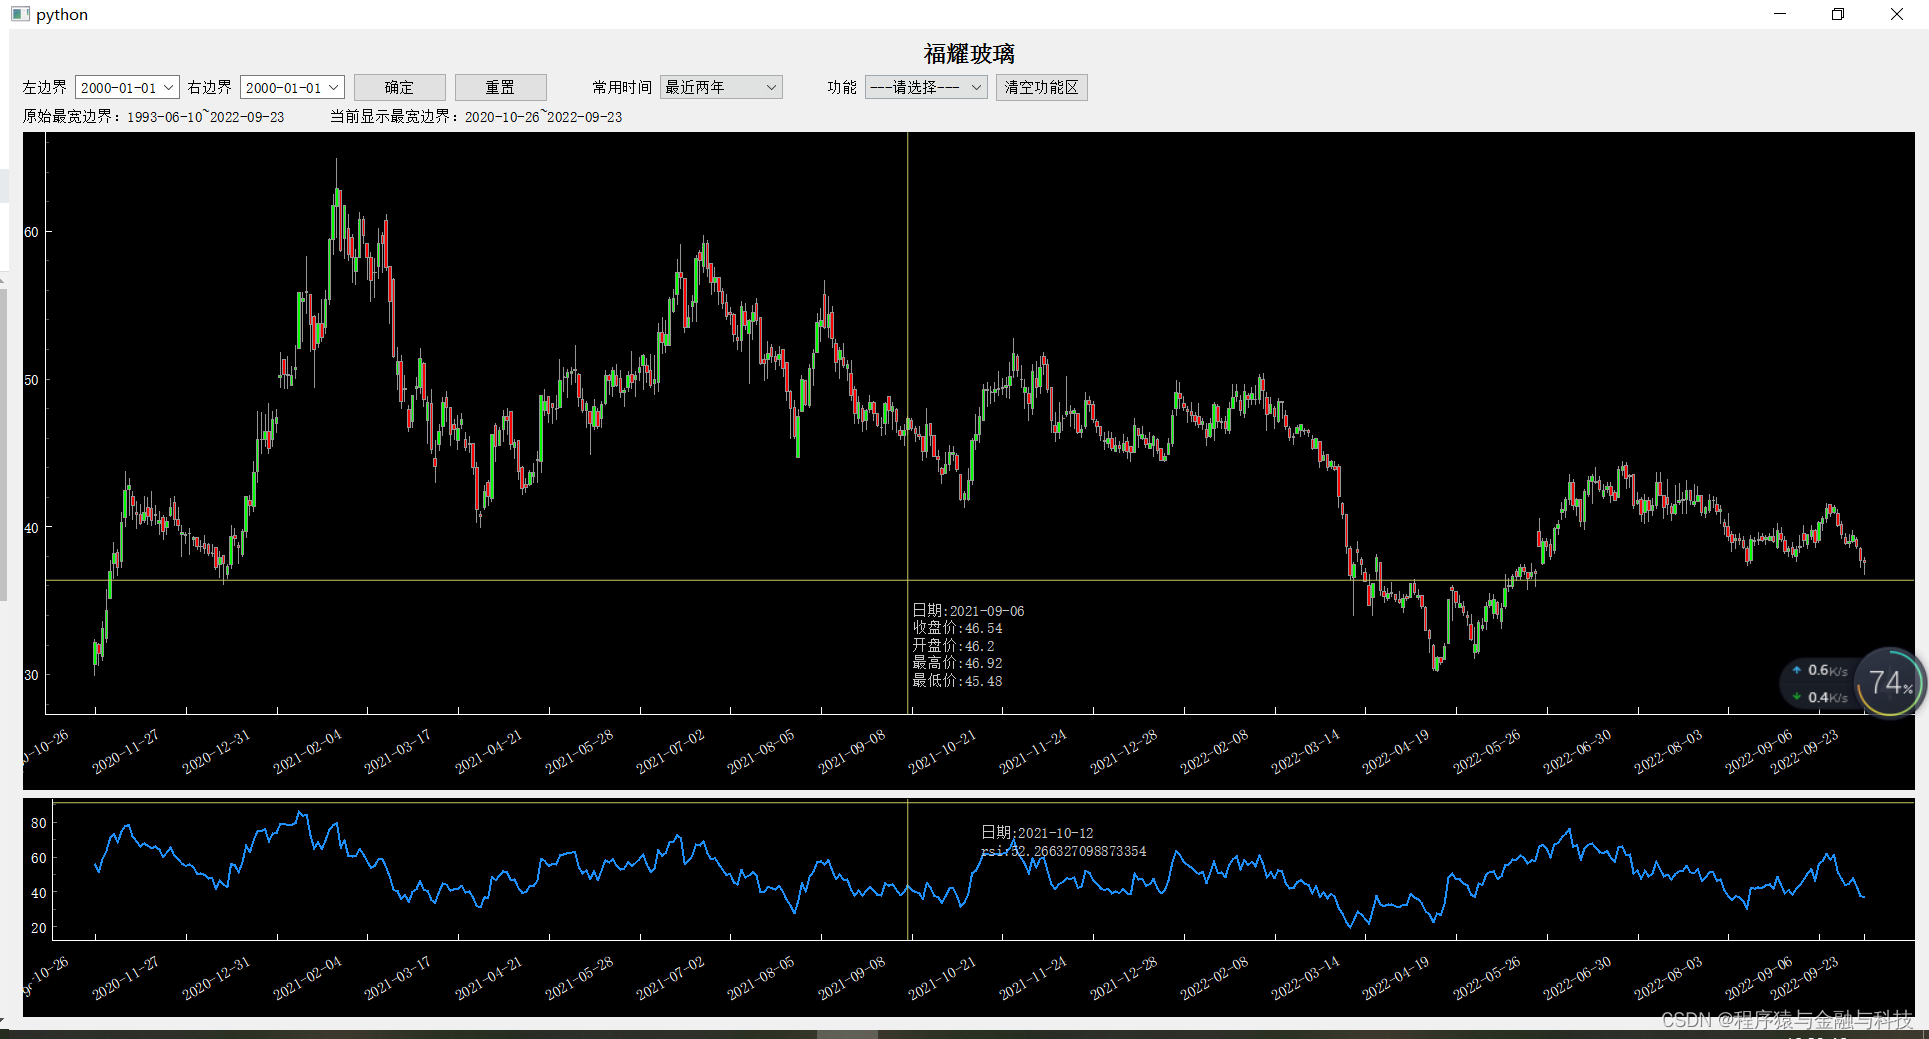
股票K线图与RSI指标横轴同步缩放显示,方便同步查看股票价格与RSI指标之间的关系,在使用代码辅助分析时,通过该控件可以方便所得分析结果可见,协助分析。
目录
效果
代码
需要的包、蜡烛控件、日期横轴控件、一些日期计算方法
import sys,json
import numpy as np
from datetime import datetime
from dateutil.relativedelta import relativedelta
from typing import Dict,Any
from PyQt5 import QtCore,QtGui,QtWidgets
from PyQt5.QtCore import Qt
import pyqtgraph as pg
import pyqtgraph.examples
pg.setConfigOption('background','k')
pg.setConfigOption('foreground','w')

# 返回今天的日期
def res_date_normal_str():
    return datetime.now().strftime('%Y-%m-%d')
# 返回今年第一天
def res_current_year_first_day():
    now_day = datetime.today()
    current_year = now_day.year
    res_str = f"{current_year}-01-01"
    return res_str
    pass
# 往回推一年的第一天
def res_pre_year_first_day():
    # https://blog.csdn.net/weixin_42185136/article/details/108646120
    pre_year_day = (datetime.now()-relativedelta(years=1)).strftime('%Y-%m-%d')
    return pre_year_day
# 往回推两年的第一天
def res_pre_two_year_first_day():
    pre_year_day = (datetime.now() - relativedelta(years=2)).strftime('%Y-%m-%d')
    return pre_year_day

class RotateAxisItem(pg.AxisItem):
    def drawPicture(self, p, axisSpec, tickSpecs, textSpecs):
        p.setRenderHint(p.Antialiasing,False)
        p.setRenderHint(p.TextAntialiasing,True)

        ## draw long line along axis
        pen,p1,p2 = axisSpec
        p.setPen(pen)
        p.drawLine(p1,p2)
        p.translate(0.5,0)  ## resolves some damn pixel ambiguity

        ## draw ticks
        for pen,p1,p2 in tickSpecs:
            p.setPen(pen)
            p.drawLine(p1,p2)

        ## draw all text
        # if self.tickFont is not None:
        #     p.setFont(self.tickFont)
        p.setPen(self.pen())
        for rect,flags,text in textSpecs:
            # this is the important part
            p.save()
            p.translate(rect.x(),rect.y())
            p.rotate(-30)
            p.drawText(-rect.width(),rect.height(),rect.width(),rect.height(),flags,text)
            # restoring the painter is *required*!!!
            p.restore()

class CandlestickItem(pg.GraphicsObject):
    def __init__(self, data):
        pg.GraphicsObject.__init__(self)
        self.data = data  ## data must have fields: time, open, close, min, max
        self.generatePicture()

    def generatePicture(self):
        ## pre-computing a QPicture object allows paint() to run much more quickly,
        ## rather than re-drawing the shapes every time.
        self.picture = QtGui.QPicture()
        p = QtGui.QPainter(self.picture)
        p.setPen(pg.mkPen('d'))
        w = (self.data[1][0] - self.data[0][0]) / 3.
        for (t, open, close, min, max) in self.data:
            p.drawLine(QtCore.QPointF(t, min), QtCore.QPointF(t, max))
            if open > close:
                p.setBrush(pg.mkBrush('r'))
            else:
                p.setBrush(pg.mkBrush('g'))
            p.drawRect(QtCore.QRectF(t - w, open, w * 2, close - open))
        p.end()

    def paint(self, p, *args):
        p.drawPicture(0, 0, self.picture)

    def boundingRect(self):
        ## boundingRect _must_ indicate the entire area that will be drawn on
        ## or else we will get artifacts and possibly crashing.
        ## (in this case, QPicture does all the work of computing the bouning rect for us)
        return QtCore.QRectF(self.picture.boundingRect())
K线图与指标同步缩放并排显示控件
class PyQtGraphLineWidget(QtWidgets.QWidget):
    def __init__(self):
        super().__init__()
        self.init_data()
        self.init_ui()
        pass
    def init_data(self):
        self.please_select_str = '---请选择---'
        self.func_map = {
        }
        self.func_item_list = []
        self.duration_map = {
            '今年':'a',
            '最近一年':'b',
            '最近两年':'c'
        }
        # https://www.sioe.cn/yingyong/yanse-rgb-16/
        self.color_line = (30, 144, 255)
        self.color_ma_5 = (248,248,255) # 幽灵的白色
        self.color_ma_10 = (255,255,0) # 纯黄
        self.color_ma_20 = (255,0,255) # 紫红色
        self.color_ma_30 = (0,128,0) # 纯绿
        self.color_ma_60 = (30,144,255) # 道奇蓝
        self.color_up = (220,20,60)
        self.color_down = (60,179,113)
        self.main_fixed_target_list = []  # 主体固定曲线,不能被删除
        self.whole_df = None
        self.whole_header = None
        self.whole_header2 = None
        self.whole_pd_header = None
        self.whole_pd_header2 = None
        self.current_whole_data = None
        self.current_whole_data2 = None
        self.current_whole_df = None
        pass
    def init_ui(self):
        # 控制面板 start
        left_tip = QtWidgets.QLabel('左边界')
        self.left_point = QtWidgets.QDateEdit()
        self.left_point.setDisplayFormat('yyyy-MM-dd')
        self.left_point.setCalendarPopup(True)
        right_tip = QtWidgets.QLabel('右边界')
        self.right_point = QtWidgets.QDateEdit()
        self.right_point.setDisplayFormat('yyyy-MM-dd')
        self.right_point.setCalendarPopup(True)
        duration_sel_btn = QtWidgets.QPushButton('确定')
        duration_sel_btn.clicked.connect(self.duration_sel_btn_clicked)
        duration_reset_btn = QtWidgets.QPushButton('重置')
        duration_reset_btn.clicked.connect(self.duration_reset_btn_clicked)

        duration_tip = QtWidgets.QLabel('常用时间')
        self.duration_combox = QtWidgets.QComboBox()
        self.duration_combox.addItem(self.please_select_str)
        self.duration_combox.addItems(list(self.duration_map.keys()))
        self.duration_combox.currentIndexChanged.connect(self.duration_combox_currentIndexChanged)

        combox_tip = QtWidgets.QLabel('功能')
        self.func_combox = QtWidgets.QComboBox()
        self.func_combox.addItem(self.please_select_str)
        self.func_combox.addItems(list(self.func_map.keys()))
        self.func_combox.currentIndexChanged.connect(self.func_combox_currentIndexChanged)
        clear_func_btn = QtWidgets.QPushButton('清空功能区')
        clear_func_btn.clicked.connect(self.clear_func_btn_clicked)

        self.whole_duration_label = QtWidgets.QLabel('原始最宽边界:左边界~右边界')
        self.now_duration_label = QtWidgets.QLabel('当前显示最宽边界:左边界~右边界')

        layout_date = QtWidgets.QHBoxLayout()
        layout_date.addWidget(left_tip)
        layout_date.addWidget(self.left_point)
        layout_date.addWidget(right_tip)
        layout_date.addWidget(self.right_point)
        layout_date.addWidget(duration_sel_btn)
        layout_date.addWidget(duration_reset_btn)
        layout_date.addSpacing(30)
        layout_date.addWidget(duration_tip)
        layout_date.addWidget(self.duration_combox)
        layout_date.addSpacing(30)
        layout_date.addWidget(combox_tip)
        layout_date.addWidget(self.func_combox)
        layout_date.addWidget(clear_func_btn)
        layout_date.addStretch(1)
        layout_duration = QtWidgets.QHBoxLayout()
        layout_duration.addWidget(self.whole_duration_label)
        layout_duration.addSpacing(30)
        layout_duration.addWidget(self.now_duration_label)
        layout_duration.addStretch(1)
        # 控制面板 end

        self.title_label = QtWidgets.QLabel('均线训练')
        self.title_label.setAlignment(Qt.AlignCenter)
        self.title_label.setStyleSheet('QLabel{font-size:18px;font-weight:bold}')

        xax = RotateAxisItem(orientation='bottom')
        xax.setHeight(h=60)
        xax2 = RotateAxisItem(orientation='bottom')
        xax2.setHeight(h=60)
        self.pw = pg.PlotWidget(axisItems={'bottom': xax})
        self.pw2 = pg.PlotWidget(axisItems={'bottom': xax2})
        # self.pw.setMouseEnabled(x=True, y=True)
        # self.pw.enableAutoRange(x=False,y=True)
        # self.pw.setAutoVisible(x=False, y=True)
        layout_pw = QtWidgets.QVBoxLayout()
        layout_pw.addWidget(self.pw,3)
        layout_pw.addWidget(self.pw2,1)

        layout = QtWidgets.QVBoxLayout()
        layout.addWidget(self.title_label)
        layout.addLayout(layout_date)
        layout.addLayout(layout_duration)
        layout.addLayout(layout_pw)
        self.setLayout(layout)
        pass
    def set_data(self,data:Dict[str,Any]):
        title_str = data['title_str']
        whole_header = data['whole_header']
        whole_header2 = data['whole_header2']
        whole_df = data['whole_df']
        whole_pd_header = data['whole_pd_header']
        whole_pd_header2 = data['whole_pd_header2']

        self.whole_header = whole_header
        self.whole_header2 = whole_header2
        self.whole_df = whole_df
        self.whole_pd_header = whole_pd_header
        self.whole_pd_header2 = whole_pd_header2

        self.title_label.setText(title_str)
        self.whole_duration_label.setText(f"原始最宽边界:{self.whole_df.iloc[0]['tradeDate']}~{self.whole_df.iloc[-1]['tradeDate']}")

        self.current_whole_df = self.whole_df.copy()
        self.caculate_and_show_data()
        pass
    def caculate_and_show_data(self):
        df = self.current_whole_df.copy()
        df.reset_index(inplace=True)
        tradeDate_list = df['tradeDate'].values.tolist()
        x = range(len(df))
        xTick_show = []
        x_dur = math.ceil(len(df)/20)
        for i in range(0,len(df),x_dur):
            xTick_show.append((i,tradeDate_list[i]))
        if len(df)%20 != 0:
            xTick_show.append((len(df)-1,tradeDate_list[-1]))
        candle_data = []
        for i,row in df.iterrows():
            candle_data.append((i,row['openPrice'],row['closePrice'],row['lowestPrice'],row['highestPrice']))

        self.current_whole_data = df.loc[:,self.whole_pd_header].values.tolist()
        self.current_whole_data2 = df.loc[:,self.whole_pd_header2].values.tolist()
        # 开始配置显示的内容
        self.pw.clear()
        self.pw2.clear()
        self.func_item_list.clear()

        self.now_duration_label.setText(f"当前显示最宽边界:{df.iloc[0]['tradeDate']}~{df.iloc[-1]['tradeDate']}")

        xax = self.pw.getAxis('bottom')
        xax.setTicks([xTick_show])
        xax2 = self.pw2.getAxis('bottom')
        xax2.setTicks([xTick_show])

        candle_fixed_target = CandlestickItem(candle_data)
        self.main_fixed_target_list.append(candle_fixed_target)
        self.pw.addItem(candle_fixed_target)

        # 指标
        indicator_fixed_target = pg.PlotCurveItem(x=np.array(x), y=np.array(df['rsi'].values.tolist()),
                                            pen=pg.mkPen({'color': self.color_line, 'width': 2}),
                                            connect='finite')

        self.main_fixed_target_list.append(indicator_fixed_target)
        self.pw2.addItem(indicator_fixed_target)

        self.pw2.setXLink(self.pw)

        self.vLine = pg.InfiniteLine(angle=90, movable=False)
        self.hLine = pg.InfiniteLine(angle=0, movable=False)
        self.label = pg.TextItem()

        self.vLine2 = pg.InfiniteLine(angle=90, movable=False)
        self.hLine2 = pg.InfiniteLine(angle=0, movable=False)
        self.label2 = pg.TextItem()

        self.pw.addItem(self.vLine, ignoreBounds=True)
        self.pw.addItem(self.hLine, ignoreBounds=True)
        self.pw.addItem(self.label, ignoreBounds=True)

        self.pw2.addItem(self.vLine2, ignoreBounds=True)
        self.pw2.addItem(self.hLine2, ignoreBounds=True)
        self.pw2.addItem(self.label2, ignoreBounds=True)

        self.vb = self.pw.getViewBox()
        self.proxy = pg.SignalProxy(self.pw.scene().sigMouseMoved, rateLimit=60, slot=self.mouseMoved)
        self.pw.enableAutoRange()

        self.vb2 = self.pw2.getViewBox()
        self.proxy2 = pg.SignalProxy(self.pw2.scene().sigMouseMoved, rateLimit=60, slot=self.mouseMoved2)
        self.pw2.enableAutoRange()

        pass

    def mouseMoved(self,evt):
        pos = evt[0]
        if self.pw.sceneBoundingRect().contains(pos):
            mousePoint = self.vb.mapSceneToView(pos)
            index = int(mousePoint.x())
            if index>=0 and index<len(self.current_whole_data):
                target_data = self.current_whole_data[index]
                html_str = ''
                for i,item in enumerate(self.whole_header):
                    html_str += f"<br/>{item}:{target_data[i]}"
                self.label.setHtml(html_str)
                self.label.setPos(mousePoint.x(),mousePoint.y())
            self.vLine.setPos(mousePoint.x())
            self.hLine.setPos(mousePoint.y())
            self.vLine2.setPos(mousePoint.x())
        pass

    def mouseMoved2(self,evt):
        pos = evt[0]
        if self.pw2.sceneBoundingRect().contains(pos):
            mousePoint = self.vb2.mapSceneToView(pos)
            index = int(mousePoint.x())
            if index >= 0 and index < len(self.current_whole_data2):
                target_data = self.current_whole_data2[index]
                html_str = ''
                for i, item in enumerate(self.whole_header2):
                    html_str += f"<br/>{item}:{target_data[i]}"
                self.label2.setHtml(html_str)
                self.label2.setPos(mousePoint.x(), mousePoint.y())
            self.vLine2.setPos(mousePoint.x())
            self.hLine2.setPos(mousePoint.y())
            self.vLine.setPos(mousePoint.x())
        pass

    def mouseClicked(self,evt):
        pass
    def updateViews(self):
        pass

    # 图形操作之外
    def duration_sel_btn_clicked(self):
        '''边界选择'''
        left_point = self.left_point.date().toString('yyyy-MM-dd')
        right_point = self.right_point.date().toString('yyyy-MM-dd')
        df = self.whole_df.copy()
        df['o_date'] = pd.to_datetime(df['tradeDate'])
        self.current_whole_df = df.loc[(df['o_date']>=left_point) & (df['o_date']<=right_point)].copy()
        self.caculate_and_show_data()
        pass
    def duration_reset_btn_clicked(self):
        '''边界重置'''
        self.current_whole_df = self.whole_df.copy()
        self.caculate_and_show_data()
        pass
    def duration_combox_currentIndexChanged(self,cur_i:int):
        cur_txt = self.duration_combox.currentText()
        if cur_txt == self.please_select_str:
            return
        cur_code = self.duration_map[cur_txt]
        right_point = res_date_normal_str()
        if cur_code == 'a':
            left_point = res_current_year_first_day()
        elif cur_code == 'b':
            left_point = res_pre_year_first_day()
        elif cur_code == 'c':
            left_point = res_pre_two_year_first_day()
        else:
            return
        df = self.whole_df.copy()
        df['o_date'] = pd.to_datetime(df['tradeDate'])
        self.current_whole_df = df.loc[(df['o_date'] >= left_point) & (df['o_date'] <= right_point)].copy()
        self.caculate_and_show_data()
        pass
    def func_combox_currentIndexChanged(self,cur_i:int):
        cur_txt = self.func_combox.currentText()
        if cur_txt == self.please_select_str:
            return
        cur_code = self.func_map[cur_txt]
        df = self.current_whole_df.copy()
        if cur_code == 'a':
            # 多头排列 start
            df['count'] = range(len(df))
            df['duo'] = 0
            df.loc[(df['ma5'] > df['ma10']) & (df['ma10'] > df['ma20']) & (df['ma20'] > df['ma30']) & (
                        df['ma30'] > df['ma60']), 'duo'] = 1

            df['ext_0'] = df['duo'] - df['duo'].shift(1)
            df['ext_1'] = df['duo'] - df['duo'].shift(-1)
            duo_pre_df = df.loc[df['ext_0'] == 1].copy()
            duo_fix_df = df.loc[df['ext_1'] == 1].copy()

            pre_count_list = duo_pre_df['count'].values.tolist()
            pre_date_list = duo_pre_df['tradeDate'].values.tolist()
            fix_count_list = duo_fix_df['count'].values.tolist()
            fix_date_list = duo_fix_df['tradeDate'].values.tolist()
            if fix_count_list[0]<pre_count_list[0]:
                fix_count_list = fix_count_list[1:]
                fix_date_list = fix_date_list[1:]
            if fix_count_list[-1]<pre_count_list[-1]:
                pre_count_list = pre_count_list[0:-1]
                pre_date_list = pre_date_list[0:-1]
            font = QtGui.QFont()
            font.setPixelSize(9)
            for i, item in enumerate(fix_count_list):
                # 排除掉多头排列三日以下的区间
                if item-pre_count_list[i] <= 3:
                    continue
                lr = pg.LinearRegionItem([pre_count_list[i], item],movable=False,brush=(self.color_up[0],self.color_up[1],self.color_up[2],50))
                lr.setZValue(-100)
                label_l = pg.InfLineLabel(lr.lines[0],pre_date_list[i],position=0.90,rotateAxis=(1,0),anchor=(1,1),color=self.color_up)
                label_l.setFont(font)
                label_r = pg.InfLineLabel(lr.lines[1],fix_date_list[i],position=0.90,rotateAxis=(1,0),anchor=(1,1),color=self.color_up)
                label_r.setFont(font)
                self.func_item_list.append(lr)
                self.pw.addItem(lr)
            # 多头排列 end
            pass
        elif cur_code == 'b':
            # 空头排列 start
            df['count'] = range(len(df))
            df['duo'] = 0
            df.loc[(df['ma5'] < df['ma10']) & (df['ma10'] < df['ma20']) & (df['ma20'] < df['ma30']) & (
                    df['ma30'] < df['ma60']), 'duo'] = 1

            df['ext_0'] = df['duo'] - df['duo'].shift(1)
            df['ext_1'] = df['duo'] - df['duo'].shift(-1)
            duo_pre_df = df.loc[df['ext_0'] == 1].copy()
            duo_fix_df = df.loc[df['ext_1'] == 1].copy()

            pre_count_list = duo_pre_df['count'].values.tolist()
            pre_date_list = duo_pre_df['tradeDate'].values.tolist()
            fix_count_list = duo_fix_df['count'].values.tolist()
            fix_date_list = duo_fix_df['tradeDate'].values.tolist()
            if fix_count_list[0] < pre_count_list[0]:
                fix_count_list = fix_count_list[1:]
                fix_date_list = fix_date_list[1:]
            if fix_count_list[-1] < pre_count_list[-1]:
                pre_count_list = pre_count_list[0:-1]
                pre_date_list = pre_date_list[0:-1]
            font = QtGui.QFont()
            font.setPixelSize(9)
            for i, item in enumerate(fix_count_list):
                # 排除掉空头排列三日以下的区间
                if item - pre_count_list[i] <= 3:
                    continue
                lr = pg.LinearRegionItem([pre_count_list[i], item], movable=False, brush=(self.color_down[0],self.color_down[1],self.color_down[2], 50))
                lr.setZValue(-100)
                label_l = pg.InfLineLabel(lr.lines[0], pre_date_list[i], position=0.90, rotateAxis=(1, 0),
                                          anchor=(1, 1), color=self.color_down)
                label_l.setFont(font)
                label_r = pg.InfLineLabel(lr.lines[1], fix_date_list[i], position=0.90, rotateAxis=(1, 0),
                                          anchor=(1, 1), color=self.color_down)
                label_r.setFont(font)
                self.func_item_list.append(lr)
                self.pw.addItem(lr)
            # 空头排列 end
            pass
        elif cur_code == 'c':
            # 20日线斜率为正 start
            df['count'] = range(len(df))
            df['ext_0'] = df['ma20'] - df['ma20'].shift(1)
            df['ext_1'] = 0
            df.loc[df['ext_0']>0,'ext_1'] = 1
            df['ext_2'] = df['ext_1'] - df['ext_1'].shift(1)
            df['ext_3'] = df['ext_1'] - df['ext_1'].shift(-1)
            duo_pre_df = df.loc[df['ext_2'] == 1].copy()
            duo_fix_df = df.loc[df['ext_3'] == 1].copy()

            pre_count_list = duo_pre_df['count'].values.tolist()
            pre_date_list = duo_pre_df['tradeDate'].values.tolist()
            fix_count_list = duo_fix_df['count'].values.tolist()
            fix_date_list = duo_fix_df['tradeDate'].values.tolist()
            if fix_count_list[0] < pre_count_list[0]:
                fix_count_list = fix_count_list[1:]
                fix_date_list = fix_date_list[1:]
            if fix_count_list[-1] < pre_count_list[-1]:
                pre_count_list = pre_count_list[0:-1]
                pre_date_list = pre_date_list[0:-1]
            font = QtGui.QFont()
            font.setPixelSize(9)
            for i, item in enumerate(fix_count_list):
                # if item - pre_count_list[i] <= 3:
                #     continue
                lr = pg.LinearRegionItem([pre_count_list[i], item], movable=False, brush=(self.color_up[0], self.color_up[1], self.color_up[2], 50))
                lr.setZValue(-100)
                label_l = pg.InfLineLabel(lr.lines[0], pre_date_list[i], position=0.90, rotateAxis=(1, 0),
                                          anchor=(1, 1), color=self.color_up)
                label_l.setFont(font)
                label_r = pg.InfLineLabel(lr.lines[1], fix_date_list[i], position=0.90, rotateAxis=(1, 0),
                                          anchor=(1, 1), color=self.color_up)
                label_r.setFont(font)
                self.func_item_list.append(lr)
                self.pw.addItem(lr)
            # 20日线斜率为正 end
            pass
        elif cur_code == 'd':
            # 阶段最高点最低点 start
            # 最高点
            df['ext_0'] = df['closePrice'].cummax()
            df['ext_1'] = df['ext_0'] - df['ext_0'].shift(1)
            # 最低点
            df['ext_2'] = df['closePrice'].cummin()
            df['ext_3'] = df['ext_2'] - df['ext_2'].shift(1)

            max_point_df = df.loc[df['ext_1']==0].copy()
            min_point_df = df.loc[df['ext_3']==0].copy()
            # 阶段最高点最低点 end
            pass
        pass
    def clear_func_btn_clicked(self):
        for item in self.func_item_list:
            self.pw.removeItem(item)
        self.func_item_list.clear()
        pass
    pass
使用
if __name__ == '__main__':
    # 先显示蜡烛图
    # 600660  福耀玻璃
    import pandas as pd
    import math
    import talib
    df = pd.read_csv('E:/temp005/600660.csv',encoding='utf-8')
    # 删除停牌的数据
    df = df.loc[df['openPrice']>0].copy()
    df['openPrice'] = df['openPrice']*df['accumAdjFactor']
    df['closePrice'] = df['closePrice']*df['accumAdjFactor']
    df['highestPrice'] = df['highestPrice']*df['accumAdjFactor']
    df['lowestPrice'] = df['lowestPrice']*df['accumAdjFactor']

    # 计算指标
    close_list = df['closePrice']
    df['rsi'] = talib.RSI(close_list,timeperiod=14)

    whole_pd_header = ['tradeDate','closePrice','openPrice','highestPrice','lowestPrice']
    whole_pd_header2 = ['tradeDate','rsi']

    line_data = {
        'title_str':'福耀玻璃',
        'whole_header':['日期','收盘价','开盘价','最高价','最低价'],
        'whole_header2':['日期','rsi'],
        'whole_pd_header':whole_pd_header,
        'whole_pd_header2':whole_pd_header2,
        'whole_df':df
    }

    app = QtWidgets.QApplication(sys.argv)
    t_win = PyQtGraphLineWidget()
    t_win.show()
    t_win.set_data(line_data)
    sys.exit(app.exec_())
    pass
鼠标滚动能同步缩放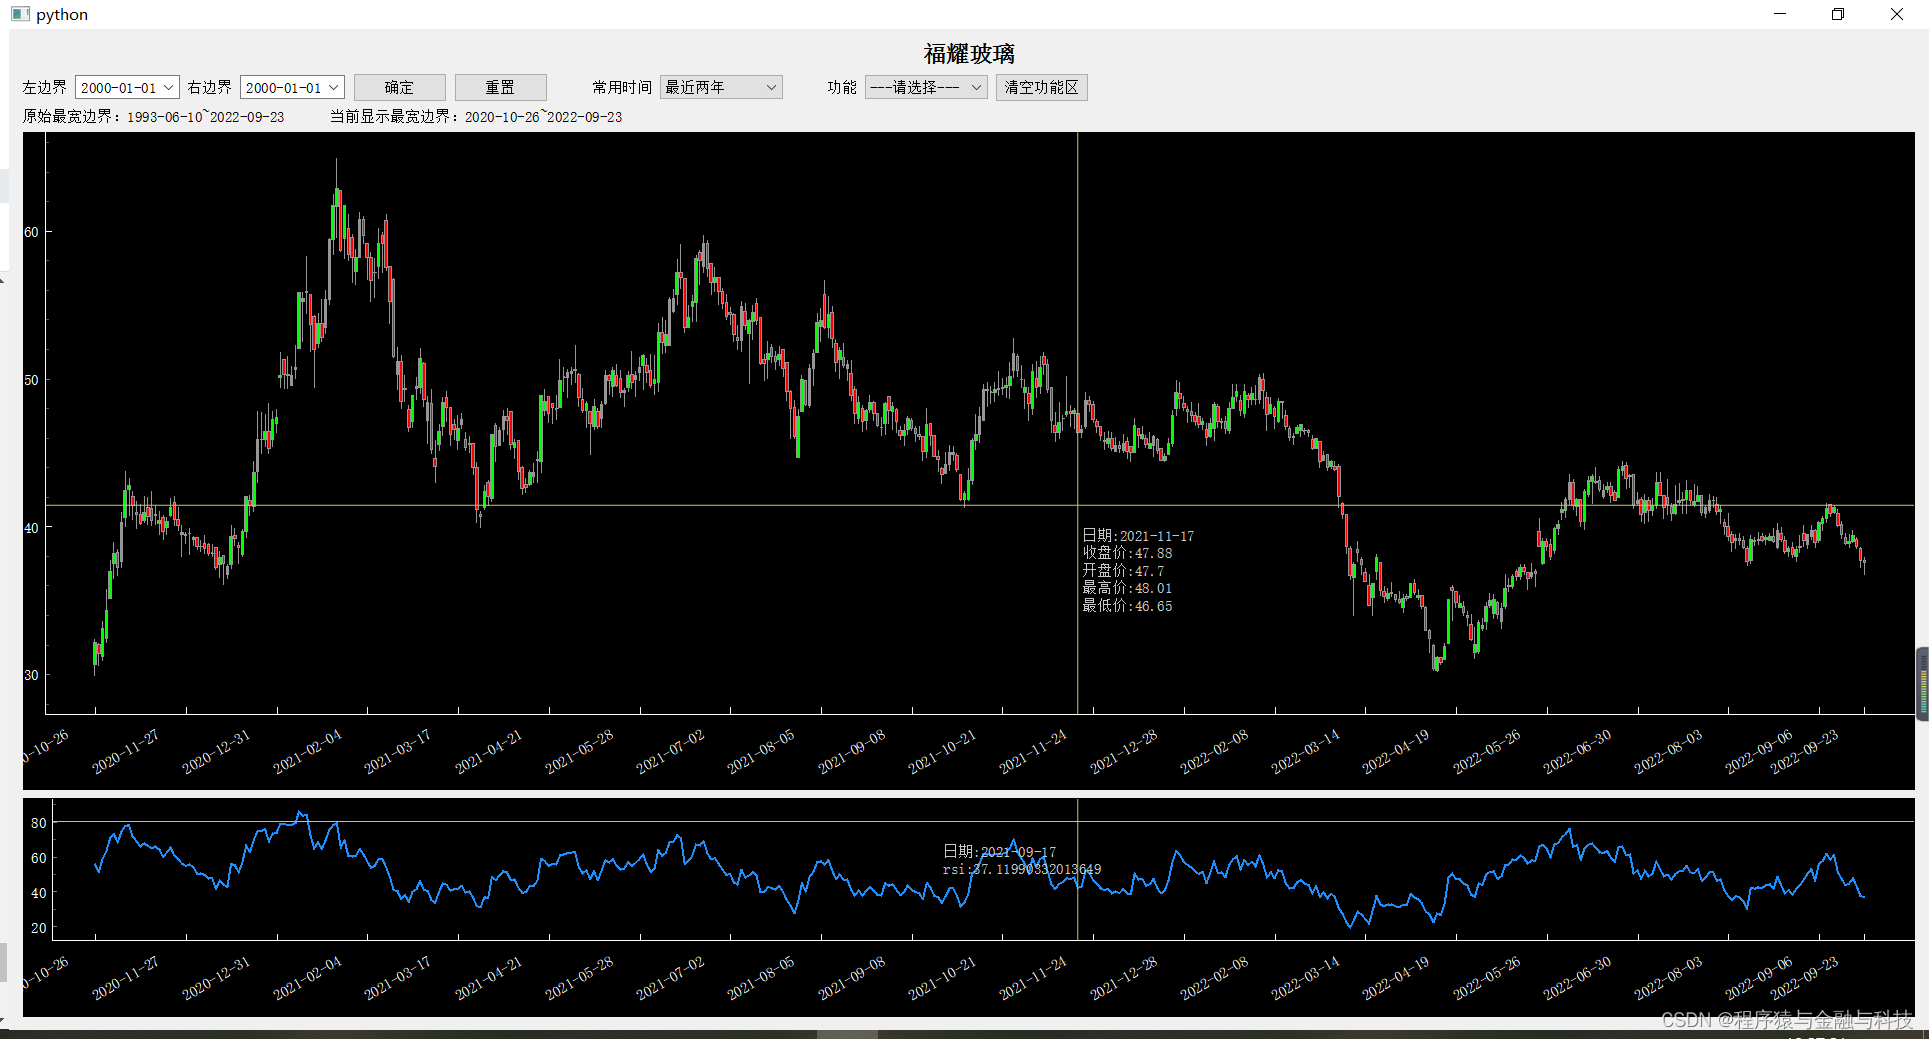
数据
链接:https://pan.baidu.com/s/1HPkMsDDyXTEgffoAVIhbZw
提取码:h80x


 1076
1076

 被折叠的 条评论
为什么被折叠?
被折叠的 条评论
为什么被折叠?
 到【灌水乐园】发言


