


股票分析常用到的均线有MA5 MA10 MA20 MA30 MA60,本例中会实现在pyqtgraph中显示这些常用均线
目录
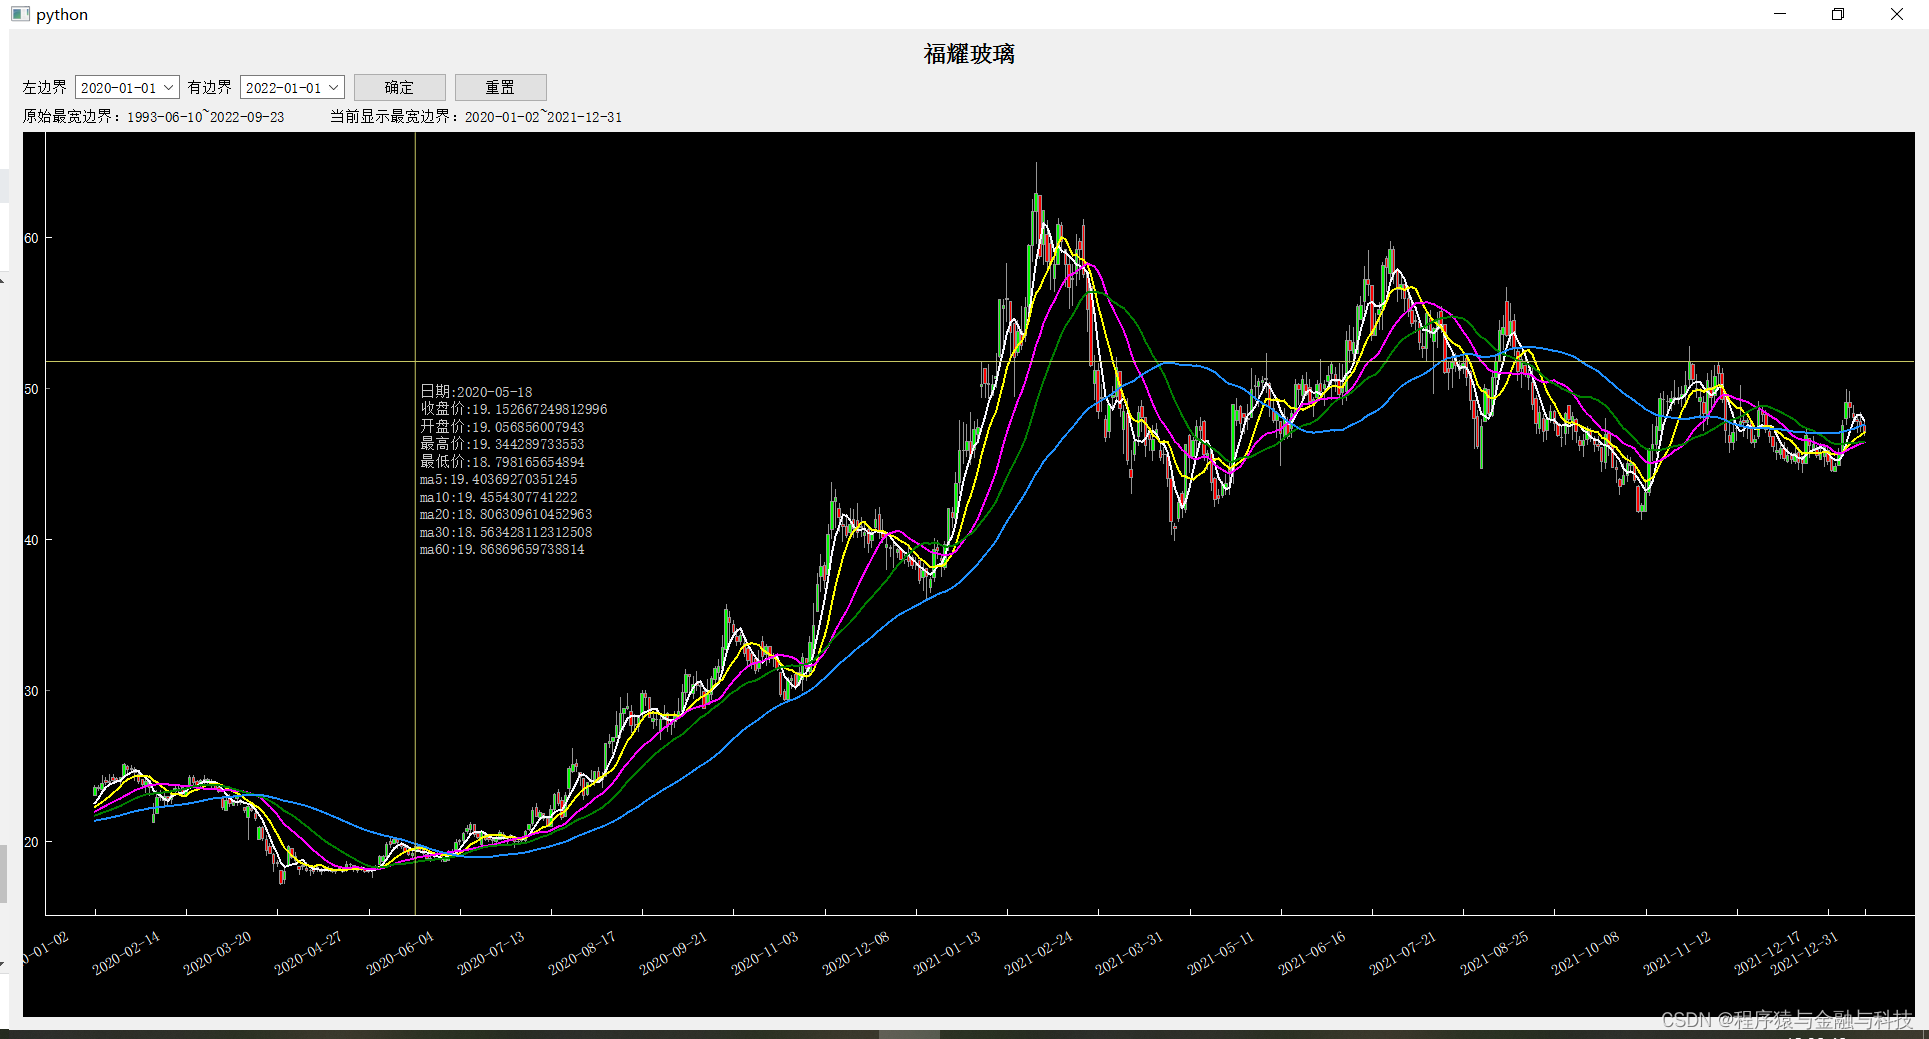
效果
代码
需要用到的包导入,与需要用到的蜡烛控件和日期横轴控件
import sys,json
import numpy as np
from typing import Dict,Any
from PyQt5 import QtCore,QtGui,QtWidgets
from PyQt5.QtCore import Qt
import pyqtgraph as pg
import pyqtgraph.examples
pg.setConfigOption('background','k')
pg.setConfigOption('foreground','w')
class RotateAxisItem(pg.AxisItem):
    def drawPicture(self, p, axisSpec, tickSpecs, textSpecs):
        p.setRenderHint(p.Antialiasing,False)
        p.setRenderHint(p.TextAntialiasing,True)

        ## draw long line along axis
        pen,p1,p2 = axisSpec
        p.setPen(pen)
        p.drawLine(p1,p2)
        p.translate(0.5,0)  ## resolves some damn pixel ambiguity

        ## draw ticks
        for pen,p1,p2 in tickSpecs:
            p.setPen(pen)
            p.drawLine(p1,p2)

        ## draw all text
        # if self.tickFont is not None:
        #     p.setFont(self.tickFont)
        p.setPen(self.pen())
        for rect,flags,text in textSpecs:
            # this is the important part
            p.save()
            p.translate(rect.x(),rect.y())
            p.rotate(-30)
            p.drawText(-rect.width(),rect.height(),rect.width(),rect.height(),flags,text)
            # restoring the painter is *required*!!!
            p.restore()

class CandlestickItem(pg.GraphicsObject):
    def __init__(self, data):
        pg.GraphicsObject.__init__(self)
        self.data = data  ## data must have fields: time, open, close, min, max
        self.generatePicture()

    def generatePicture(self):
        ## pre-computing a QPicture object allows paint() to run much more quickly,
        ## rather than re-drawing the shapes every time.
        self.picture = QtGui.QPicture()
        p = QtGui.QPainter(self.picture)
        p.setPen(pg.mkPen('d'))
        w = (self.data[1][0] - self.data[0][0]) / 3.
        for (t, open, close, min, max) in self.data:
            p.drawLine(QtCore.QPointF(t, min), QtCore.QPointF(t, max))
            if open > close:
                p.setBrush(pg.mkBrush('r'))
            else:
                p.setBrush(pg.mkBrush('g'))
            p.drawRect(QtCore.QRectF(t - w, open, w * 2, close - open))
        p.end()

    def paint(self, p, *args):
        p.drawPicture(0, 0, self.picture)

    def boundingRect(self):
        ## boundingRect _must_ indicate the entire area that will be drawn on
        ## or else we will get artifacts and possibly crashing.
        ## (in this case, QPicture does all the work of computing the bouning rect for us)
        return QtCore.QRectF(self.picture.boundingRect())
K线图和均线显示的控件
class PyQtGraphLineWidget(QtWidgets.QWidget):
    def __init__(self):
        super().__init__()
        self.init_data()
        self.init_ui()
        pass
    def init_data(self):
        # https://www.sioe.cn/yingyong/yanse-rgb-16/
        self.color_line = (30, 144, 255)
        self.color_ma_5 = (248,248,255) # 幽灵的白色
        self.color_ma_10 = (255,255,0) # 纯黄
        self.color_ma_20 = (255,0,255) # 紫红色
        self.color_ma_30 = (0,128,0) # 纯绿
        self.color_ma_60 = (30,144,255) # 道奇蓝
        self.main_fixed_target_list = []  # 主体固定曲线,不能被删除
        self.whole_df = None
        self.whole_header = None
        self.whole_pd_header = None
        self.current_whole_data = None
        self.current_whole_df = None
        pass
    def init_ui(self):
        # 控制面板 start
        left_tip = QtWidgets.QLabel('左边界')
        self.left_point = QtWidgets.QDateEdit()
        self.left_point.setDisplayFormat('yyyy-MM-dd')
        self.left_point.setCalendarPopup(True)
        right_tip = QtWidgets.QLabel('有边界')
        self.right_point = QtWidgets.QDateEdit()
        self.right_point.setDisplayFormat('yyyy-MM-dd')
        self.right_point.setCalendarPopup(True)
        duration_sel_btn = QtWidgets.QPushButton('确定')
        duration_sel_btn.clicked.connect(self.duration_sel_btn_clicked)
        duration_reset_btn = QtWidgets.QPushButton('重置')
        duration_reset_btn.clicked.connect(self.duration_reset_btn_clicked)
        self.whole_duration_label = QtWidgets.QLabel('原始最宽边界:左边界~右边界')
        self.now_duration_label = QtWidgets.QLabel('当前显示最宽边界:左边界~右边界')

        layout_date = QtWidgets.QHBoxLayout()
        layout_date.addWidget(left_tip)
        layout_date.addWidget(self.left_point)
        layout_date.addWidget(right_tip)
        layout_date.addWidget(self.right_point)
        layout_date.addWidget(duration_sel_btn)
        layout_date.addWidget(duration_reset_btn)
        layout_date.addStretch(1)
        layout_duration = QtWidgets.QHBoxLayout()
        layout_duration.addWidget(self.whole_duration_label)
        layout_duration.addSpacing(30)
        layout_duration.addWidget(self.now_duration_label)
        layout_duration.addStretch(1)
        # 控制面板 end

        self.title_label = QtWidgets.QLabel('均线训练')
        self.title_label.setAlignment(Qt.AlignCenter)
        self.title_label.setStyleSheet('QLabel{font-size:18px;font-weight:bold}')

        xax = RotateAxisItem(orientation='bottom')
        xax.setHeight(h=80)
        self.pw = pg.PlotWidget(axisItems={'bottom': xax})
        self.pw.setMouseEnabled(x=True, y=False)
        # self.pw.enableAutoRange(x=False,y=True)
        self.pw.setAutoVisible(x=False, y=True)

        layout = QtWidgets.QVBoxLayout()
        layout.addWidget(self.title_label)
        layout.addLayout(layout_date)
        layout.addLayout(layout_duration)
        layout.addWidget(self.pw)
        self.setLayout(layout)
        pass
    def set_data(self,data:Dict[str,Any]):
        title_str = data['title_str']
        whole_header = data['whole_header']
        whole_df = data['whole_df']
        whole_pd_header = data['whole_pd_header']

        self.whole_header = whole_header
        self.whole_df = whole_df
        self.whole_pd_header = whole_pd_header

        self.title_label.setText(title_str)
        self.whole_duration_label.setText(f"原始最宽边界:{self.whole_df.iloc[0]['tradeDate']}~{self.whole_df.iloc[-1]['tradeDate']}")

        self.current_whole_df = self.whole_df.copy()
        self.caculate_and_show_data()
        pass
    def caculate_and_show_data(self):
        df = self.current_whole_df.copy()
        df.reset_index(inplace=True)
        tradeDate_list = df['tradeDate'].values.tolist()
        x = range(len(df))
        xTick_show = []
        x_dur = math.ceil(len(df)/20)
        for i in range(0,len(df),x_dur):
            xTick_show.append((i,tradeDate_list[i]))
        if len(df)%20 != 0:
            xTick_show.append((len(df)-1,tradeDate_list[-1]))
        candle_data = []
        for i,row in df.iterrows():
            candle_data.append((i,row['openPrice'],row['closePrice'],row['lowestPrice'],row['highestPrice']))

        self.current_whole_data = df.loc[:,self.whole_pd_header].values.tolist()
        # 开始配置显示的内容
        self.pw.clear()

        self.now_duration_label.setText(f"当前显示最宽边界:{df.iloc[0]['tradeDate']}~{df.iloc[-1]['tradeDate']}")

        xax = self.pw.getAxis('bottom')
        xax.setTicks([xTick_show])

        candle_fixed_target = CandlestickItem(candle_data)
        self.main_fixed_target_list.append(candle_fixed_target)
        self.pw.addItem(candle_fixed_target)
        ma5_fixed_target = pg.PlotCurveItem(x=np.array(x), y=np.array(df['ma5'].values.tolist()),
                                            pen=pg.mkPen({'color': self.color_ma_5, 'width': 2}),
                                            connect='finite')
        ma10_fixed_target = pg.PlotCurveItem(x=np.array(x), y=np.array(df['ma10'].values.tolist()),
                                            pen=pg.mkPen({'color': self.color_ma_10, 'width': 2}),
                                            connect='finite')
        ma20_fixed_target = pg.PlotCurveItem(x=np.array(x), y=np.array(df['ma20'].values.tolist()),
                                            pen=pg.mkPen({'color': self.color_ma_20, 'width': 2}),
                                            connect='finite')
        ma30_fixed_target = pg.PlotCurveItem(x=np.array(x), y=np.array(df['ma30'].values.tolist()),
                                            pen=pg.mkPen({'color': self.color_ma_30, 'width': 2}),
                                            connect='finite')
        ma60_fixed_target = pg.PlotCurveItem(x=np.array(x), y=np.array(df['ma60'].values.tolist()),
                                            pen=pg.mkPen({'color': self.color_ma_60, 'width': 2}),
                                            connect='finite')
        self.main_fixed_target_list.append(ma5_fixed_target)
        self.main_fixed_target_list.append(ma10_fixed_target)
        self.main_fixed_target_list.append(ma20_fixed_target)
        self.main_fixed_target_list.append(ma30_fixed_target)
        self.main_fixed_target_list.append(ma60_fixed_target)
        self.pw.addItem(ma5_fixed_target)
        self.pw.addItem(ma10_fixed_target)
        self.pw.addItem(ma20_fixed_target)
        self.pw.addItem(ma30_fixed_target)
        self.pw.addItem(ma60_fixed_target)

        self.vLine = pg.InfiniteLine(angle=90, movable=False)
        self.hLine = pg.InfiniteLine(angle=0, movable=False)
        self.label = pg.TextItem()

        self.pw.addItem(self.vLine, ignoreBounds=True)
        self.pw.addItem(self.hLine, ignoreBounds=True)
        self.pw.addItem(self.label, ignoreBounds=True)

        self.vb = self.pw.getViewBox()
        self.proxy = pg.SignalProxy(self.pw.scene().sigMouseMoved, rateLimit=60, slot=self.mouseMoved)
        self.pw.enableAutoRange()

        pass

    def mouseMoved(self,evt):
        pos = evt[0]
        if self.pw.sceneBoundingRect().contains(pos):
            mousePoint = self.vb.mapSceneToView(pos)
            index = int(mousePoint.x())
            if index>=0 and index<len(self.current_whole_data):
                target_data = self.current_whole_data[index]
                html_str = ''
                for i,item in enumerate(self.whole_header):
                    html_str += f"<br/>{item}:{target_data[i]}"
                self.label.setHtml(html_str)
                self.label.setPos(mousePoint.x(),mousePoint.y())
            self.vLine.setPos(mousePoint.x())
            self.hLine.setPos(mousePoint.y())
        pass
    def mouseClicked(self,evt):
        pass
    def updateViews(self):
        pass

    # 图形操作之外
    def duration_sel_btn_clicked(self):
        '''边界选择'''
        left_point = self.left_point.date().toString('yyyy-MM-dd')
        right_point = self.right_point.date().toString('yyyy-MM-dd')
        df = self.whole_df.copy()
        df['o_date'] = pd.to_datetime(df['tradeDate'])
        self.current_whole_df = df.loc[(df['o_date']>=left_point) & (df['o_date']<=right_point)].copy()
        self.caculate_and_show_data()
        pass
    def duration_reset_btn_clicked(self):
        '''边界重置'''
        self.current_whole_df = self.whole_df.copy()
        self.caculate_and_show_data()
        pass
    pass
使用
if __name__ == '__main__':
    # 先显示蜡烛图
    # 600660  福耀玻璃
    import pandas as pd
    import math
    import talib
    df = pd.read_csv('E:/temp005/600660.csv',encoding='utf-8')
    # 删除停牌的数据
    df = df.loc[df['openPrice']>0].copy()
    df['openPrice'] = df['openPrice']*df['accumAdjFactor']
    df['closePrice'] = df['closePrice']*df['accumAdjFactor']
    df['highestPrice'] = df['highestPrice']*df['accumAdjFactor']
    df['lowestPrice'] = df['lowestPrice']*df['accumAdjFactor']

    # 计算均线
    close_list = df['closePrice']
    df['ma5'] = talib.MA(close_list,5)
    df['ma10'] = talib.MA(close_list,10)
    df['ma20'] = talib.MA(close_list,20)
    df['ma30'] = talib.MA(close_list,30)
    df['ma60'] = talib.MA(close_list,60)

    whole_pd_header = ['tradeDate','closePrice','openPrice','highestPrice','lowestPrice','ma5','ma10','ma20','ma30','ma60']

    line_data = {
        'title_str':'福耀玻璃',
        'whole_header':['日期','收盘价','开盘价','最高价','最低价','ma5','ma10','ma20','ma30','ma60'],
        'whole_pd_header':whole_pd_header,
        'whole_df':df.loc[:,whole_pd_header]
    }

    app = QtWidgets.QApplication(sys.argv)
    t_win = PyQtGraphLineWidget()
    t_win.show()
    t_win.set_data(line_data)
    sys.exit(app.exec_())
    pass
运行后:
数据
链接:https://pan.baidu.com/s/1HPkMsDDyXTEgffoAVIhbZw
提取码:h80x


 1万+
1万+


 被折叠的 条评论
为什么被折叠?
被折叠的 条评论
为什么被折叠?
 到【灌水乐园】发言


