


下图为四分位图,又称箱图;在数据分析中经常采用箱图作为特征选取一种方式。
快速解释分位图:
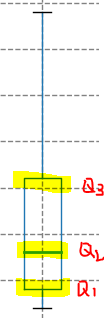
第一四分位数(Q1),又称“较小四分位数”,等于该样本中所有数值由小到大排列后第25%的数字。
第二四分位数 (Q2),又称“中位数”,等于该样本中所有数值由小到大排列后第50%的数字。
第三四分位数 (Q3),又称“较大四分位数”,等于该样本中所有数值由小到大排列后第75%的数字。
python箱图:
def DrawMultBoxPic(input_dict, Y_label):

    dict_list_length = []
    for item in input_dict:
        value = np.percentile(input_dict[item], (25, 50, 75), interpolation='midpoint')
        print("分位点=======> ", item)
        print("num25: ", value[0])
        print("num50: ", value[1])
        print("num75: ", value[2])
        temp_length = len(input_dict[item])
        dict_list_length.append(temp_length)

    # 获取最长列表长度
    max_length = max(dict_list_length)
    # 每个列表在后面追加None
    for item in input_dict:
        diff_length = max_length - len(input_dict[item])
        if diff_length > 0:
            for i in range(diff_length):
                input_dict[item].append(None)
    # 绘制箱型图
    zhfont = FontProperties(fname='./fontLib/simsunttc/simsun.ttc', size=22)
    data = pd.DataFrame.from_dict(input_dict)
    medianprops = dict(linestyle='-', linewidth=2, color='red')
    data.boxplot(medianprops=medianprops)
    plt.axis([0, 4, 0, 5])
    plt.grid(axis='y', ls='--', lw=1, color='grey', alpha=3.)
    plt.grid(axis='x', ls='--', lw=1, color='grey', alpha=3.)
    plt.xlabel(u'特征对比',  fontproperties=zhfont)
    plt.ylabel(Y_label,  fontproperties=zhfont)
    plt.title(Y_label,  fontproperties=zhfont)
    imgname = './build_images/' + Y_label + '.png'
    plt.savefig(imgname, bbox_inches='tight')
    plt.show()

if __name__ == "__main__":
	   data = {
	            'col1': [1,2,3,4,5],
	            'col2': [2,3,4,5,6,7]
	            }
	    # 该模块可以对不同长度的列表做箱图进行比较,代码仅供分享。
	   	DrawMultBoxPic(data,"box_sample")


 1万+
1万+


 被折叠的 条评论
为什么被折叠?
被折叠的 条评论
为什么被折叠?
 到【灌水乐园】发言


