


library(ggVennDiagram)
library(ggplot2)
genes <- paste0("gene",1:1000)
set.seed(20210701)
gene_list <- list(A = sample(genes,100),
B = sample(genes,200),
C = sample(genes,300),
D = sample(genes,200))
# construct a Venn object
venn = Venn(gene_list)
data = process_data(venn, shape_id == "401f")
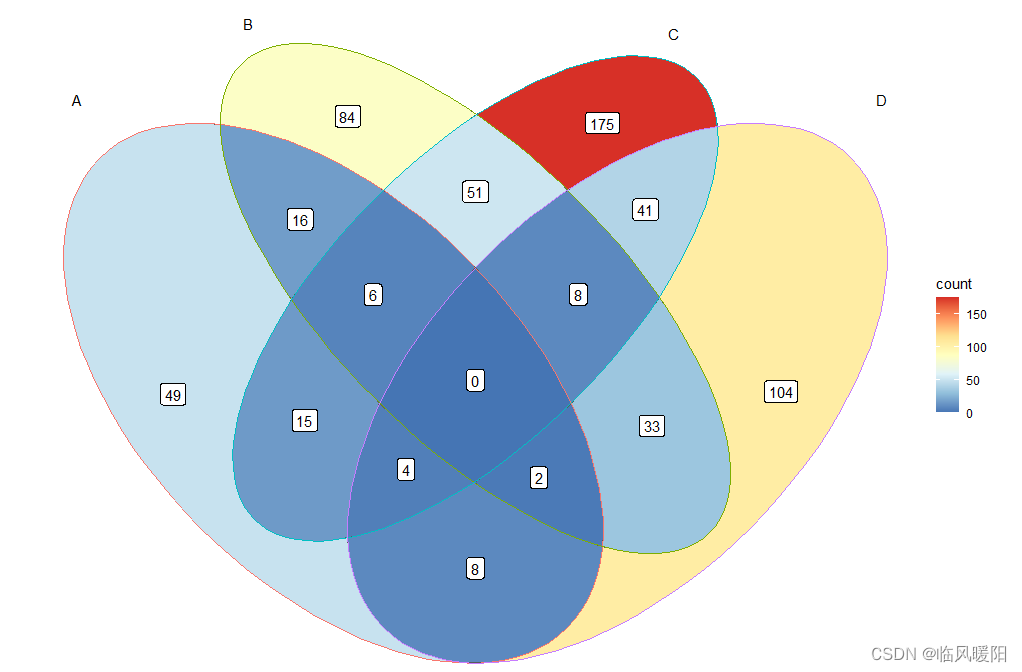
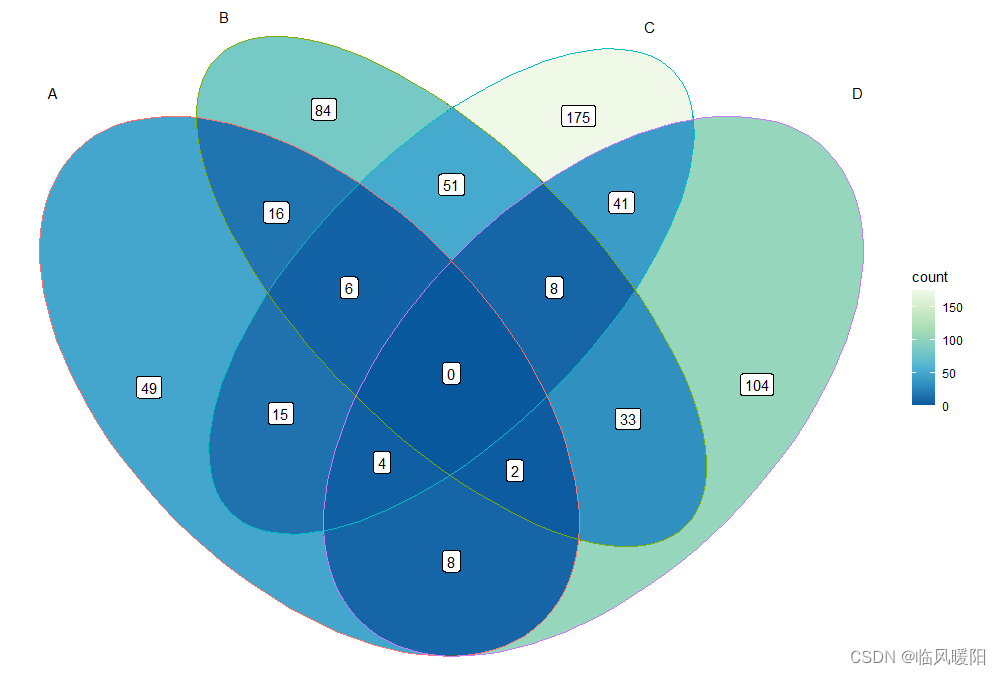
ggplot() +
geom_sf(aes(fill = count), data = venn_region(data)) +
geom_sf(aes(color = id), data = venn_setedge(data), show.legend = FALSE) +
geom_sf_text(aes(label = name), data = venn_setlabel(data)) +
geom_sf_label(aes(label = count), data = venn_region(data)) +
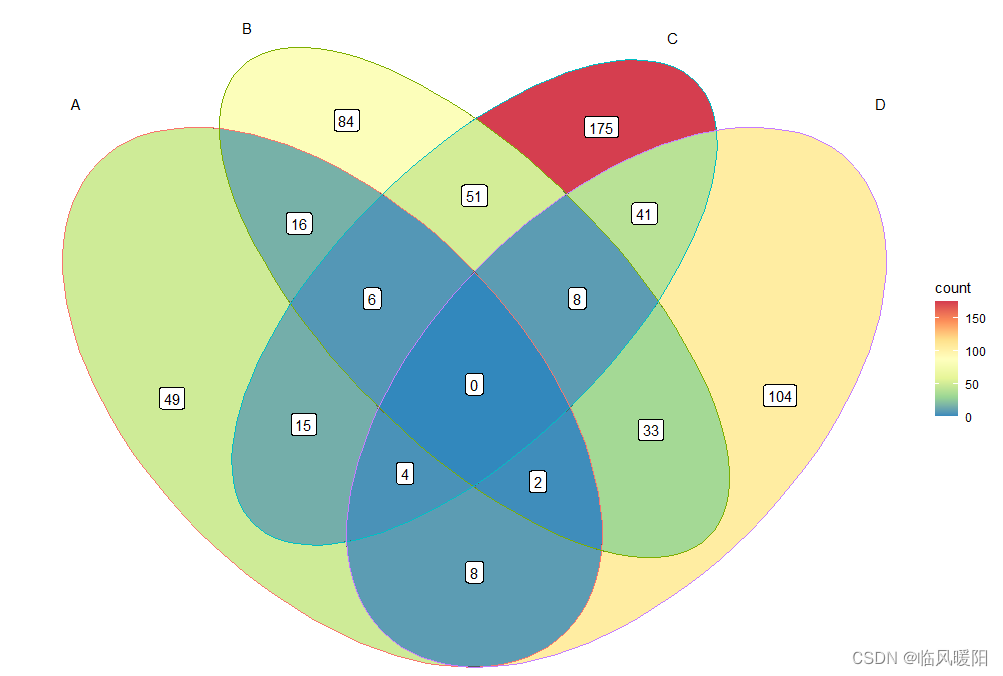
theme_void()+ scale_fill_distiller(palette = "Blues")

ggplot() +
  geom_sf(aes(fill = count), data = venn_region(data)) +
  geom_sf(aes(color = id), data = venn_setedge(data), show.legend = FALSE) +
  geom_sf_text(aes(label = name), data = venn_setlabel(data)) +
  geom_sf_label(aes(label = count), data = venn_region(data)) +
  theme_void()+ scale_fill_distiller(palette = "Set1")

ggplot() +
geom_sf(aes(fill = count), data = venn_region(data)) +
geom_sf(aes(color = id), data = venn_setedge(data), show.legend = FALSE) +
geom_sf_text(aes(label = name), data = venn_setlabel(data)) +
geom_sf_label(aes(label = count), data = venn_region(data)) +
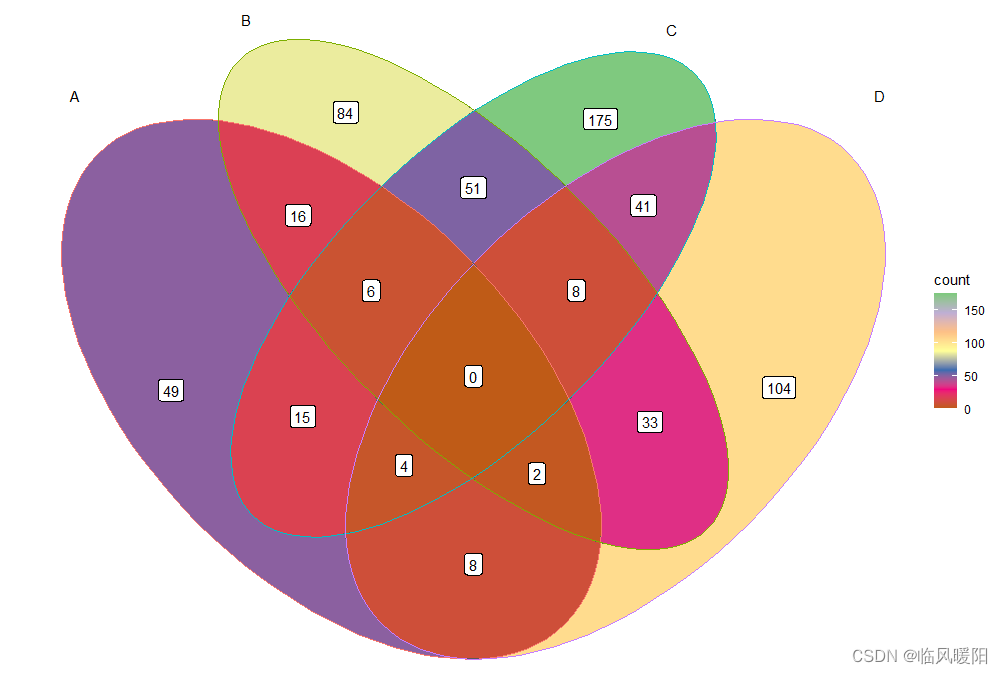
theme_void()+ scale_fill_distiller(palette = "Set2")
ggplot() +
  geom_sf(aes(fill = count), data = venn_region(data)) +
  geom_sf(aes(color = id), data = venn_setedge(data), show.legend = FALSE) +
  geom_sf_text(aes(label = name), data = venn_setlabel(data)) +
  geom_sf_label(aes(label = count), data = venn_region(data)) +
  theme_void()+ scale_fill_distiller(palette = "Set3")

ggplot() +
geom_sf(aes(fill = count), data = venn_region(data)) +
geom_sf(aes(color = id), data = venn_setedge(data), show.legend = FALSE) +
geom_sf_text(aes(label = name), data = venn_setlabel(data)) +
geom_sf_label(aes(label = count), data = venn_region(data)) +
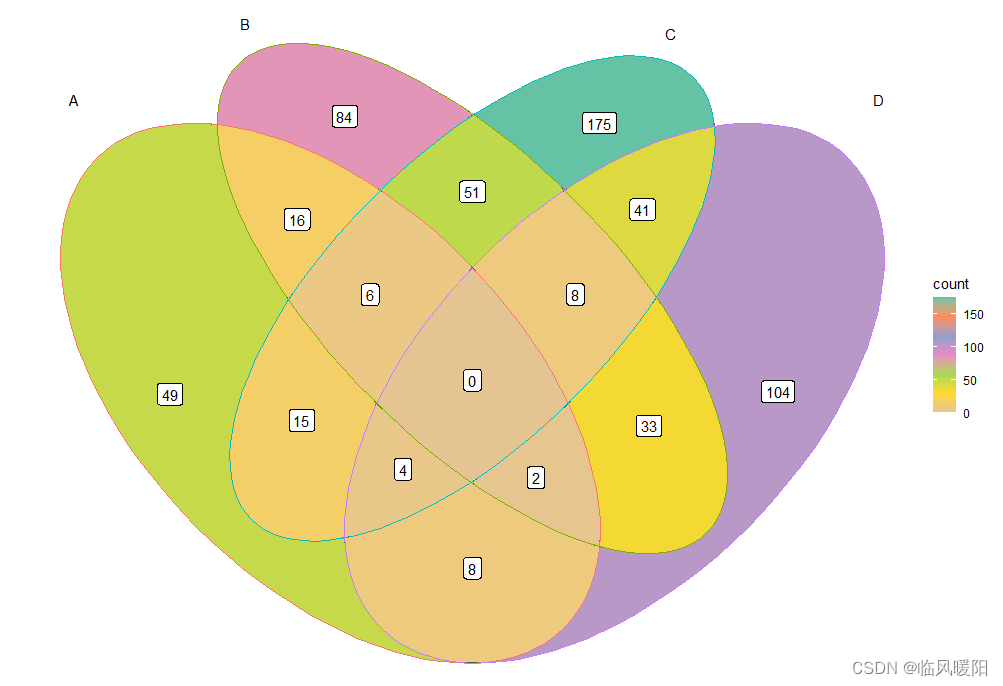
theme_void()+ scale_fill_distiller(palette = "Pastel1")
ggplot() +
geom_sf(aes(fill = count), data = venn_region(data)) +
geom_sf(aes(color = id), data = venn_setedge(data), show.legend = FALSE) +
geom_sf_text(aes(label = name), data = venn_setlabel(data)) +
geom_sf_label(aes(label = count), data = venn_region(data)) +
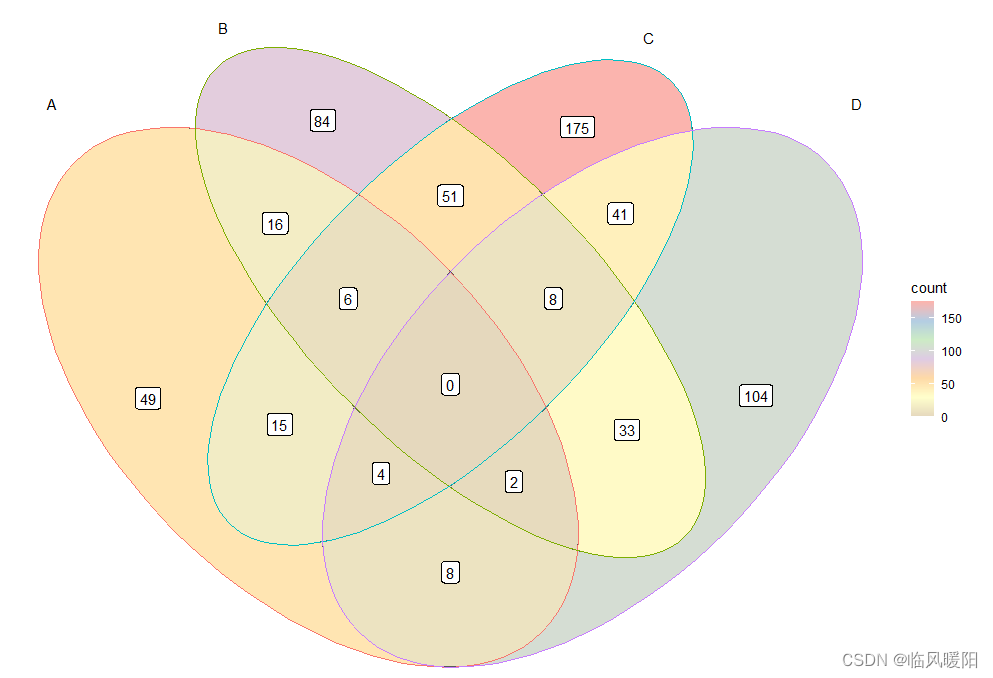
theme_void()+ scale_fill_distiller(palette = "Pastel2")

ggplot() +
  geom_sf(aes(fill = count), data = venn_region(data)) +
  geom_sf(aes(color = id), data = venn_setedge(data), show.legend = FALSE) +
  geom_sf_text(aes(label = name), data = venn_setlabel(data)) +
  geom_sf_label(aes(label = count), data = venn_region(data)) +
  theme_void()+ scale_fill_distiller(palette = "Paired")

ggplot() +
  geom_sf(aes(fill = count), data = venn_region(data)) +
  geom_sf(aes(color = id), data = venn_setedge(data), show.legend = FALSE) +
  geom_sf_text(aes(label = name), data = venn_setlabel(data)) +
  geom_sf_label(aes(label = count), data = venn_region(data)) +
  theme_void()+ scale_fill_distiller(palette = "Dark2")

ggplot() +
  geom_sf(aes(fill = count), data = venn_region(data)) +
  geom_sf(aes(color = id), data = venn_setedge(data), show.legend = FALSE) +
  geom_sf_text(aes(label = name), data = venn_setlabel(data)) +
  geom_sf_label(aes(label = count), data = venn_region(data)) +
  theme_void()+ scale_fill_distiller(palette = "Accent")
ggplot() +
  geom_sf(aes(fill = count), data = venn_region(data)) +
  geom_sf(aes(color = id), data = venn_setedge(data), show.legend = FALSE) +
  geom_sf_text(aes(label = name), data = venn_setlabel(data)) +
  geom_sf_label(aes(label = count), data = venn_region(data)) +
  theme_void()+ scale_fill_distiller(palette = "Spectral")
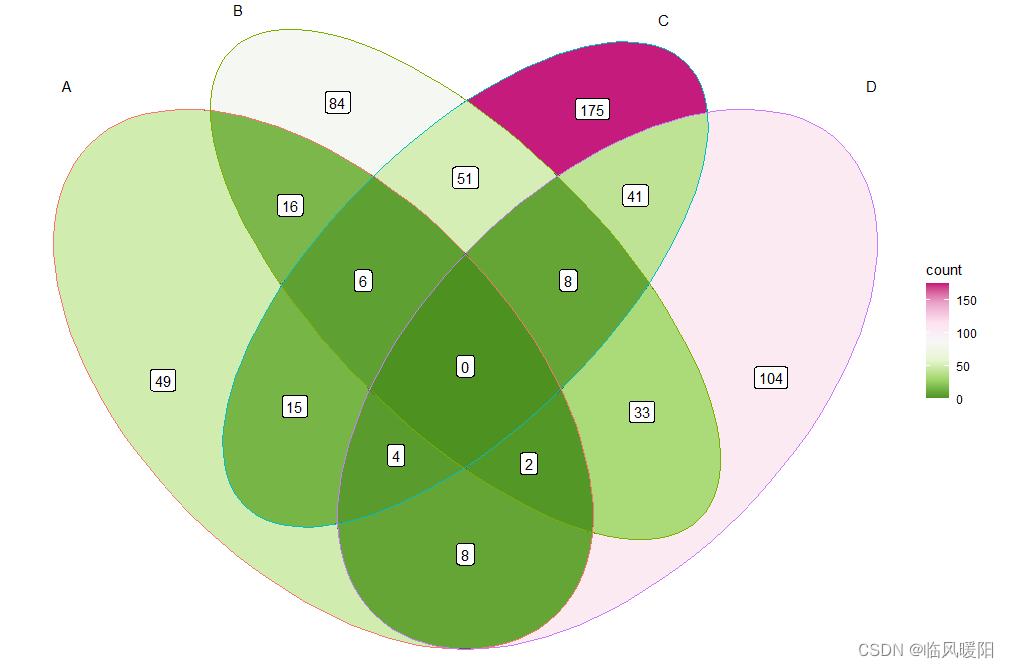
ggplot() +
  geom_sf(aes(fill = count), data = venn_region(data)) +
  geom_sf(aes(color = id), data = venn_setedge(data), show.legend = FALSE) +
  geom_sf_text(aes(label = name), data = venn_setlabel(data)) +
  geom_sf_label(aes(label = count), data = venn_region(data)) +
  theme_void()+ scale_fill_distiller(palette = "RdYlGn")

ggplot() +
  geom_sf(aes(fill = count), data = venn_region(data)) +
  geom_sf(aes(color = id), data = venn_setedge(data), show.legend = FALSE) +
  geom_sf_text(aes(label = name), data = venn_setlabel(data)) +
  geom_sf_label(aes(label = count), data = venn_region(data)) +
  theme_void()+ scale_fill_distiller(palette = "RdYlBu")
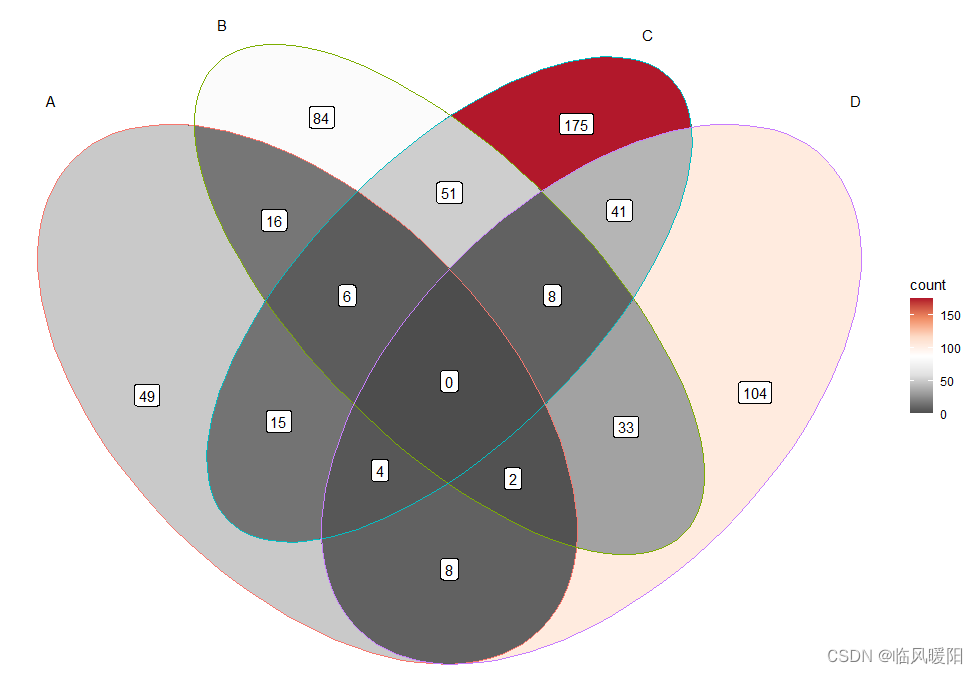
ggplot() +
  geom_sf(aes(fill = count), data = venn_region(data)) +
  geom_sf(aes(color = id), data = venn_setedge(data), show.legend = FALSE) +
  geom_sf_text(aes(label = name), data = venn_setlabel(data)) +
  geom_sf_label(aes(label = count), data = venn_region(data)) +
  theme_void()+ scale_fill_distiller(palette = "RdGy")
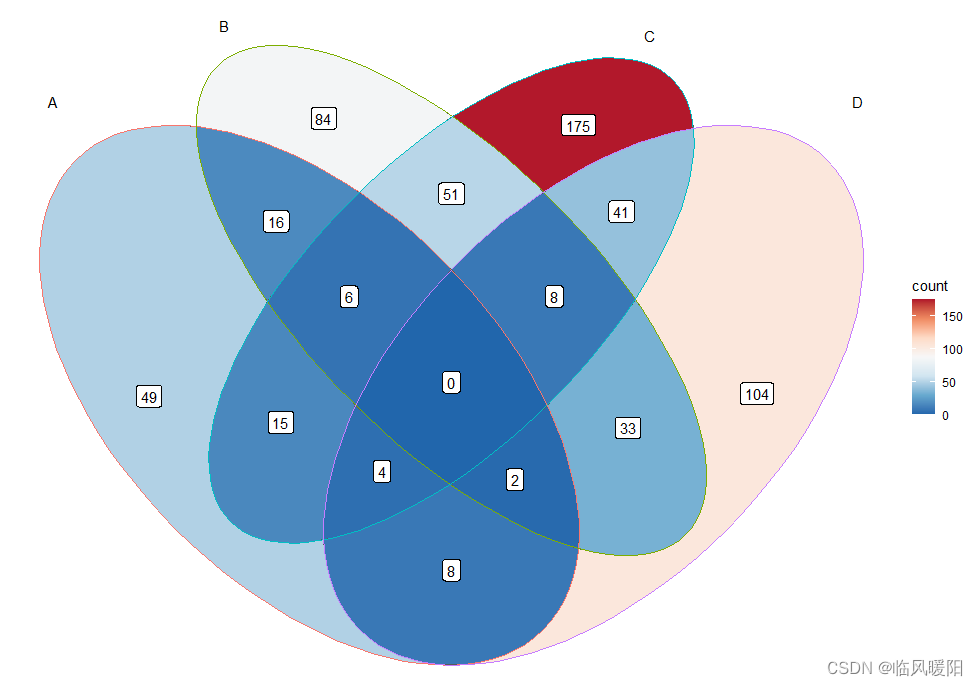
ggplot() +
  geom_sf(aes(fill = count), data = venn_region(data)) +
  geom_sf(aes(color = id), data = venn_setedge(data), show.legend = FALSE) +
  geom_sf_text(aes(label = name), data = venn_setlabel(data)) +
  geom_sf_label(aes(label = count), data = venn_region(data)) +
  theme_void()+ scale_fill_distiller(palette = "RdBu")
ggplot() +
  geom_sf(aes(fill = count), data = venn_region(data)) +
  geom_sf(aes(color = id), data = venn_setedge(data), show.legend = FALSE) +
  geom_sf_text(aes(label = name), data = venn_setlabel(data)) +
  geom_sf_label(aes(label = count), data = venn_region(data)) +
  theme_void()+ scale_fill_distiller(palette = "PuOr")

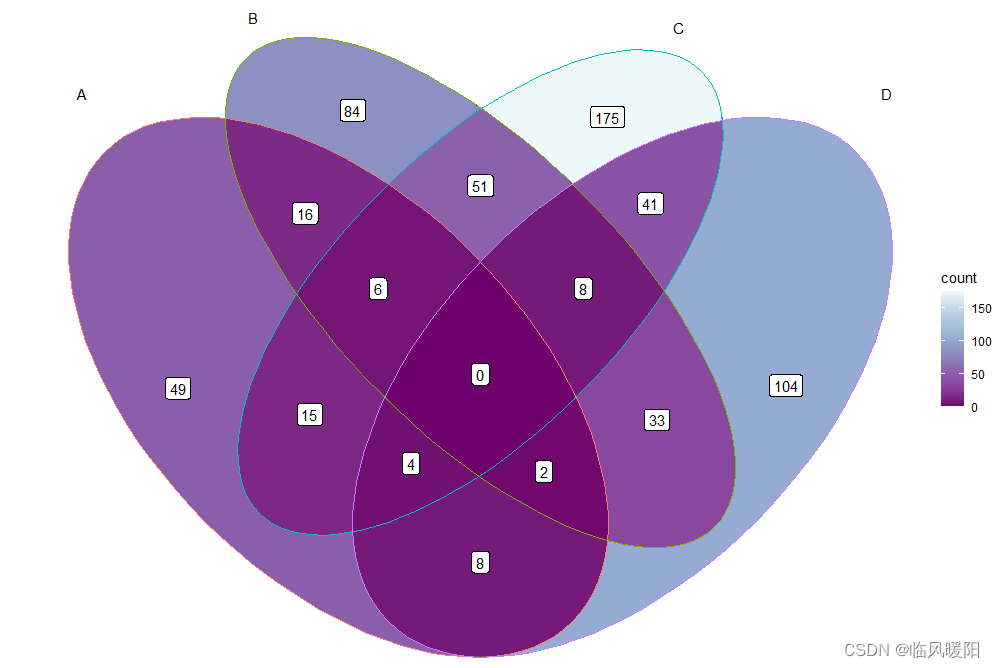
ggplot() +
  geom_sf(aes(fill = count), data = venn_region(data)) +
  geom_sf(aes(color = id), data = venn_setedge(data), show.legend = FALSE) +
  geom_sf_text(aes(label = name), data = venn_setlabel(data)) +
  geom_sf_label(aes(label = count), data = venn_region(data)) +
  theme_void()+ scale_fill_distiller(palette = "PRGn")
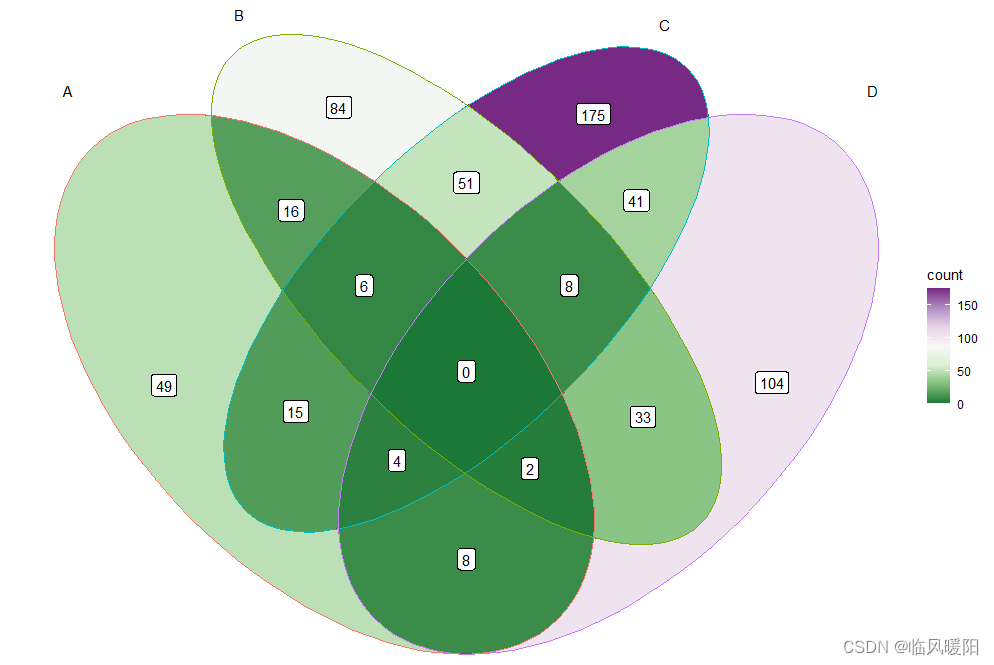
ggplot() +
  geom_sf(aes(fill = count), data = venn_region(data)) +
  geom_sf(aes(color = id), data = venn_setedge(data), show.legend = FALSE) +
  geom_sf_text(aes(label = name), data = venn_setlabel(data)) +
  geom_sf_label(aes(label = count), data = venn_region(data)) +
  theme_void()+ scale_fill_distiller(palette = "PiYG")
ggplot() +
  geom_sf(aes(fill = count), data = venn_region(data)) +
  geom_sf(aes(color = id), data = venn_setedge(data), show.legend = FALSE) +
  geom_sf_text(aes(label = name), data = venn_setlabel(data)) +
  geom_sf_label(aes(label = count), data = venn_region(data)) +
  theme_void()+ scale_fill_distiller(palette = "BrBG")
ggplot() +
  geom_sf(aes(fill = count), data = venn_region(data)) +
  geom_sf(aes(color = id), data = venn_setedge(data), show.legend = FALSE) +
  geom_sf_text(aes(label = name), data = venn_setlabel(data)) +
  geom_sf_label(aes(label = count), data = venn_region(data)) +
  theme_void()+ scale_fill_distiller(palette = "YlOrRd")

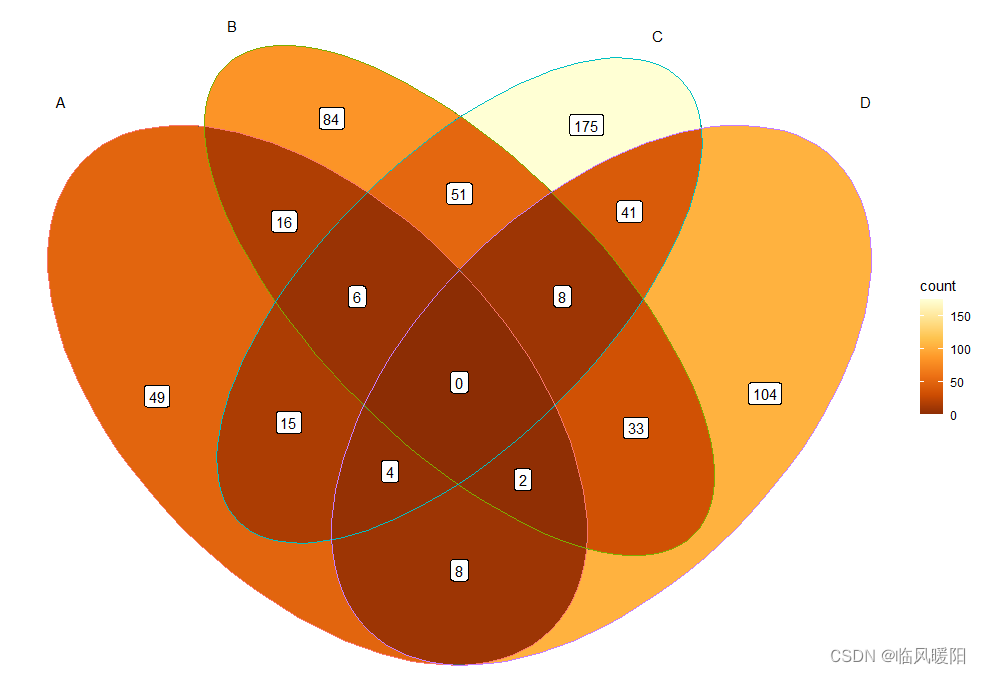
ggplot() +
  geom_sf(aes(fill = count), data = venn_region(data)) +
  geom_sf(aes(color = id), data = venn_setedge(data), show.legend = FALSE) +
  geom_sf_text(aes(label = name), data = venn_setlabel(data)) +
  geom_sf_label(aes(label = count), data = venn_region(data)) +
  theme_void()+ scale_fill_distiller(palette = "YlOrBr")
ggplot() +
  geom_sf(aes(fill = count), data = venn_region(data)) +
  geom_sf(aes(color = id), data = venn_setedge(data), show.legend = FALSE) +
  geom_sf_text(aes(label = name), data = venn_setlabel(data)) +
  geom_sf_label(aes(label = count), data = venn_region(data)) +
  theme_void()+ scale_fill_distiller(palette = "YlGnBu")

ggplot() +
  geom_sf(aes(fill = count), data = venn_region(data)) +
  geom_sf(aes(color = id), data = venn_setedge(data), show.legend = FALSE) +
  geom_sf_text(aes(label = name), data = venn_setlabel(data)) +
  geom_sf_label(aes(label = count), data = venn_region(data)) +
  theme_void()+ scale_fill_distiller(palette = "YlGn")

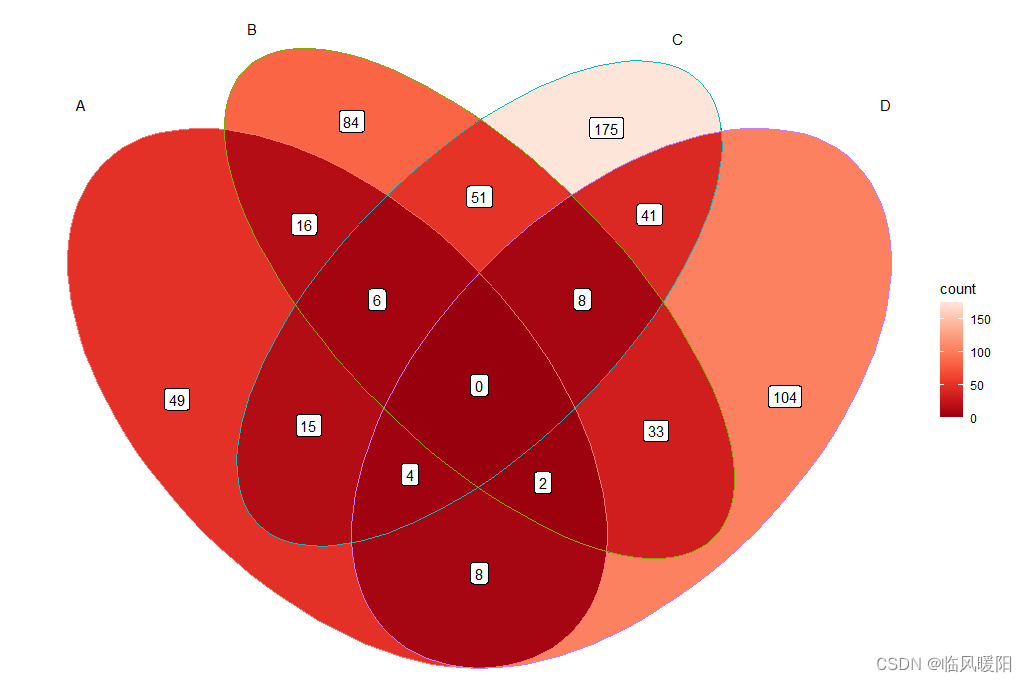
ggplot() +
geom_sf(aes(fill = count), data = venn_region(data)) +
geom_sf(aes(color = id), data = venn_setedge(data), show.legend = FALSE) +
geom_sf_text(aes(label = name), data = venn_setlabel(data)) +
geom_sf_label(aes(label = count), data = venn_region(data)) +
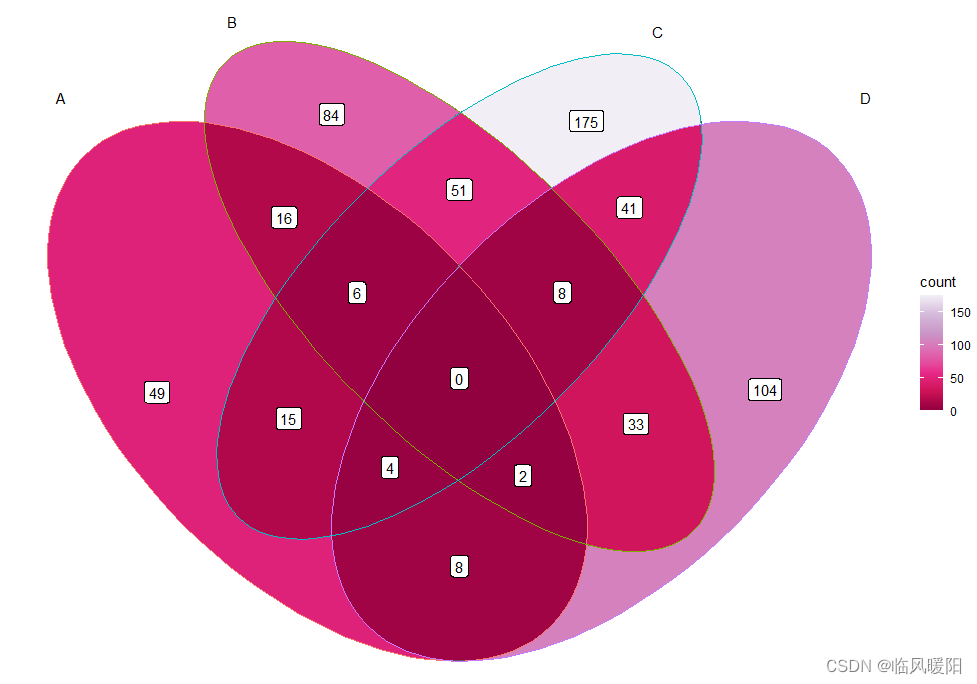
theme_void()+ scale_fill_distiller(palette = "Reds")
ggplot() +
  geom_sf(aes(fill = count), data = venn_region(data)) +
  geom_sf(aes(color = id), data = venn_setedge(data), show.legend = FALSE) +
  geom_sf_text(aes(label = name), data = venn_setlabel(data)) +
  geom_sf_label(aes(label = count), data = venn_region(data)) +
  theme_void()+ scale_fill_distiller(palette = "RdPu")

ggplot() +
  geom_sf(aes(fill = count), data = venn_region(data)) +
  geom_sf(aes(color = id), data = venn_setedge(data), show.legend = FALSE) +
  geom_sf_text(aes(label = name), data = venn_setlabel(data)) +
  geom_sf_label(aes(label = count), data = venn_region(data)) +
  theme_void()+ scale_fill_distiller(palette = "Purples")

ggplot() +
  geom_sf(aes(fill = count), data = venn_region(data)) +
  geom_sf(aes(color = id), data = venn_setedge(data), show.legend = FALSE) +
  geom_sf_text(aes(label = name), data = venn_setlabel(data)) +
  geom_sf_label(aes(label = count), data = venn_region(data)) +
  theme_void()+ scale_fill_distiller(palette = "PuRd")
ggplot() +
  geom_sf(aes(fill = count), data = venn_region(data)) +
  geom_sf(aes(color = id), data = venn_setedge(data), show.legend = FALSE) +
  geom_sf_text(aes(label = name), data = venn_setlabel(data)) +
  geom_sf_label(aes(label = count), data = venn_region(data)) +
  theme_void()+ scale_fill_distiller(palette = "PuBuGn")
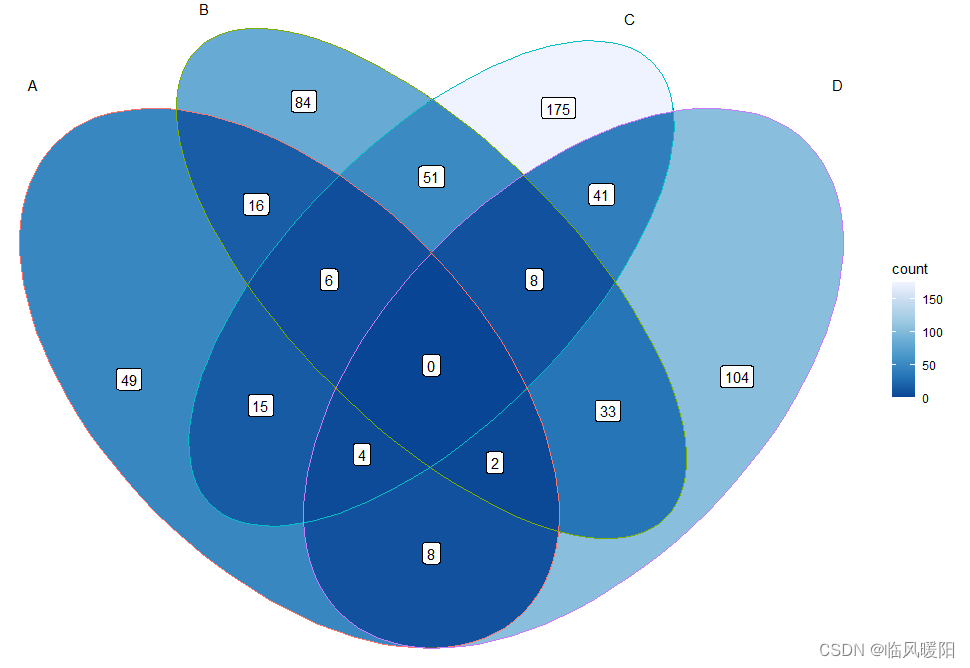
ggplot() +
  geom_sf(aes(fill = count), data = venn_region(data)) +
  geom_sf(aes(color = id), data = venn_setedge(data), show.legend = FALSE) +
  geom_sf_text(aes(label = name), data = venn_setlabel(data)) +
  geom_sf_label(aes(label = count), data = venn_region(data)) +
  theme_void()+ scale_fill_distiller(palette = "PuBu")

ggplot() +
geom_sf(aes(fill = count), data = venn_region(data)) +
geom_sf(aes(color = id), data = venn_setedge(data), show.legend = FALSE) +
geom_sf_text(aes(label = name), data = venn_setlabel(data)) +
geom_sf_label(aes(label = count), data = venn_region(data)) +
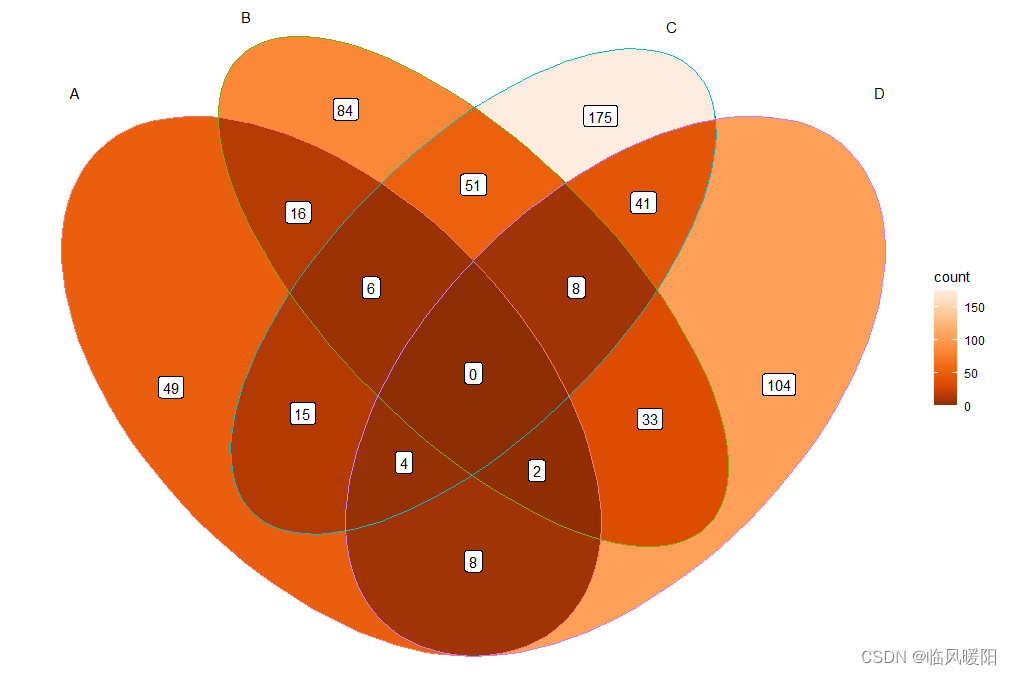
theme_void()+ scale_fill_distiller(palette = "OrRd")

ggplot() +
  geom_sf(aes(fill = count), data = venn_region(data)) +
  geom_sf(aes(color = id), data = venn_setedge(data), show.legend = FALSE) +
  geom_sf_text(aes(label = name), data = venn_setlabel(data)) +
  geom_sf_label(aes(label = count), data = venn_region(data)) +
  theme_void()+ scale_fill_distiller(palette = "Oranges")
ggplot() +
  geom_sf(aes(fill = count), data = venn_region(data)) +
  geom_sf(aes(color = id), data = venn_setedge(data), show.legend = FALSE) +
  geom_sf_text(aes(label = name), data = venn_setlabel(data)) +
  geom_sf_label(aes(label = count), data = venn_region(data)) +
  theme_void()+ scale_fill_distiller(palette = "Greys")
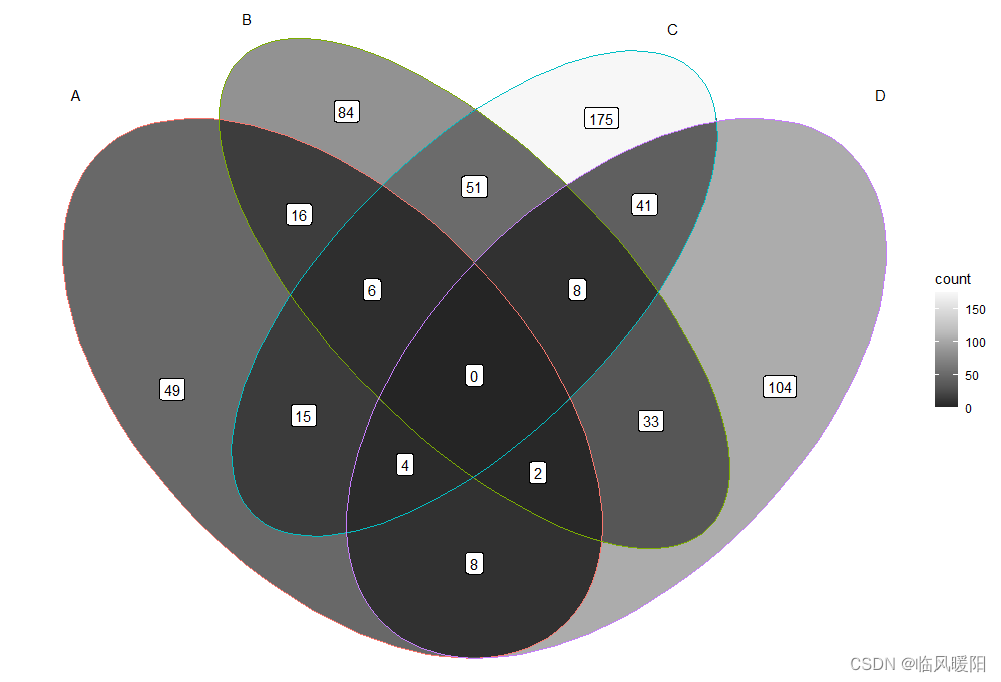
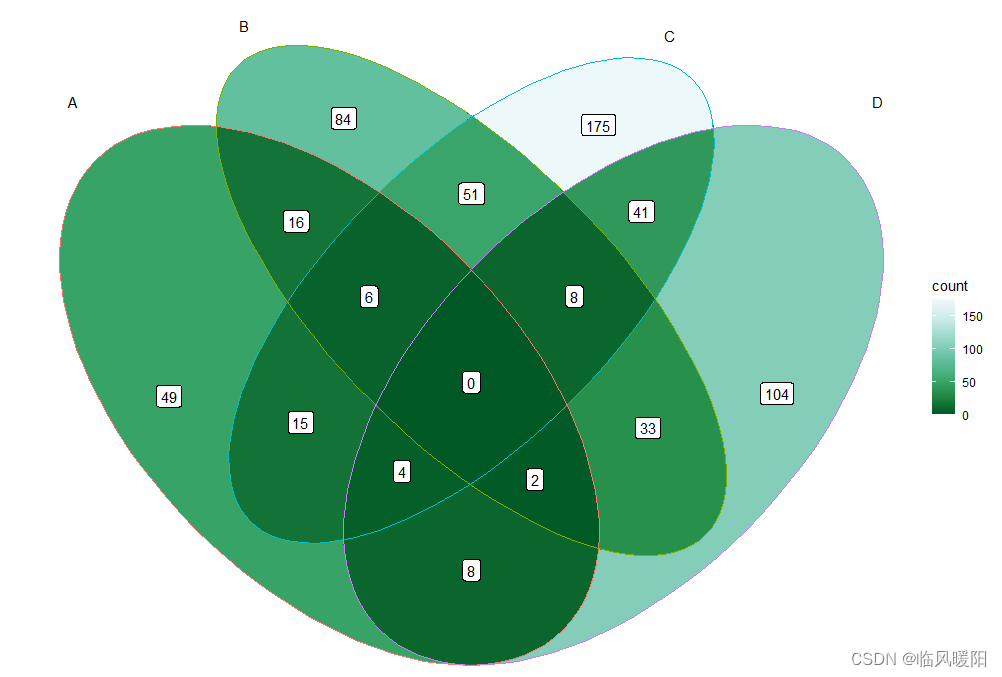
ggplot() +
  geom_sf(aes(fill = count), data = venn_region(data)) +
  geom_sf(aes(color = id), data = venn_setedge(data), show.legend = FALSE) +
  geom_sf_text(aes(label = name), data = venn_setlabel(data)) +
  geom_sf_label(aes(label = count), data = venn_region(data)) +
  theme_void()+ scale_fill_distiller(palette = "Greens")

ggplot() +
  geom_sf(aes(fill = count), data = venn_region(data)) +
  geom_sf(aes(color = id), data = venn_setedge(data), show.legend = FALSE) +
  geom_sf_text(aes(label = name), data = venn_setlabel(data)) +
  geom_sf_label(aes(label = count), data = venn_region(data)) +
  theme_void()+ scale_fill_distiller(palette = "GnBu")
ggplot() +
  geom_sf(aes(fill = count), data = venn_region(data)) +
  geom_sf(aes(color = id), data = venn_setedge(data), show.legend = FALSE) +
  geom_sf_text(aes(label = name), data = venn_setlabel(data)) +
  geom_sf_label(aes(label = count), data = venn_region(data)) +
  theme_void()+ scale_fill_distiller(palette = "BuPu")
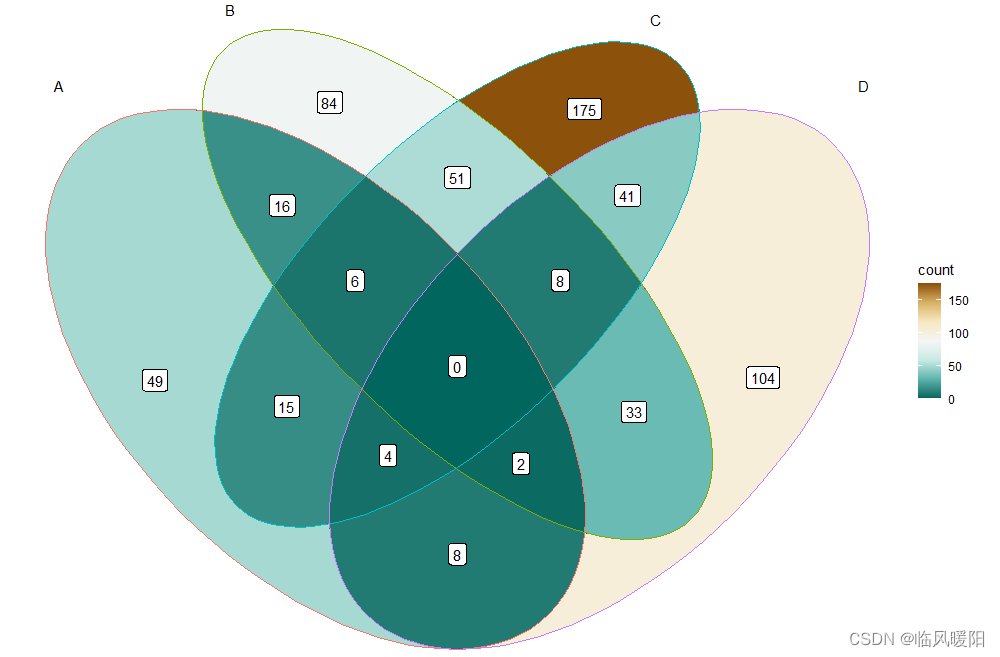
ggplot() +
geom_sf(aes(fill = count), data = venn_region(data)) +
geom_sf(aes(color = id), data = venn_setedge(data), show.legend = FALSE) +
geom_sf_text(aes(label = name), data = venn_setlabel(data)) +
geom_sf_label(aes(label = count), data = venn_region(data)) +
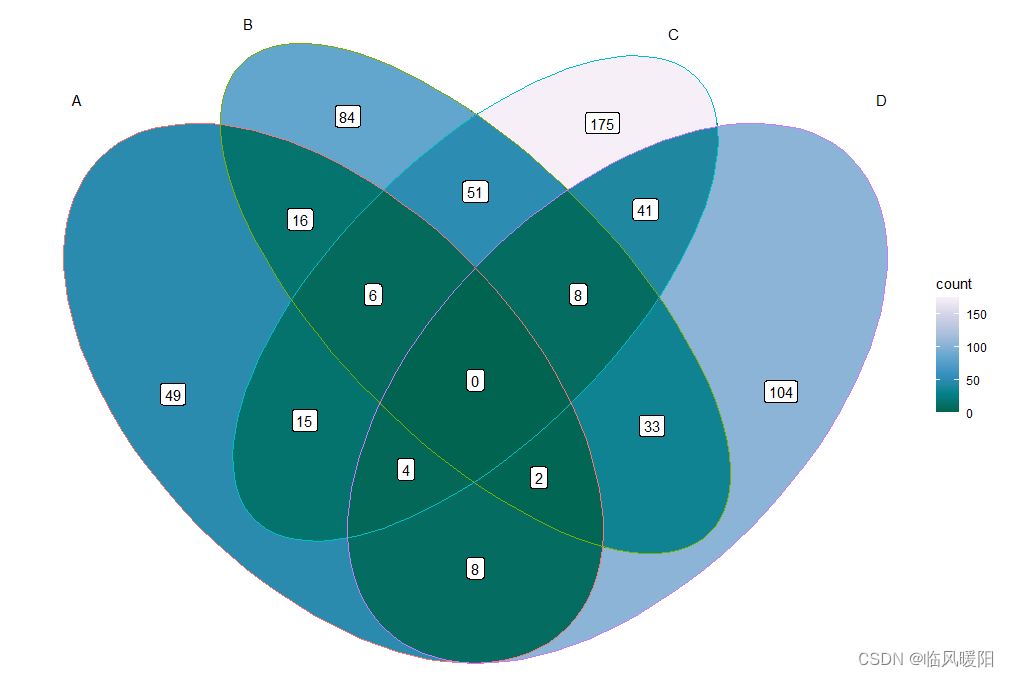
theme_void()+ scale_fill_distiller(palette = "BuGn")
ggplot() +
  geom_sf(aes(fill = count), data = venn_region(data)) +
  geom_sf(aes(color = id), data = venn_setedge(data), show.legend = FALSE) +
  geom_sf_text(aes(label = name), data = venn_setlabel(data)) +
  geom_sf_label(aes(label = count), data = venn_region(data)) +
  theme_void()+ scale_fill_distiller(palette = "Blues")
参考文献:
https://cloud.tencent.com/developer/article/1965941
开发工具:RStudio和微信截屏工具


 395
395


 被折叠的 条评论
为什么被折叠?
被折叠的 条评论
为什么被折叠?
 到【灌水乐园】发言


