


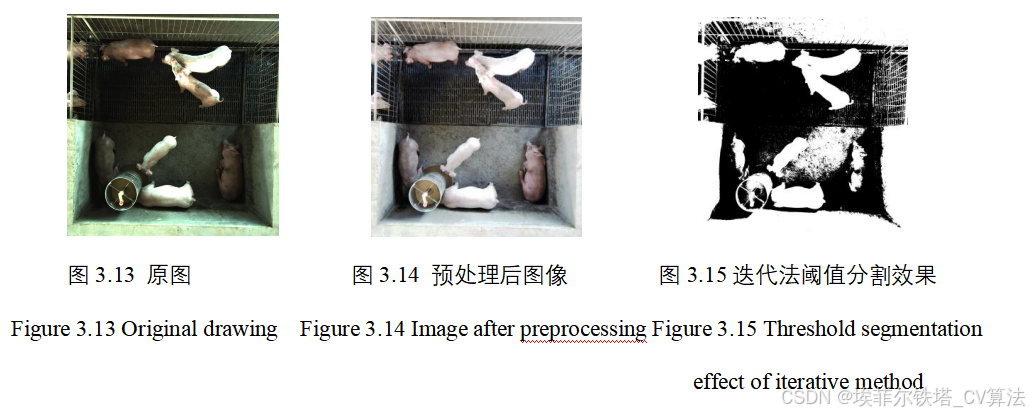
随着人工智能的兴起,身份识别以及行为识别开始逐渐发展起来了,其中特征提取就是十分关键的一步。特征提取分为传统特征提取和深度特征提取,本章着重介绍了传统特征提取。传统特征提取一般提取的是边缘特征、 角特征、颜色特征以及纹理特征等具体特征,具有提取特征具体化、提取速度快、提取效果好等优势。传统特征提取主要有Harris、SIFT、SURF、LBF、HOG、DPM、ORB等方法,这些方法各有各的优势,具体运用那种特征提取方法是根据具体的实际情况而定。接下来主要对LBP以及LDP进行详细介绍。阈值分割其实本质上属于区域分割的范畴。在图像处理中,阈值分割是比较常见的一种分割方式,它特别适用于前景和背景在不同灰度级的情况下。在阈值分割后,前景提取出来了,直接对前景进行处理,这样处理过程的速度也就大大加快了。因为普通的阈值分割的效果直接取决于阈值的选取,而且单阈值很难达到预期的分类效果,针对这一点,我采用局部阈值分割,或者是多阈值,阈值优化算法来对目标进行阈值分割,这样能够适应各种图像,使得整个模型的泛化能力提高。如本章仿真实验分割的效果,局部阈值分割、多阈值以及阈值优化算法比普通的阈值分割效果要好。
3.1 基于LBP的特征提取
局部二值模式(Local Binary Pattern,LBP)最早是由T. Ojala, M.Pietikäinen, 和D. Harwood 在1994年提出的,是对纹理特征进行提取的传统特征提取方法,具有很好的旋转不变性以及灰度不变性的特点,因此被广大研究人员使用。
3.1.1 普通LBP特征提取
LBP通过比较邻域像素点和中心像素点,根据之前设定的阈值,转换成一串二进制数,这一串二进制数值就是我们所要提取的纹理特征。
LBP的原理是通过一个N*N的编码,让编码中心像素值和周围8个像素值进行比较,周围像素值大于中心像素值,记为1,否则的话,记为0,再把得到的二进制数以顺时针的方式排列,最终得到一个二进制串,也就是我们所要提取的纹理特征。提取过程如图3.1所示。
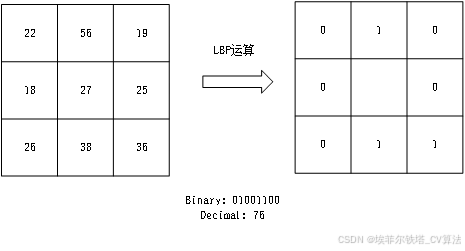
图3.1 LBP计算过程
Figure 3.1 LBP calculation process
LBP算子的数学表达如式(3-1-1)所示。
(3-1-1)
3.1.2 CS-LBP特征提取
针对传统LBP算子计算量大,提取速度相对慢的问题,Uliyan等人提出了中心对称局部二值模式(Center Symmetric-Local Binary Pattern,CS-LBP)[69]。CS-LBP可以减少光照强度的影响,同时可以减少计算量和提高抗噪声的能力。提取局部编码后其中的像素值与其对面的像素值进行比较,大的话,记为1,否则则记为0。计算过程如图3.2所示。
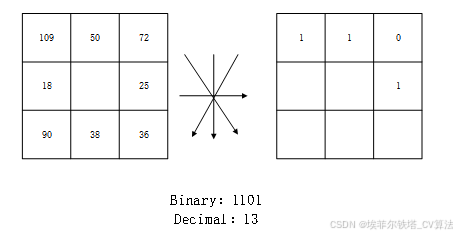
图3.3 CS-LBP计算过程
Figure 3.3 CS-LBP calculation process
CS-LBP的数学表达如下:
(3-1-3)
其中,N表示编码框的大小,T是人为设定的阈值。
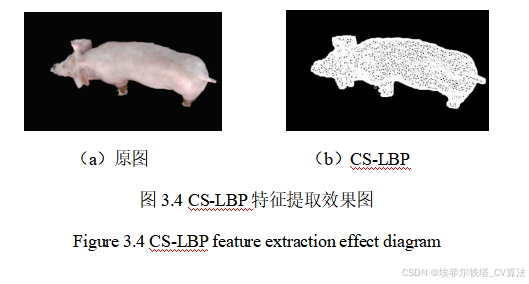
如图3.3所示,二进制串的长度减少了一半,所以计算复杂度减少了,极大地加快了运算速度,同时较传统LBP而言,精度也没有下降,所以CS-LBP更值得我们用来特征提取。图3.4是CS-LBP特征提取的效果图。
3.2基于LDP特征提取
局部方向模式(Local Directional Pattern,LDP)最早是在2010年,由Jabid等人提出的一种人脸特征识别算法。LDP其实是LBP算法的一种改进,LBP受光照影响较大,而LDP由于是通过掩膜来进行编码从而提取纹理特征,所以能够较好的解决光照带来的影响,同时LDP基本不受随机噪声所带来的的危害,具有较好的鲁棒性。
3.2.1 普通LDP特征提取
LDP算法的实现过程如下:
(1)先跟LBP算法一下,提取3*3的编码块,然后根据Kirsch算子的方向模板计算边缘响应,Kirsch算子的方向模板如图3.5所示。
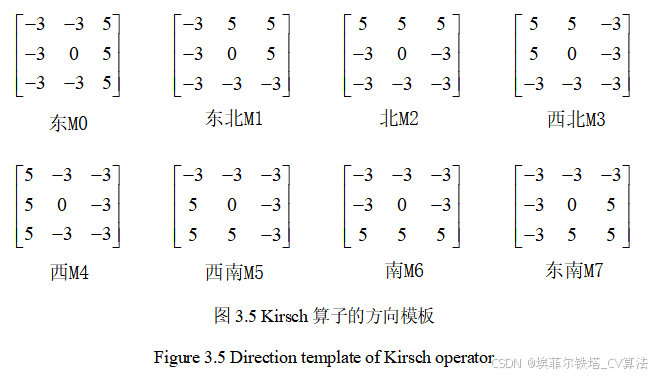
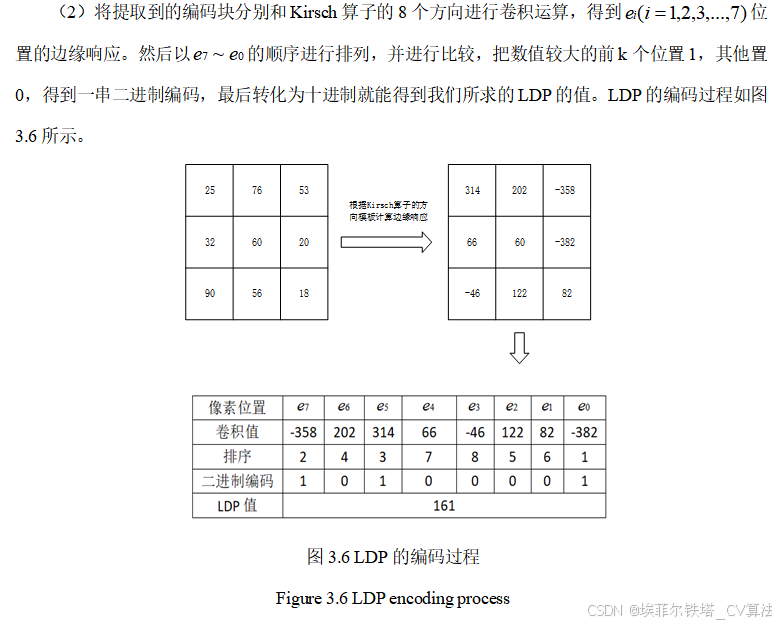
图3.7是LDP特征提取效果图。
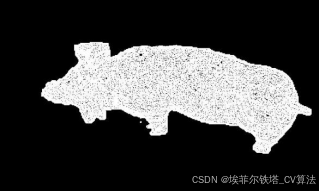
图3.7 LDP特征提取效果图
Figure 3.7 LDP feature extraction renderings
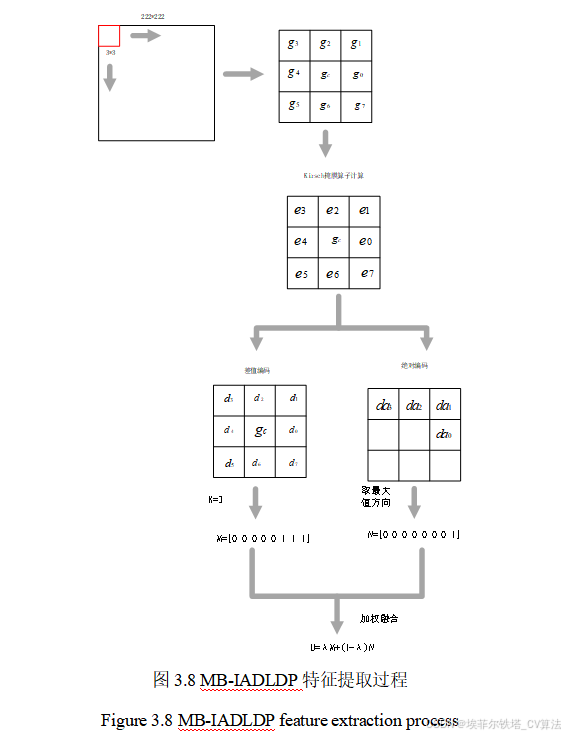
3.2.2 MB-IADLDP特征提取
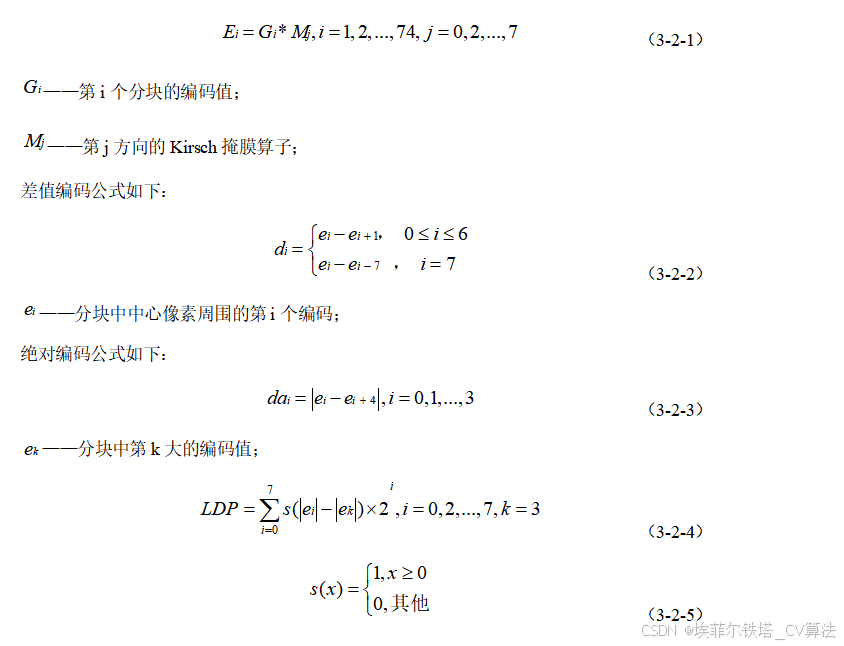
针对传统LDP特征提取算法各个编码之间关系不紧密,局部特征凸显度不够等问题,并且要适应猪只特征提取的实际情况下,本文提出了多分块改进的绝对值差分局部方向模式(Multi Block Improve Absolute Difference Local Direction Pattern,简称MB-IADLDP)。分块是为了丰富局部信息,差值编码是为了让中心像素gc周围的8个领域像素各自和周围联系更紧密,从而丰富提取信息,能够更好的提取猪只的纹理特征;因为绝对值的大的那个方向说明该方向纹理效果是最好的,让绝对值编码和差值编码的结果进行加权融合,这样既保留了主要纹理,又减少了信息冗余。MB-IADLDP特征提取过程如下:
以222*222尺寸的图像为例,先对图像进行分块并提取3*3编码块,共有74个分块,得到3*3的分块的编码Gi后进行Kirsch掩膜算子计算得到Ei,如公式(3-5)所示,再分别进行差值编码和绝对编码,如公式(3-6)和公式(3-7)所示,对差值编码得到的结果取结果最大的3个,即把取得结果最大的3个方向置1,其他方向置0,把绝对编码最大值的方向置1,其他置0,最后进行加权融合,提取过程如图3.5所示。
MB-IADLDP特征提取的效果图如图3.9所示。
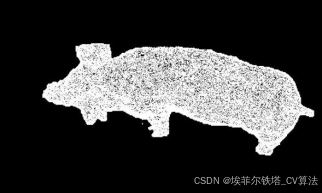
图3.9 MB-IADLDP特征提取效果图
Figure 3.9 MB-IADLDP feature extraction renderings
3.3 特征提取对比结果分析
我们先提取单只猪,对同一幅图片分别进行普通LBP、CS-LBP、普通LDP以及MB-IADLDP特征提取,特征提取效果如图3.10、图3.11所示。
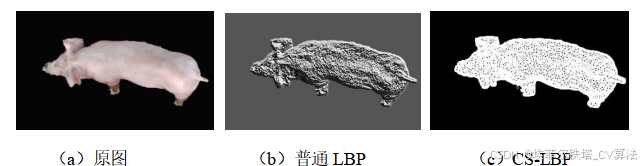
图3.10 LBP特征提取效果图
Figure 3.10 LBP feature extraction effect diagram
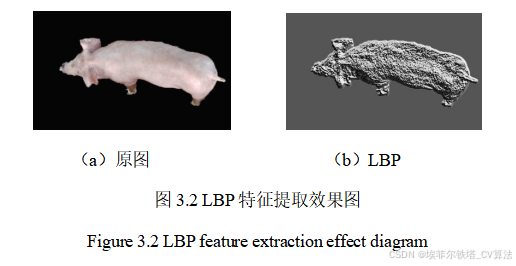
图3.10(a)是预处理后的图片,大大减少了光照强度所带来的影响,CS-LBP特征提取的编码比LBP特征提取的编码少一半,去除了冗余项,大大减少了计算量,同时提取的特征信息的丰富程度不比普通LBP差。由图3.10(b)和图3.10(c)对比可知,图3.10(c)图像中的纹理细节都突出来了,基本上能满足接下来图像处理的要求,并且信息冗余程度大大减小了。
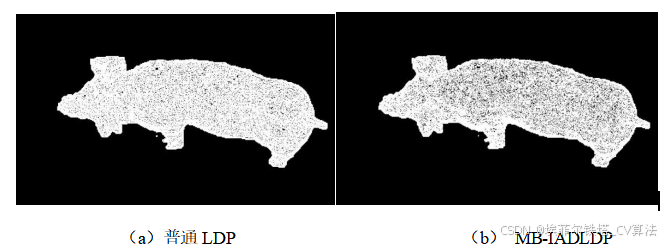
图3.11 LDP特征提取
Figure 3.11 LDP feature extraction
由图3.11可知普通LDP特征提取的效果比普通LBP特征提取的纹理复杂度较低,突出了局部细节,便于接下来的猪的身份识别。由图3.11(b)可知,MB-IADLDP特征提取的信息量比普通的LDP多,因为MB-IADLDP特征提取用到了差值编码,差值编码可以加强各个邻域像素之间的联系;又因为MB-IADLDP特征提取用到了绝对编码,更加可以突出局部细节,通过我们观察,可以明显的发现MB-IADLDP特征提取优于本节所描述的其余三种方法。
表3.1 四种特征提取方法数据对比
Table 3.1 Data comparison of four feature extraction methods
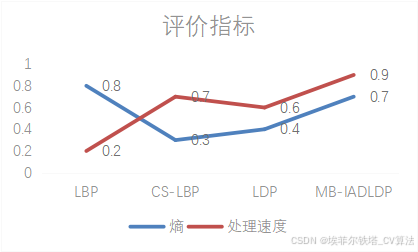
是图像包含信息量的随机性度量,图像的复杂程度可以由熵来表达,熵值越大,说明图像的复杂程度越高,也就是说信息的丰富程度越高,反之则越小。处理速度也是另一个可以衡量算法好坏的评价指标,处理速度越快越好。处理速度越快,熵越高说明特征提取的效果越好。本节把提取的熵和速度进行归一化,归一化后的数据结果更有利于比较。LBP特征提取方法虽然熵值最高,但是处理速度确实最慢的;而MB-IADLDP特征提取方法熵值很高,而且处理速度相对较快,相比较而言,MB-IADLDP特征提取的效果最高,本文就选用MB-IADLDP进行传统纹理特征的提取。
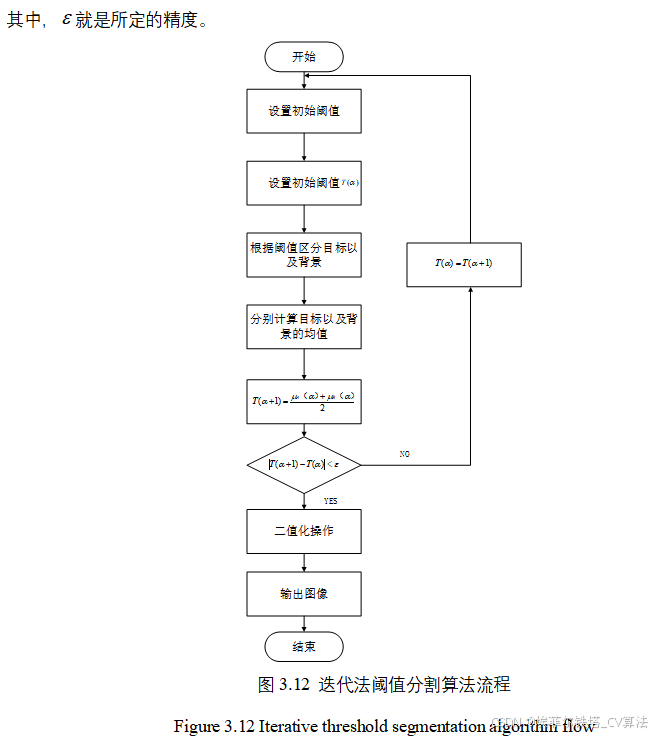
3.4迭代法阈值分割算法
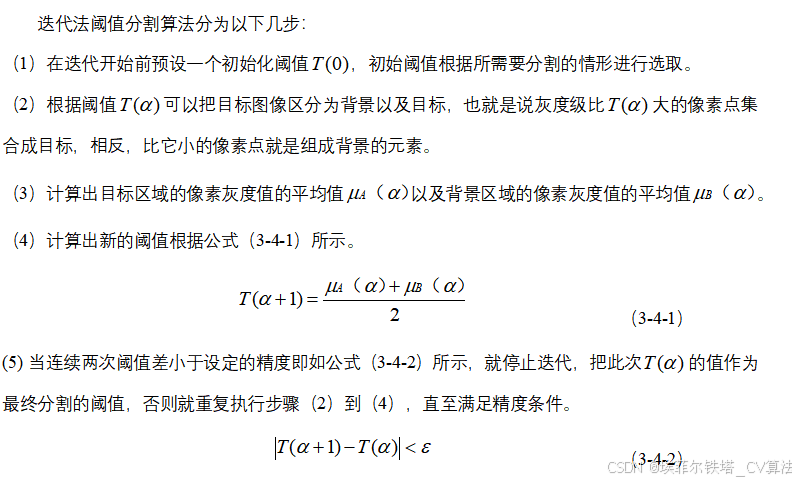
3.5混合高斯模型阈值分割算法
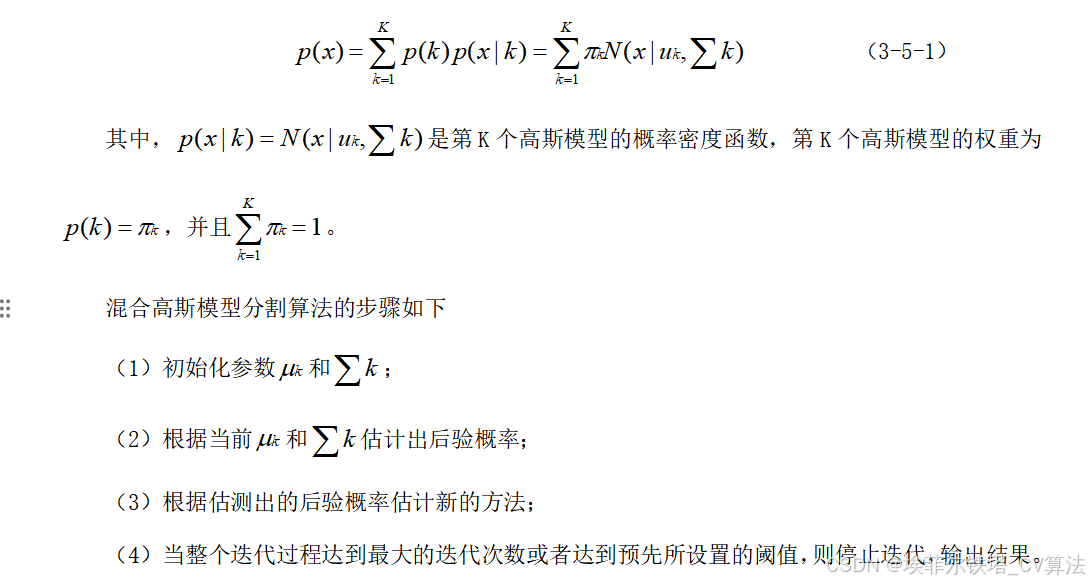
混合高斯模型其实是一种无监督的聚类模型,假设混合高斯模型是由K个高斯模型组成的,那么混合高斯模型的概率密度函数如公式(3-5-1)所示。
3.6鲸鱼优化阈值分割算法
鲸鱼优化算法是比较新的一种群智能优化算法,这个算法所需要的参数少、运行速度快、精度较高的特征。鲸鱼优化算法的思路是通过模拟座头鲸的捕食行为,也就是把食物当做目标,通过包围捕食、随机寻址和气泡网攻击来获得我们需要的最优目标,即最优解。
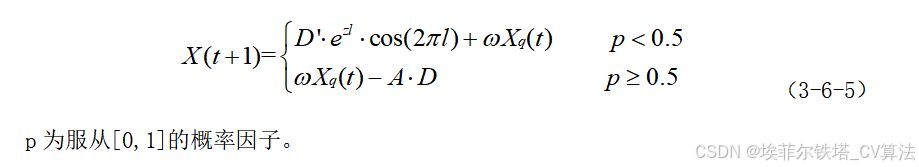
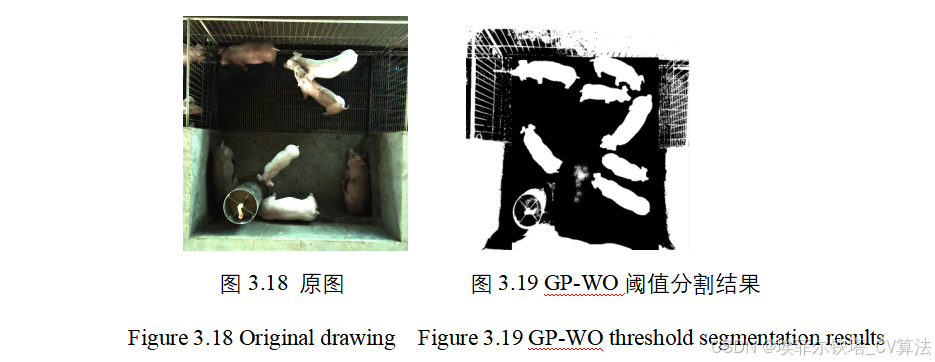
本文将现有的鲸鱼优化算法改进为高斯扰动权重优化鲸鱼优化阈值分割算法(Gaussian Perturbation-Whale Optimization,简称GP-WO)来对判断为采食猪的猪只进行阈值分割,来最终判断是否发生采食行为。这一步可以检验的判断结果,大大提高了对猪只采食行为的判断精度。GP-WO的改进之处主要有三点:(1)添加惯性权重,提高算法的全局搜索能力以及局部搜索能力;(2)添加高斯扰动,避免算法陷入局部最优:(3)用萤火虫算法来对鲸鱼优化算法的初始值进行改进,直接提高整个算法的初始精度。鲸鱼优化算法主要有三步,分别是:1.包围捕食;2.气泡网攻击;3.随机寻址。
3.6.1包围捕食策略
WOA假设当前目标是处于最优位置或者与最优位置比较接近,在定义了最佳搜索位置之后,鲸鱼个体就按照规定的包围捕食策略进行包围,向最优目标靠近。包围捕食策略的数学表达如下:
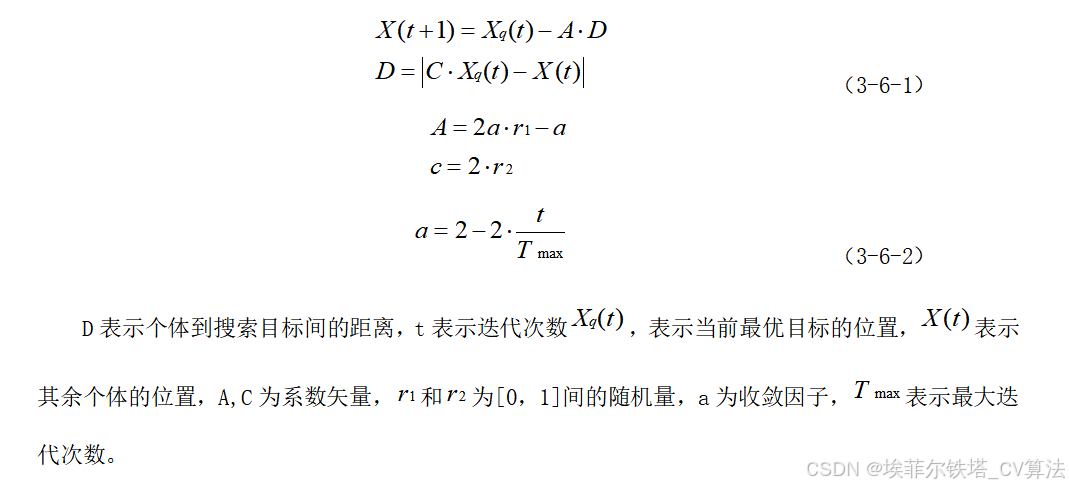
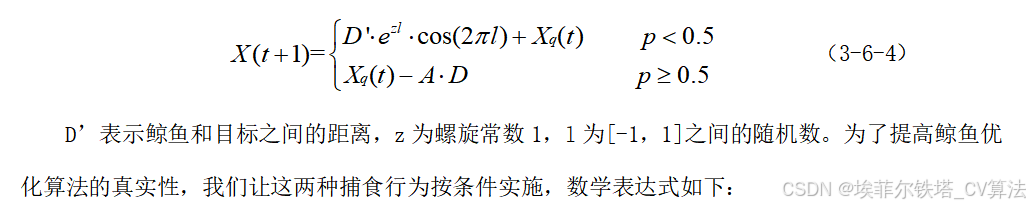
3.6.2气泡网攻击
气泡网攻击可以分为两种模式,第一种是收缩包围,另一种是落选位置更新。第一种是通过收敛因子从2递减到0来完成的,搜索的新位置可定义在其初始位置和当前最优位置间的任何一个地方,如果A是[-1,1]中的一个随机值,那它就会朝着最优位置更新,数学表达式如下:
(3-6-3)
螺旋位置更新主要模仿的是鲸鱼的螺旋运动轨迹,目标和鲸鱼的位置关系就能用螺旋数学表达式来描述,表达式如下:
3.6.3随机寻址
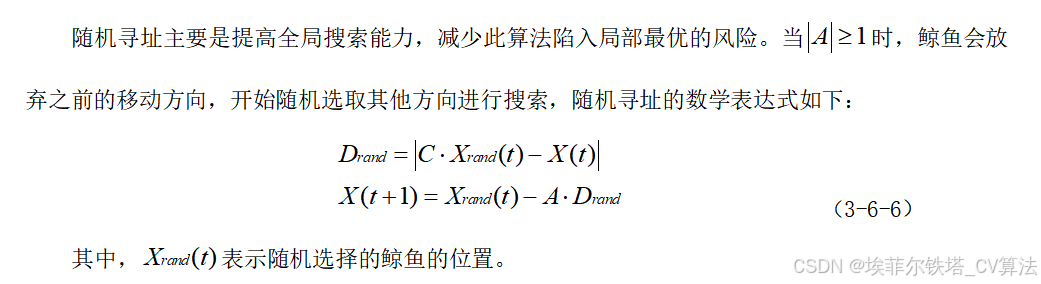
3.6.4高斯扰动鲸鱼优化阈值分割算法
普通的鲸鱼优化算法只能在局部最优解的附近徘徊,而不能达到局部最优,添加可变权重后可让算法的局部搜索能力和全局搜索能力大致达到平衡,在算法前期,需要实现较强的全局搜索能力,只适合可变权重就要偏大;在算法后期,接近最优解的时候,全局搜索能力就要下降,局部搜索能力就要相对提升,这时可变权重就要偏小,可变权重的公式如下:
鲸鱼优化算法的初始值是随机的,这样搜索范围也就是随机的,不能保证整个算法的准确性,导致算法陷入局部最优,以及最优解的精度不高。种群的初始值位置会直接影响整个算法的收敛速度、精度以及效率和优化效果,所以本专利利用萤火虫算法来对鲸鱼优化算法的初始值进行优化选取。
萤火虫算法是属于元启发式算法,主要是通过模拟萤火虫的发光行为实现位置优化。萤火虫的相对荧光亮度I的数学表达如下:
将萤火虫算法迭代得出的最优位置作为鲸鱼优化算法的初始位置,进而改善鲸鱼优化算法的种群分布密度以及质量,增加群众的多样性,从而提高算法的运行效率,提高算法的优化能力。
3.7本章小结
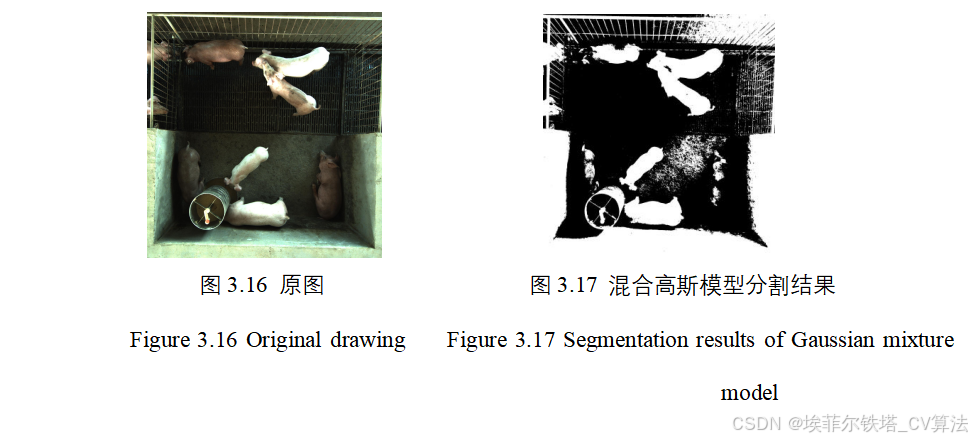
本章是为接下来采食猪的身份识别提供传统纹理特征,所以本章的特征提取至关重要。本章先分别对普通LBP、CS-LBP、普通LDP以及MB-IADLDP特征提取的方法进行详细介绍,并且分别用这几种方法对同一张图片进行处理,通过比较得出结果,然后选则一个特征提取效果最好的方法用于本文的纹理特征提取。接着分析了阈值分割算法,并通过仿真实验对比迭代法阈值分割算法、混合高斯模型阈值分割算法以及鲸鱼优化阈值分割算法的效果。
using System;
using System.Collections.Generic;
using System.Windows.Forms;
public static class Threshold
{
/// <summary>
/// 基于灰度平均值的阈值
/// </summary>
/// <param name="HistGram">灰度图像的直方图</param>
/// <returns></returns>
public static int GetMeanThreshold(int[] HistGram)
{
int Sum = 0, Amount = 0;
for (int Y = 0; Y < 256; Y++)
{
Amount += HistGram[Y];
Sum += Y * HistGram[Y];
}
return Sum / Amount;
}
/// <summary>
/// 基于模糊集的黄式阈值算法
/// http://www.ktl.elf.stuba.sk/study/vacso/Zadania-Cvicenia/Cvicenie_3/TimA2/Huang_E016529624.pdf
/// </summary>
/// <param name="HistGram">灰度图像的直方图</param>
/// <returns></returns>
public static int GetHuangFuzzyThreshold(int[] HistGram)
{
int X, Y;
int First, Last;
int Threshold = -1;
double BestEntropy = Double.MaxValue, Entropy;
// 找到第一个和最后一个非0的色阶值
for (First = 0; First < HistGram.Length && HistGram[First] == 0; First++) ;
for (Last = HistGram.Length - 1; Last > First && HistGram[Last] == 0; Last--) ;
if (First == Last) return First; // 图像中只有一个颜色
if (First + 1 == Last) return First; // 图像中只有二个颜色
// 计算累计直方图以及对应的带权重的累计直方图
int[] S = new int[Last + 1];
int[] W = new int[Last + 1]; // 对于特大图,此数组的保存数据可能会超出int的表示范围,可以考虑用long类型来代替
S[0] = HistGram[0];
for (Y = First > 1 ? First : 1; Y <= Last; Y++)
{
S[Y] = S[Y - 1] + HistGram[Y];
W[Y] = W[Y - 1] + Y * HistGram[Y];
}
// 建立公式(4)及(6)所用的查找表
double[] Smu = new double[Last + 1 - First];
for (Y = 1; Y < Smu.Length; Y++)
{
double mu = 1 / (1 + (double)Y / (Last - First)); // 公式(4)
Smu[Y] = -mu * Math.Log(mu) - (1 - mu) * Math.Log(1 - mu); // 公式(6)
}
// 迭代计算最佳阈值
for (Y = First; Y <= Last; Y++)
{
Entropy = 0;
int mu = (int)Math.Round((double)W[Y] / S[Y]); // 公式17
for (X = First; X <= Y; X++)
Entropy += Smu[Math.Abs(X - mu)] * HistGram[X];
mu = (int)Math.Round((double)(W[Last] - W[Y]) / (S[Last] - S[Y])); // 公式18
for (X = Y + 1; X <= Last; X++)
Entropy += Smu[Math.Abs(X - mu)] * HistGram[X]; // 公式8
if (BestEntropy > Entropy)
{
BestEntropy = Entropy; // 取最小熵处为最佳阈值
Threshold = Y;
}
}
return Threshold;
}
/// <summary>
/// 基于谷底最小值的阈值
/// 此方法实用于具有明显双峰直方图的图像,其寻找双峰的谷底作为阈值
/// References:
/// J. M. S. Prewitt and M. L. Mendelsohn, "The analysis of cell images," in
/// nnals of the New York Academy of Sciences, vol. 128, pp. 1035-1053, 1966.
/// C. A. Glasbey, "An analysis of histogram-based thresholding algorithms,"
/// CVGIP: Graphical Models and Image Processing, vol. 55, pp. 532-537, 1993.
/// </summary>
/// <param name="HistGram">灰度图像的直方图</param>
/// <param name="HistGramS">返回平滑后的直方图</param>
/// <returns></returns>
public static int GetMinimumThreshold(int[] HistGram, int[] HistGramS)
{
int Y, Iter = 0;
double[] HistGramC = new double[256]; // 基于精度问题,一定要用浮点数来处理,否则得不到正确的结果
double[] HistGramCC = new double[256]; // 求均值的过程会破坏前面的数据,因此需要两份数据
for (Y = 0; Y < 256; Y++)
{
HistGramC[Y] = HistGram[Y];
HistGramCC[Y] = HistGram[Y];
}
// 通过三点求均值来平滑直方图
while (IsDimodal(HistGramCC) == false) // 判断是否已经是双峰的图像了
{
HistGramCC[0] = (HistGramC[0] + HistGramC[0] + HistGramC[1]) / 3; // 第一点
for (Y = 1; Y < 255; Y++)
HistGramCC[Y] = (HistGramC[Y - 1] + HistGramC[Y] + HistGramC[Y + 1]) / 3; // 中间的点
HistGramCC[255] = (HistGramC[254] + HistGramC[255] + HistGramC[255]) / 3; // 最后一点
System.Buffer.BlockCopy(HistGramCC, 0, HistGramC, 0, 256 * sizeof(double));
Iter++;
if (Iter >= 1000) return -1; // 直方图无法平滑为双峰的,返回错误代码
}
for (Y = 0; Y < 256; Y++) HistGramS[Y] = (int)HistGramCC[Y];
// 阈值极为两峰之间的最小值
bool Peakfound = false;
for (Y = 1; Y < 255; Y++)
{
if (HistGramCC[Y - 1] < HistGramCC[Y] && HistGramCC[Y + 1] < HistGramCC[Y]) Peakfound = true;
if (Peakfound == true && HistGramCC[Y - 1] >= HistGramCC[Y] && HistGramCC[Y + 1] >= HistGramCC[Y])
return Y - 1;
}
return -1;
}
/// <summary>
/// 基于双峰平均值的阈值
/// 此方法实用于具有明显双峰直方图的图像,其寻找双峰的谷底作为阈值
/// References:
/// J. M. S. Prewitt and M. L. Mendelsohn, "The analysis of cell images," in
/// nnals of the New York Academy of Sciences, vol. 128, pp. 1035-1053, 1966.
/// C. A. Glasbey, "An analysis of histogram-based thresholding algorithms,"
/// CVGIP: Graphical Models and Image Processing, vol. 55, pp. 532-537, 1993.
/// </summary>
/// <param name="HistGram">灰度图像的直方图</param>
/// <param name="HistGramS">返回平滑后的直方图</param>
/// <returns></returns>
public static int GetIntermodesThreshold(int[] HistGram, int[] HistGramS)
{
int Y, Iter = 0, Index;
double[] HistGramC = new double[256]; // 基于精度问题,一定要用浮点数来处理,否则得不到正确的结果
double[] HistGramCC = new double[256]; // 求均值的过程会破坏前面的数据,因此需要两份数据
for (Y = 0; Y < 256; Y++)
{
HistGramC[Y] = HistGram[Y];
HistGramCC[Y] = HistGram[Y];
}
// 通过三点求均值来平滑直方图
while (IsDimodal(HistGramCC) == false) // 判断是否已经是双峰的图像了
{
HistGramCC[0] = (HistGramC[0] + HistGramC[0] + HistGramC[1]) / 3; // 第一点
for (Y = 1; Y < 255; Y++)
HistGramCC[Y] = (HistGramC[Y - 1] + HistGramC[Y] + HistGramC[Y + 1]) / 3; // 中间的点
HistGramCC[255] = (HistGramC[254] + HistGramC[255] + HistGramC[255]) / 3; // 最后一点
System.Buffer.BlockCopy(HistGramCC, 0, HistGramC, 0, 256 * sizeof(double)); // 备份数据,为下一次迭代做准备
Iter++;
if (Iter >= 10000) return -1; // 似乎直方图无法平滑为双峰的,返回错误代码
}
for (Y = 0; Y < 256; Y++) HistGramS[Y] = (int)HistGramCC[Y];
// 阈值为两峰值的平均值
int[] Peak = new int[2];
for (Y = 1, Index = 0; Y < 255; Y++)
if (HistGramCC[Y - 1] < HistGramCC[Y] && HistGramCC[Y + 1] < HistGramCC[Y]) Peak[Index++] = Y - 1;
return ((Peak[0] + Peak[1]) / 2);
}
/// <summary>
/// 百分比阈值
/// </summary>
/// <param name="HistGram">灰度图像的直方图</param>
/// <param name="Tile">背景在图像中所占的面积百分比</param>
/// <returns></returns>
public static int GetPTileThreshold(int[] HistGram, int Tile = 50)
{
int Y, Amount = 0, Sum = 0;
for (Y = 0; Y < 256; Y++) Amount += HistGram[Y]; // 像素总数
for (Y = 0; Y < 256; Y++)
{
Sum = Sum + HistGram[Y];
if (Sum >= Amount * Tile / 100) return Y;
}
return -1;
}
/// <summary>
/// 迭代法获得阈值
/// </summary>
/// <param name="HistGram">灰度图像的直方图</param>
/// <returns></returns>
public static int GetIterativeBestThreshold(int[] HistGram)
{
int X, Iter = 0;
int MeanValueOne, MeanValueTwo, SumOne, SumTwo, SumIntegralOne, SumIntegralTwo;
int MinValue, MaxValue;
int Threshold, NewThreshold;
for (MinValue = 0; MinValue < 256 && HistGram[MinValue] == 0; MinValue++) ;
for (MaxValue = 255; MaxValue > MinValue && HistGram[MinValue] == 0; MaxValue--) ;
if (MaxValue == MinValue) return MaxValue; // 图像中只有一个颜色
if (MinValue + 1 == MaxValue) return MinValue; // 图像中只有二个颜色
Threshold = MinValue;
NewThreshold = (MaxValue + MinValue) >> 1;
while (Threshold != NewThreshold) // 当前后两次迭代的获得阈值相同时,结束迭代
{
SumOne = 0; SumIntegralOne = 0;
SumTwo = 0; SumIntegralTwo = 0;
Threshold = NewThreshold;
for (X = MinValue; X <= Threshold; X++) //根据阈值将图像分割成目标和背景两部分,求出两部分的平均灰度值
{
SumIntegralOne += HistGram[X] * X;
SumOne += HistGram[X];
}
MeanValueOne = SumIntegralOne / SumOne;
for (X = Threshold + 1; X <= MaxValue; X++)
{
SumIntegralTwo += HistGram[X] * X;
SumTwo += HistGram[X];
}
MeanValueTwo = SumIntegralTwo / SumTwo;
NewThreshold = (MeanValueOne + MeanValueTwo) >> 1; //求出新的阈值
Iter++;
if (Iter >= 1000) return -1;
}
return Threshold;
}
public static int GetOSTUThreshold(int[] HistGram)
{
int X, Y, Amount = 0;
int PixelBack = 0, PixelFore = 0, PixelIntegralBack = 0, PixelIntegralFore = 0, PixelIntegral = 0;
double OmegaBack, OmegaFore, MicroBack, MicroFore, SigmaB, Sigma; // 类间方差;
int MinValue, MaxValue;
int Threshold = 0;
for (MinValue = 0; MinValue < 256 && HistGram[MinValue] == 0; MinValue++) ;
for (MaxValue = 255; MaxValue > MinValue && HistGram[MinValue] == 0; MaxValue--) ;
if (MaxValue == MinValue) return MaxValue; // 图像中只有一个颜色
if (MinValue + 1 == MaxValue) return MinValue; // 图像中只有二个颜色
for (Y = MinValue; Y <= MaxValue; Y++) Amount += HistGram[Y]; // 像素总数
PixelIntegral = 0;
for (Y = MinValue; Y <= MaxValue; Y++) PixelIntegral += HistGram[Y] * Y;
SigmaB = -1;
for (Y = MinValue; Y < MaxValue; Y++)
{
PixelBack = PixelBack + HistGram[Y];
PixelFore = Amount - PixelBack;
OmegaBack = (double)PixelBack / Amount;
OmegaFore = (double)PixelFore / Amount;
PixelIntegralBack += HistGram[Y] * Y;
PixelIntegralFore = PixelIntegral - PixelIntegralBack;
MicroBack = (double)PixelIntegralBack / PixelBack;
MicroFore = (double)PixelIntegralFore / PixelFore;
Sigma = OmegaBack * OmegaFore * (MicroBack - MicroFore) * (MicroBack - MicroFore);
if (Sigma > SigmaB)
{
SigmaB = Sigma;
Threshold = Y;
}
}
return Threshold;
}
public static int Get1DMaxEntropyThreshold(int[] HistGram)
{
int X, Y, Amount = 0;
double[] HistGramD = new double[256];
double SumIntegral, EntropyBack, EntropyFore, MaxEntropy;
int MinValue = 255, MaxValue = 0;
int Threshold = 0;
for (MinValue = 0; MinValue < 256 && HistGram[MinValue] == 0; MinValue++) ;
for (MaxValue = 255; MaxValue > MinValue && HistGram[MinValue] == 0; MaxValue--) ;
if (MaxValue == MinValue) return MaxValue; // 图像中只有一个颜色
if (MinValue + 1 == MaxValue) return MinValue; // 图像中只有二个颜色
for (Y = MinValue; Y <= MaxValue; Y++) Amount += HistGram[Y]; // 像素总数
for (Y = MinValue; Y <= MaxValue; Y++) HistGramD[Y] = (double)HistGram[Y] / Amount + 1e-17;
MaxEntropy = double.MinValue; ;
for (Y = MinValue + 1; Y < MaxValue; Y++)
{
SumIntegral = 0;
for (X = MinValue; X <= Y; X++) SumIntegral += HistGramD[X];
EntropyBack = 0;
for (X = MinValue; X <= Y; X++) EntropyBack += (-HistGramD[X] / SumIntegral * Math.Log(HistGramD[X] / SumIntegral));
EntropyFore = 0;
for (X = Y + 1; X <= MaxValue; X++) EntropyFore += (-HistGramD[X] / (1 - SumIntegral) * Math.Log(HistGramD[X] / (1 - SumIntegral)));
if (MaxEntropy < EntropyBack + EntropyFore)
{
Threshold = Y;
MaxEntropy = EntropyBack + EntropyFore;
}
}
return Threshold;
}
// http://fiji.sc/wiki/index.php/Auto_Threshold#Huang
// W. Tsai, "Moment-preserving thresholding: a new approach," Computer
// Vision, Graphics, and Image Processing, vol. 29, pp. 377-393, 1985.
//
// C. A. Glasbey, "An analysis of histogram-based thresholding algorithms,"
// CVGIP: Graphical Models and Image Processing, vol. 55, pp. 532-537, 1993.
public static byte GetMomentPreservingThreshold(int[] HistGram)
{
int X, Y, Index = 0, Amount = 0;
double[] Avec = new double[256];
double X2, X1, X0, Min;
for (Y = 0; Y <= 255; Y++) Amount += HistGram[Y]; // 像素总数
for (Y = 0; Y < 256; Y++) Avec[Y] = (double)A(HistGram, Y) / Amount; // The threshold is chosen such that A(y,t)/A(y,n) is closest to x0.
// The following finds x0.
X2 = (double)(B(HistGram, 255) * C(HistGram, 255) - A(HistGram, 255) * D(HistGram, 255)) / (double)(A(HistGram, 255) * C(HistGram, 255) - B(HistGram, 255) * B(HistGram, 255));
X1 = (double)(B(HistGram, 255) * D(HistGram, 255) - C(HistGram, 255) * C(HistGram, 255)) / (double)(A(HistGram, 255) * C(HistGram, 255) - B(HistGram, 255) * B(HistGram, 255));
X0 = 0.5 - (B(HistGram, 255) / A(HistGram, 255) + X2 / 2) / Math.Sqrt(X2 * X2 - 4 * X1);
for (Y = 0, Min = double.MaxValue; Y < 256; Y++)
{
if (Math.Abs(Avec[Y] - X0) < Min)
{
Min = Math.Abs(Avec[Y] - X0);
Index = Y;
}
}
return (byte)Index;
}
public static int GetKittlerMinError(int[] HistGram)
{
int X, Y;
int MinValue, MaxValue;
int Threshold ;
int PixelBack, PixelFore;
double OmegaBack, OmegaFore, MinSigma, Sigma, SigmaBack, SigmaFore;
for (MinValue = 0; MinValue < 256 && HistGram[MinValue] == 0; MinValue++) ;
for (MaxValue = 255; MaxValue > MinValue && HistGram[MinValue] == 0; MaxValue--) ;
if (MaxValue == MinValue) return MaxValue; // 图像中只有一个颜色
if (MinValue + 1 == MaxValue) return MinValue; // 图像中只有二个颜色
Threshold = -1;
MinSigma = 1E+20;
for (Y = MinValue; Y < MaxValue; Y++)
{
PixelBack = 0; PixelFore = 0;
OmegaBack = 0; OmegaFore = 0;
for (X = MinValue; X <= Y; X++)
{
PixelBack += HistGram[X];
OmegaBack = OmegaBack + X * HistGram[X];
}
for (X = Y + 1; X <= MaxValue; X++)
{
PixelFore += HistGram[X];
OmegaFore = OmegaFore + X * HistGram[X];
}
OmegaBack = OmegaBack / PixelBack;
OmegaFore = OmegaFore / PixelFore;
SigmaBack = 0; SigmaFore = 0;
for (X = MinValue; X <= Y; X++) SigmaBack = SigmaBack + (X - OmegaBack) * (X - OmegaBack) * HistGram[X];
for (X = Y + 1; X <= MaxValue; X++) SigmaFore = SigmaFore + (X - OmegaFore) * (X - OmegaFore) * HistGram[X];
if (SigmaBack == 0 || SigmaFore == 0)
{
if (Threshold == -1)
Threshold = Y;
}
else
{
SigmaBack = Math.Sqrt(SigmaBack / PixelBack);
SigmaFore = Math.Sqrt(SigmaFore / PixelFore);
Sigma = 1 + 2 * (PixelBack * Math.Log(SigmaBack / PixelBack) + PixelFore * Math.Log(SigmaFore / PixelFore));
if (Sigma < MinSigma)
{
MinSigma = Sigma;
Threshold = Y;
}
}
}
return Threshold;
}
// Also called intermeans
// Iterative procedure based on the isodata algorithm [T.W. Ridler, S. Calvard, Picture
// thresholding using an iterative selection method, IEEE Trans. System, Man and
// Cybernetics, SMC-8 (1978) 630-632.]
// The procedure divides the image into objects and background by taking an initial threshold,
// then the averages of the pixels at or below the threshold and pixels above are computed.
// The averages of those two values are computed, the threshold is incremented and the
// process is repeated until the threshold is larger than the composite average. That is,
// threshold = (average background + average objects)/2
// The code in ImageJ that implements this function is the getAutoThreshold() method in the ImageProcessor class.
//
// From: Tim Morris (dtm@ap.co.umist.ac.uk)
// Subject: Re: Thresholding method?
// posted to sci.image.processing on 1996/06/24
// The algorithm implemented in NIH Image sets the threshold as that grey
// value, G, for which the average of the averages of the grey values
// below and above G is equal to G. It does this by initialising G to the
// lowest sensible value and iterating:
// L = the average grey value of pixels with intensities < G
// H = the average grey value of pixels with intensities > G
// is G = (L + H)/2?
// yes => exit
// no => increment G and repeat
//
// There is a discrepancy with IJ because they are slightly different methods
public static int GetIsoDataThreshold(int[] HistGram)
{
int i, l, toth, totl, h, g = 0;
for (i = 1; i < HistGram.Length; i++)
{
if (HistGram[i] > 0)
{
g = i + 1;
break;
}
}
while (true)
{
l = 0;
totl = 0;
for (i = 0; i < g; i++)
{
totl = totl + HistGram[i];
l = l + (HistGram[i] * i);
}
h = 0;
toth = 0;
for (i = g + 1; i < HistGram.Length; i++)
{
toth += HistGram[i];
h += (HistGram[i] * i);
}
if (totl > 0 && toth > 0)
{
l /= totl;
h /= toth;
if (g == (int)Math.Round((l + h) / 2.0))
break;
}
g++;
if (g > HistGram.Length - 2)
{
return 0;
}
}
return g;
}
// Shanhbag A.G. (1994) "Utilization of Information Measure as a Means of
// Image Thresholding" Graphical Models and Image Processing, 56(5): 414-419
// Ported to ImageJ plugin by G.Landini from E Celebi's fourier_0.8 routines
public static int GetShanbhagThreshold(int[] HistGram)
{
int threshold;
int ih, it;
int first_bin;
int last_bin;
double term;
double tot_ent; /* total entropy */
double min_ent; /* max entropy */
double ent_back; /* entropy of the background pixels at a given threshold */
double ent_obj; /* entropy of the object pixels at a given threshold */
double[] norm_histo = new double[HistGram.Length]; /* normalized histogram */
double[] P1 = new double[HistGram.Length]; /* cumulative normalized histogram */
double[] P2 = new double[HistGram.Length];
int total = 0;
for (ih = 0; ih < HistGram.Length; ih++)
total += HistGram[ih];
for (ih = 0; ih < HistGram.Length; ih++)
norm_histo[ih] = (double)HistGram[ih] / total;
P1[0] = norm_histo[0];
P2[0] = 1.0 - P1[0];
for (ih = 1; ih < HistGram.Length; ih++)
{
P1[ih] = P1[ih - 1] + norm_histo[ih];
P2[ih] = 1.0 - P1[ih];
}
/* Determine the first non-zero bin */
first_bin = 0;
for (ih = 0; ih < HistGram.Length; ih++)
{
if (!(Math.Abs(P1[ih]) < 2.220446049250313E-16))
{
first_bin = ih;
break;
}
}
/* Determine the last non-zero bin */
last_bin = HistGram.Length - 1;
for (ih = HistGram.Length - 1; ih >= first_bin; ih--)
{
if (!(Math.Abs(P2[ih]) < 2.220446049250313E-16))
{
last_bin = ih;
break;
}
}
// Calculate the total entropy each gray-level
// and find the threshold that maximizes it
threshold = -1;
min_ent = Double.MaxValue;
for (it = first_bin; it <= last_bin; it++)
{
/* Entropy of the background pixels */
ent_back = 0.0;
term = 0.5 / P1[it];
for (ih = 1; ih <= it; ih++)
{ //0+1?
ent_back -= norm_histo[ih] * Math.Log(1.0 - term * P1[ih - 1]);
}
ent_back *= term;
/* Entropy of the object pixels */
ent_obj = 0.0;
term = 0.5 / P2[it];
for (ih = it + 1; ih < HistGram.Length; ih++)
{
ent_obj -= norm_histo[ih] * Math.Log(1.0 - term * P2[ih]);
}
ent_obj *= term;
/* Total entropy */
tot_ent = Math.Abs(ent_back - ent_obj);
if (tot_ent < min_ent)
{
min_ent = tot_ent;
threshold = it;
}
}
return threshold;
}
// M. Emre Celebi
// 06.15.2007
// Ported to ImageJ plugin by G.Landini from E Celebi's fourier_0.8 routines
public static int GetYenThreshold(int[] HistGram)
{
int threshold;
int ih, it;
double crit;
double max_crit;
double[] norm_histo = new double[HistGram.Length]; /* normalized histogram */
double[] P1 = new double[HistGram.Length]; /* cumulative normalized histogram */
double[] P1_sq = new double[HistGram.Length];
double[] P2_sq = new double[HistGram.Length];
int total = 0;
for (ih = 0; ih < HistGram.Length; ih++)
total += HistGram[ih];
for (ih = 0; ih < HistGram.Length; ih++)
norm_histo[ih] = (double)HistGram[ih] / total;
P1[0] = norm_histo[0];
for (ih = 1; ih < HistGram.Length; ih++)
P1[ih] = P1[ih - 1] + norm_histo[ih];
P1_sq[0] = norm_histo[0] * norm_histo[0];
for (ih = 1; ih < HistGram.Length; ih++)
P1_sq[ih] = P1_sq[ih - 1] + norm_histo[ih] * norm_histo[ih];
P2_sq[HistGram.Length - 1] = 0.0;
for (ih = HistGram.Length - 2; ih >= 0; ih--)
P2_sq[ih] = P2_sq[ih + 1] + norm_histo[ih + 1] * norm_histo[ih + 1];
/* Find the threshold that maximizes the criterion */
threshold = -1;
max_crit = Double.MinValue;
for (it = 0; it < HistGram.Length; it++)
{
crit = -1.0 * ((P1_sq[it] * P2_sq[it]) > 0.0 ? Math.Log(P1_sq[it] * P2_sq[it]) : 0.0) + 2 * ((P1[it] * (1.0 - P1[it])) > 0.0 ? Math.Log(P1[it] * (1.0 - P1[it])) : 0.0);
if (crit > max_crit)
{
max_crit = crit;
threshold = it;
}
}
return threshold;
}
private static double A(int[] HistGram, int Index)
{
double Sum = 0;
for (int Y = 0; Y <= Index; Y++)
Sum += HistGram[Y];
return Sum;
}
private static double B(int[] HistGram, int Index)
{
double Sum = 0;
for (int Y = 0; Y <= Index; Y++)
Sum += (double)Y * HistGram[Y];
return Sum;
}
private static double C(int[] HistGram, int Index)
{
double Sum = 0;
for (int Y = 0; Y <= Index; Y++)
Sum += (double)Y * Y * HistGram[Y];
return Sum;
}
private static double D(int[] HistGram, int Index)
{
double Sum = 0;
for (int Y = 0; Y <= Index; Y++)
Sum += (double)Y * Y * Y * HistGram[Y];
return Sum;
}
private static bool IsDimodal(double[] HistGram) // 检测直方图是否为双峰的
{
// 对直方图的峰进行计数,只有峰数位2才为双峰
int Count = 0;
for (int Y = 1; Y < 255; Y++)
{
if (HistGram[Y - 1] < HistGram[Y] && HistGram[Y + 1] < HistGram[Y])
{
Count++;
if (Count > 2) return false;
}
}
if (Count == 2)
return true;
else
return false;
}
}详细代码比较多,私我发邮箱。


 6487
6487

 被折叠的 条评论
为什么被折叠?
被折叠的 条评论
为什么被折叠?
 到【灌水乐园】发言


