


Panoply
看nc文件比较直观,可以直接看到各项并且绘图,见附件截图
介绍
可能有误
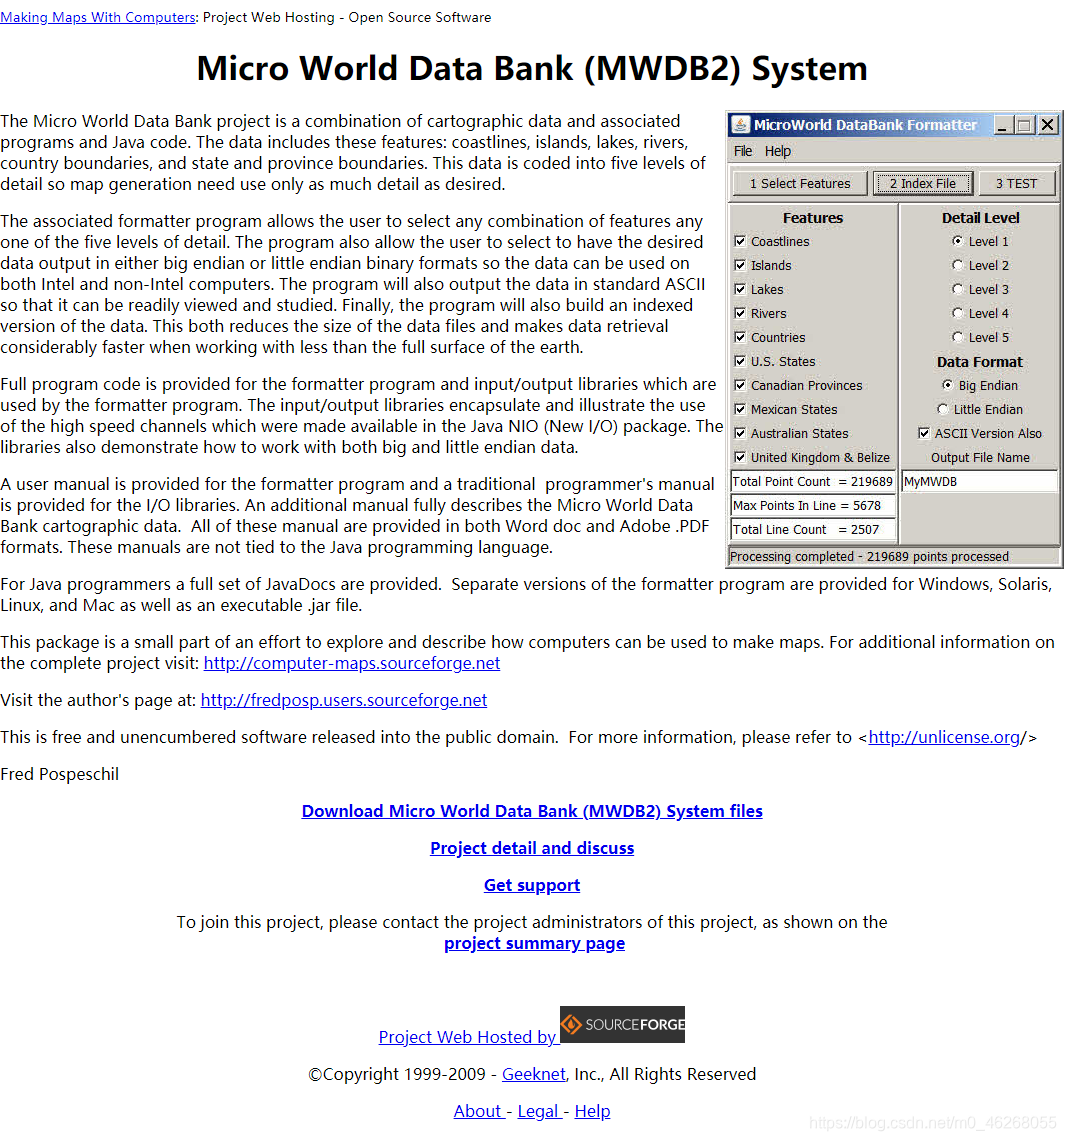
Panoply is a cross-platform application which plots geo-gridded arrays from netCDF, HDFand GRIB datasets. You can:
Slice and plot specific latitude-longitude, latitude-vertical, or time-latitude arrays from larger multidimensional variables. Combine two arrays in one plot by differencing, summing or averaging. Plot lon-lat data on a global or regional map (using any of over 75 map projections) or make a zonal average lineplot. Overlay continent outlines or masks on lon-lat plots. Use any ACT, CPT, GGR, or PAL color table for scale colorbar. Save plots to disk GIF, JPEG, PNG or TIFF bitmap images or as PDF or PostScript graphics files. Export lon-lat map plots in KMZ format.
下载地址 需配合java虚拟机使用,至少java5http://www.java.com/zh_CN/download/manual.jsp additional map overlays and outlines
http://www.giss.nasa.gov/tools/panoply/overlays/
安装java 9以上
截至目前20210430,存在11和13版本了
下载地址介绍
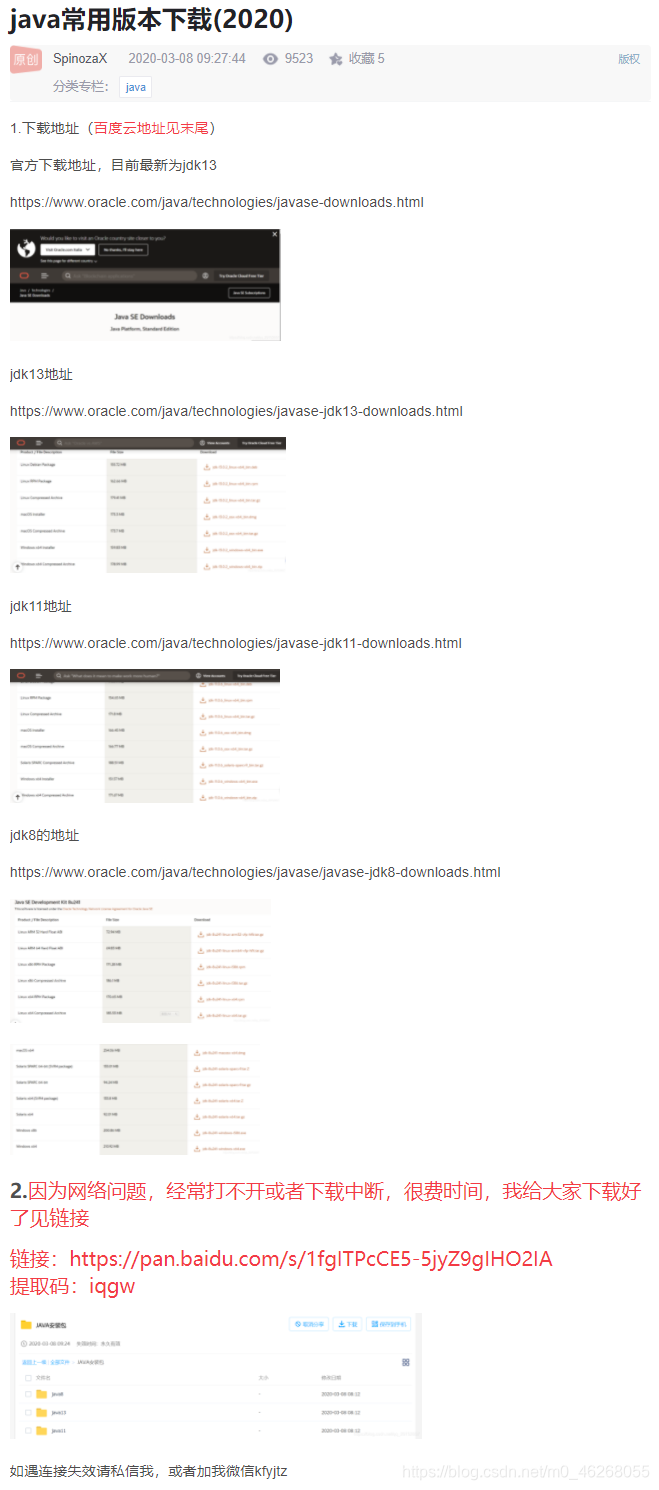
如何安装JDK 11
java11只需要两个路径设置就行了,
参考这个链接,只需要设置JAVA_HOME为
路径:C:\Program Files\Java\jdk-11.0.6
CLASSPATH
Path中的路径为%JAVA_HOME%bin即可,将其在Path中置顶。(20220330)
变量名:JAVA_HOME
路径:C:\Program Files\Java\jdk-11.0.6
CLASSPATH
.%JAVA_HOME%bin;%JAVA_HOME%\jre\bin;
note:
切换不同java版本需要进行变量修改,这里我的电脑20210430好像没有安装java其它版本,这里就不探索
注意环境变量添加新的以后,要重新打来cmd,这样java命令才会被导入
最后用Panoply打开nc文件画图
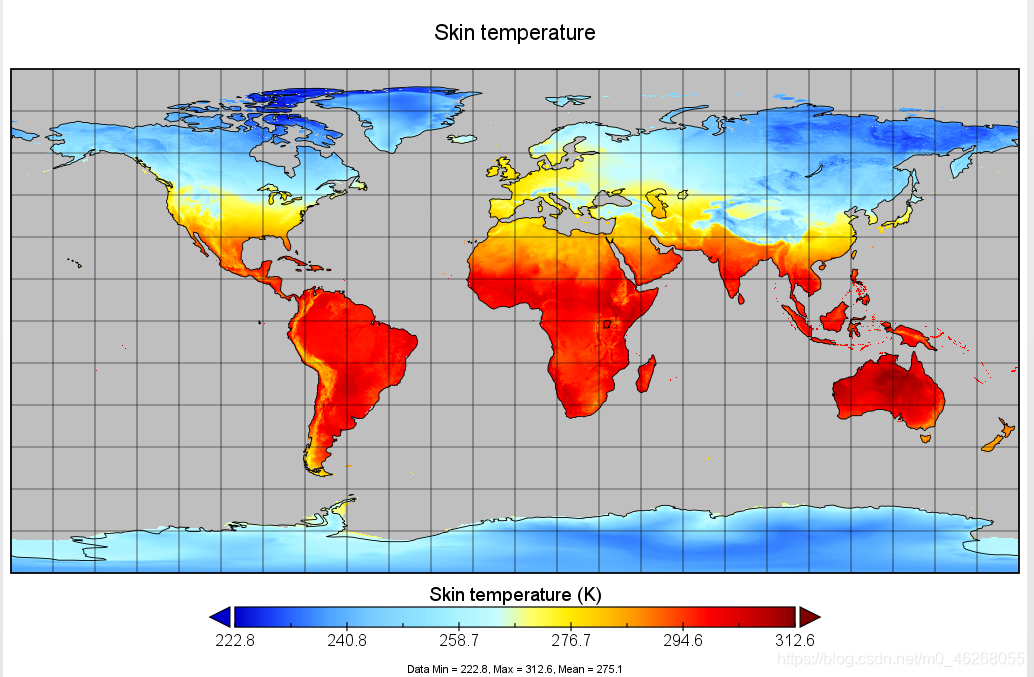
太炫了


 3158
3158

 被折叠的 条评论
为什么被折叠?
被折叠的 条评论
为什么被折叠?
 到【灌水乐园】发言


