


TP(True Positives):实际为正例并且预测为正例
FP(False Postives):实际为反例但是预测为正例
TN(True Negatives):实际为反例并且预测为反例
FN(False Negatives):实际为正例但是预测为反例
精确率=TP/(TP+FP)
召回率=TP/(TP+FN)
# coding=utf-8
import matplotlib.pyplot as plt
import numpy as np
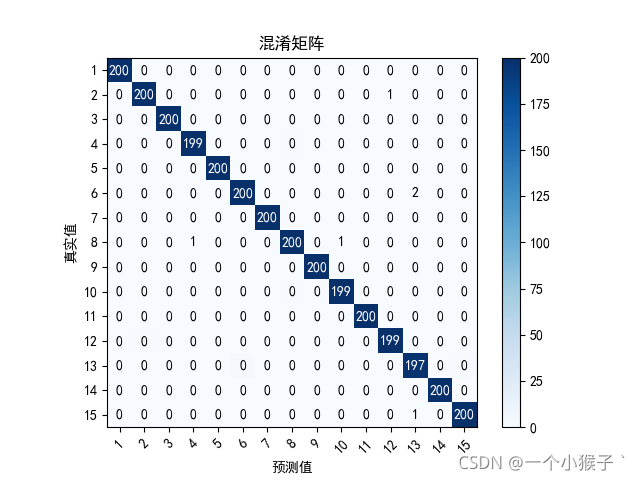
confusion = np.array(([200,0,0,0,0,0,0,0,0,0,0,0,0,0,0],
[0,200,0,0,0,0,0,0,0,0,0,0,0,0,0],
[0,0,200,0,0,0,0,0,0,0,0,0,0,0,0],
[0,0,0,199,0,0,0,1,0,0,0,0,0,0,0],
[0,0,0,0,200,0,0,0,0,0,0,0,0,0,0],
[0,0,0,0,0,200,0,0,0,0,0,0,0,0,0],
[0,0,0,0,0,0,200,0,0,0,0,0,0,0,0],
[0,0,0,0,0,0,0,200,0,0,0,0,0,0,0],
[0,0,0,0,0,0,0,0,200,0,0,0,0,0,0],
[0,0,0,0,0,0,0,1,0,199,0,0,0,0,0],
[0,0,0,0,0,0,0,0,0,0,200,0,0,0,0],
[0,1,0,0,0,0,0,0,0,0,0,199,0,0,0],
[0,0,0,0,0,2,0,0,0,0,0,0,197,0,1],
[0,0,0,0,0,0,0,0,0,0,0,0,0,200,0],
[0,0,0,0,0,0,0,0,0,0,0,0,0,0,200]
))
classes=['1','2','3','4','5','6','7','8','9','10','11','12','13','14','15']
#画出混淆矩阵
def confusion_matrix(confMatrix):
# 热度图,后面是指定的颜色块,可设置其他的不同颜色
plt.imshow(confMatrix, cmap=plt.cm.Blues)
# ticks 坐标轴的坐标点
# label 坐标轴标签说明
indices = range(len(confMatrix))
# 第一个是迭代对象,表示坐标的显示顺序,第二个参数是坐标轴显示列表
# plt.xticks(indices, [0, 1, 2])
# plt.yticks(indices, [0, 1, 2])
plt.xticks(indices, classes,rotation=45)
plt.yticks(indices, classes)
plt.colorbar()
plt.xlabel('预测值')
plt.ylabel('真实值')
plt.title('混淆矩阵')
# plt.rcParams两行是用于解决标签不能显示汉字的问题
plt.rcParams['font.sans-serif'] = ['SimHei']
plt.rcParams['axes.unicode_minus'] = False
# 显示数据
for first_index in range(len(confMatrix)): # 第几行
for second_index in range(len(confMatrix[first_index])): # 第几列
if first_index==second_index:
plt.text(first_index, second_index, confMatrix[first_index][second_index],va='center',ha='center',color='white')
else:
plt.text(first_index, second_index, confMatrix[first_index][second_index], va='center', ha='center')
# 在matlab里面可以对矩阵直接imagesc(confusion)
# 显示
plt.show()
#计算准确率
def calculate_all_prediction(confMatrix):
'''
计算总精度,对角线上所有值除以总数
:return:
'''
total_sum=confMatrix.sum()
correct_sum=(np.diag(confMatrix)).sum()
prediction=round(100*float(correct_sum)/float(total_sum),2)
print('准确率:'+str(prediction)+'%')
def calculae_lable_prediction(confMatrix):
'''
计算每一个类别的预测精度:该类被预测正确的数除以该类的总数
'''
l=len(confMatrix)
for i in range(l):
label_total_sum = confMatrix.sum(axis=1)[i]
label_correct_sum=confMatrix[i][i]
prediction = round(100 * float(label_correct_sum) / float(label_total_sum), 2)
print('精确率:'+classes[i]+":"+str(prediction)+'%')
def calculate_label_recall(confMatrix):
l = len(confMatrix)
for i in range(l):
label_total_sum = confMatrix.sum(axis=0)[i]
label_correct_sum = confMatrix[i][i]
prediction = round(100 * float(label_correct_sum) / float(label_total_sum), 2)
print('召回率:'+classes[i] + ":" + str(prediction) + '%')
confusion_matrix(confusion)
calculae_lable_prediction(confusion)
calculate_label_recall(confusion)
结果
E:\Anaconda\python.exe "E:/Classfication Of Network/z.other/混淆矩阵.py"
精确率:1:100.0%
精确率:2:100.0%
精确率:3:100.0%
精确率:4:99.5%
精确率:5:100.0%
精确率:6:100.0%
精确率:7:100.0%
精确率:8:100.0%
精确率:9:100.0%
精确率:10:99.5%
精确率:11:100.0%
精确率:12:99.5%
精确率:13:98.5%
精确率:14:100.0%
精确率:15:100.0%
召回率:1:100.0%
召回率:2:99.5%
召回率:3:100.0%
召回率:4:100.0%
召回率:5:100.0%
召回率:6:99.01%
召回率:7:100.0%
召回率:8:99.01%
召回率:9:100.0%
召回率:10:100.0%
召回率:11:100.0%
召回率:12:100.0%
召回率:13:100.0%
召回率:14:100.0%
召回率:15:99.5%


 500
500


 被折叠的 条评论
为什么被折叠?
被折叠的 条评论
为什么被折叠?
 到【灌水乐园】发言


