


层次分析法
原文链接(我的主页):https://rick2pc.github.io/2022/07/30/AHP/
层次分析法,即:“The analytic hierarchy process”, 简称AHP
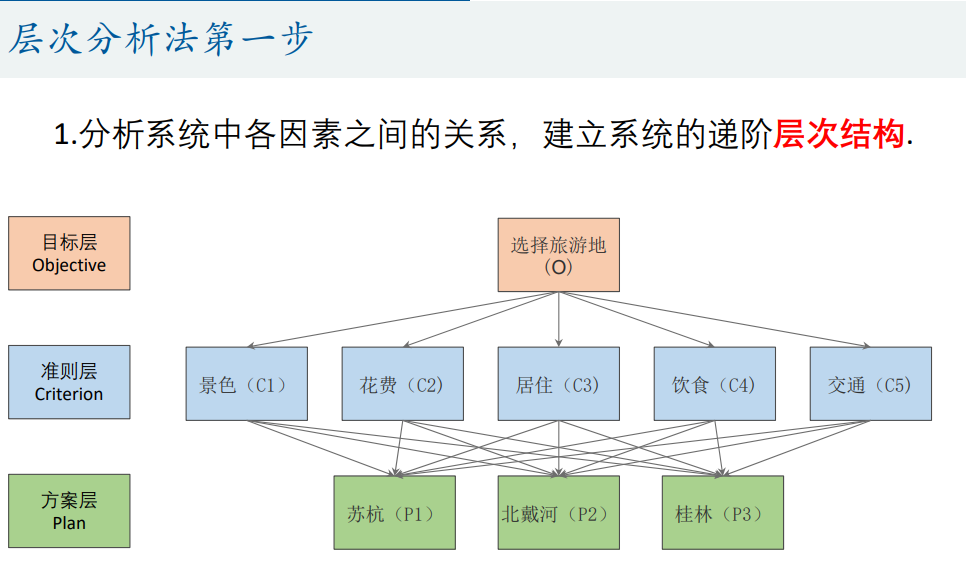
1.建模比赛中最基础的模型之一;
2.主要解决评价类问题;
3.文章中所有图片来自于清风数学建模课程的课件。
我们用一个例子来介绍这个建模方法:
“填好志愿后,小明同学想出去旅游。在查阅了网上的攻略后,他初步选择 了苏杭、北戴河和桂林三地之一作为目标景点。“
”请你确定评价指标、形成评价体系来为小明同学选择最佳的方案。”
对于解决这种评价类问题,我们需要考虑以下三个问题:
- 我们的评价目标是什么?
- 我们为了达到这个目标有哪几种可选的方案?
- 评价的准则或者说指标是什么?(我们根据什么东西来评价好坏)
对于我们的例子,我们的回答:
- 为小明同学选择最佳的旅游景点。
- 三种,分别是去苏杭、去北戴河和去桂林。
- 题目没给相关数据支撑,需要我们查阅相关的资料。
一般而言,前两个问题的答案是显而易见的,第三个问题的答案 需要我们根据题目中的背景材料、常识以及网上搜集到的参考资料进行结合,从中筛选出最合适的指标。
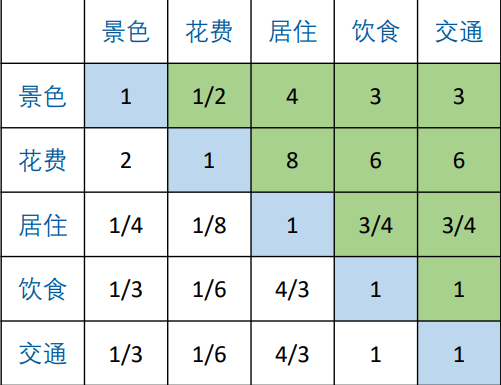
在这里,我们假设5个指标:景点;花费;居住;饮食;交通。
然后我们构建一张权重表:
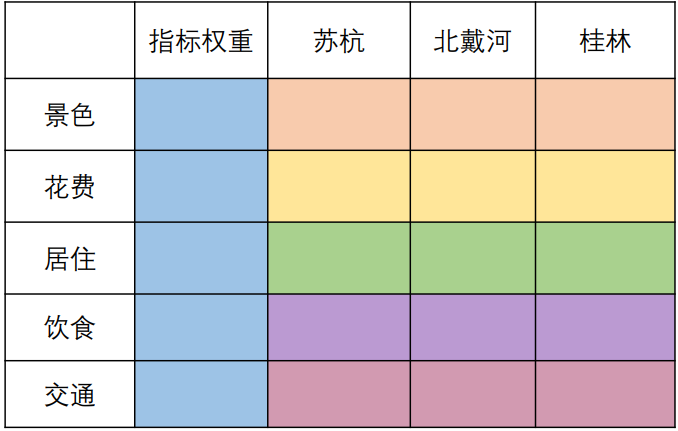
要注意, A H P AHP AHP的最终目的其实就是把这张表通过数学的方式(而不是凭直觉)进行填充,而不是小明自己随便填写,“在确定影响某因素的诸因子在该因素中所占的比重时,遇到的主要困难 是这些比重常常不易定量化。此外,当影响某因素的因子较多时,直接 考虑各因子对该因素有多大程度的影响时,常常会因考虑不周全、顾此 失彼而使决策者提出与他实际认为的重要性程度不相一致的数据,甚至 有可能提出一组隐含矛盾的数据。”(司守奎《数学建模算法与应用》)
我们首先来思考一下5个指标之间的权重:
一次性考虑五个之间的关系比较繁杂,我们可以两两进行比较,最终通过两两比较的结果来推算权重。
我们使用1~9表示两两指标之间的重要程度(这里的重要程度也可以理解为满意度),具体数字的含义,见下表:
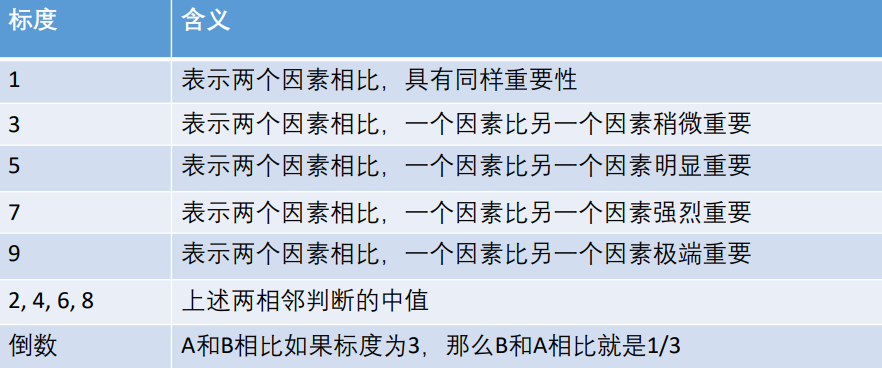
其中,重点要注意一下最后一行那个倒数的含义。
好,我们将根据这个标度,来进行权重的计算:
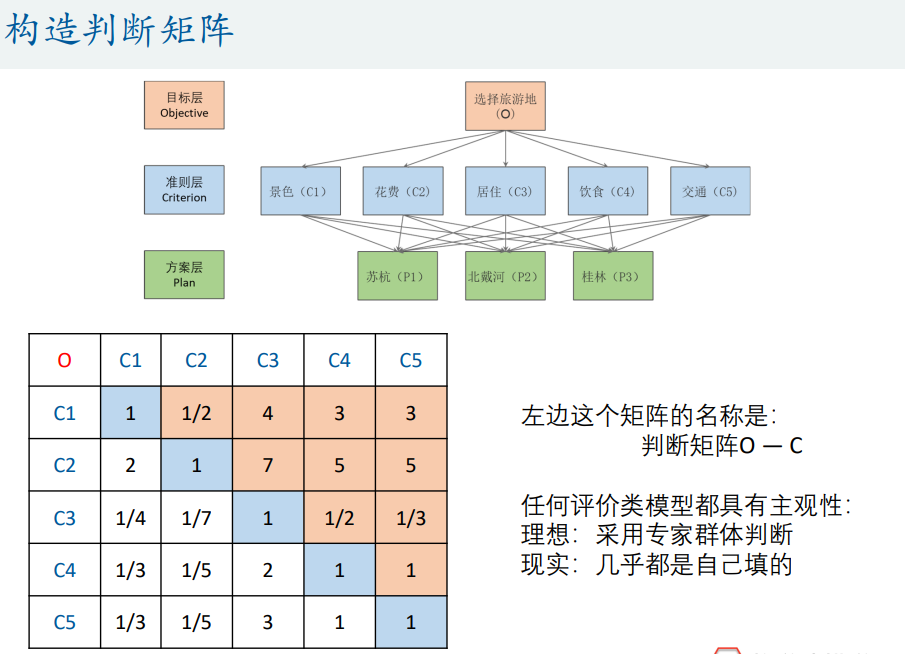
1. 构建判断矩阵

-
首先,对于指标权重,我们会构建一个判断矩阵,再计算权重。如上图,记为 A A A,对应的元素为 a i j a_{ij} aij。该矩阵有如下特点:
- a i j a_{ij} aij 表示的意思是:与指标 j j j相比, i i i的重要程度。
- 当 i = j i=j i=j时,两个指标相同,因此同等重要,这就解释了主对角线元素为1。
- a i j > 0 a_{ij}>0 aij>0且满足 a i j ∗ a j i = 1 a_{ij}*a_{ji}=1 aij∗aji=1(我们称满足这一条件的矩阵为正互反矩阵)。
但是,在实际建模的过程中,没有“小明”帮助我们填表,层次分析的这张表是交给“专家”填写的,但在比赛过程中往往很难找找到专家标准,一般只能自己填了,但是在论文中就别说出来了。
-
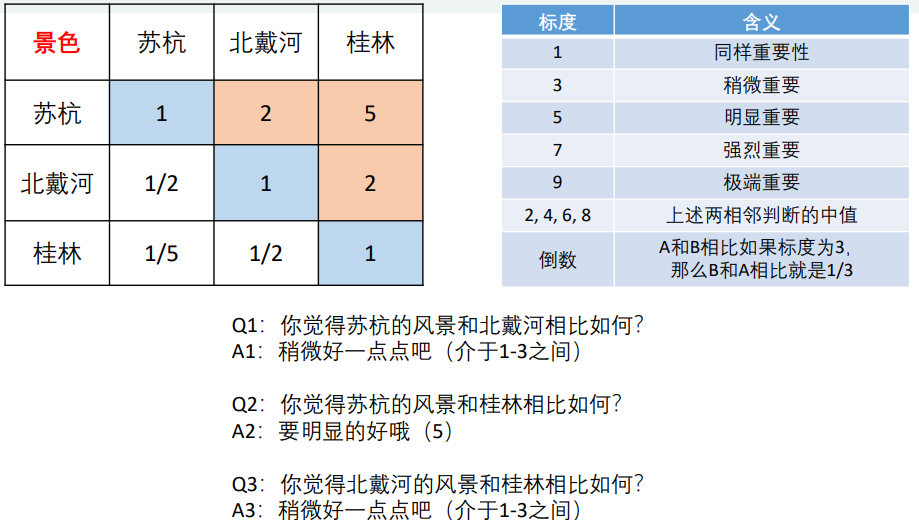
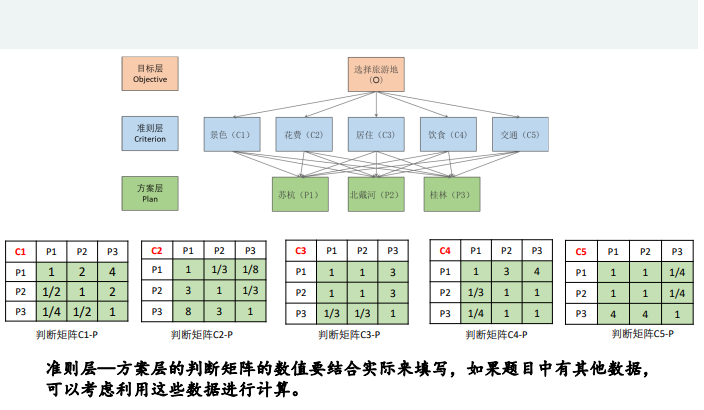
其次,对于三个地点在五个把不同标度分别的得分也是重复上面的操作,例如:
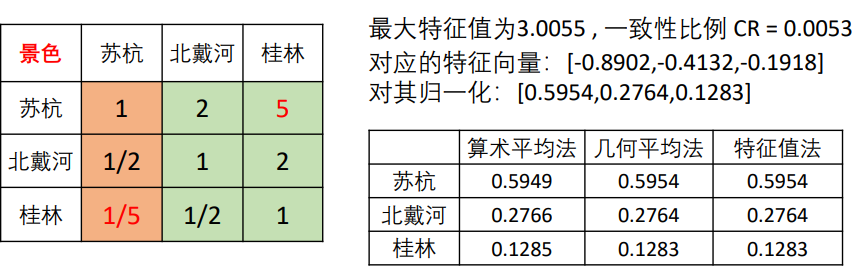
计算在景色方面苏杭,北戴河,桂林所占的得分,我们也是先构建一个判断矩阵,然后再计算权重:
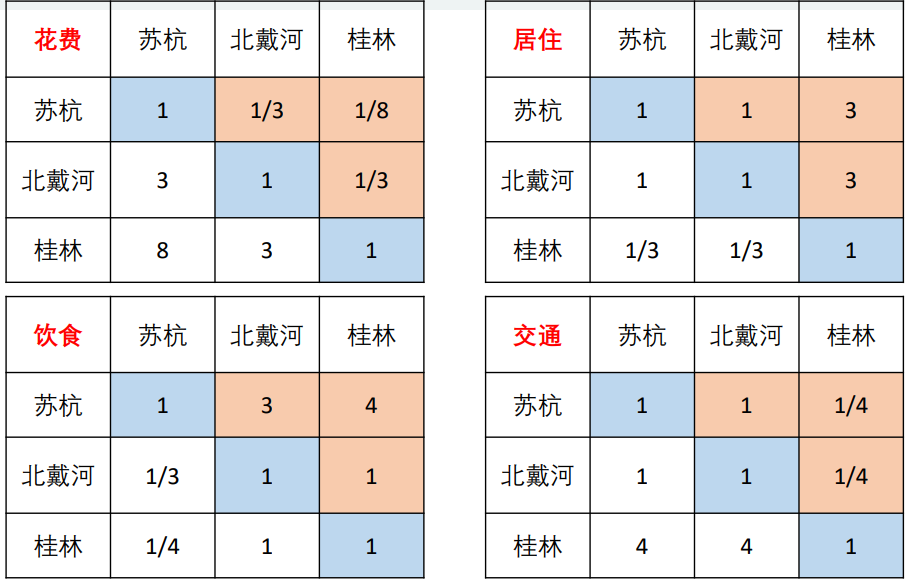
但是,要注意一个问题:
苏杭=A 北戴河=B 桂林=C
苏杭的景色比北戴河好:A>B
苏杭和桂林景色一样好: A = C
北戴河比桂林景色好一点:B > C
这个时候,就会出现问题:如果A = C而A > B,那么C>B与第三条冲突,判断矩阵出现问题

判断矩阵出现了矛盾之处,我们称之为不一致现象。
何为一致矩阵?简单理解一下就是各行(列)之间成倍数关系,例:
若矩阵中每个元素 a i j > 0 a_{ij}> 0 aij>0且满足 a i j ∗ a j i = 1 a_{ij}*a_{ji}=1 aij∗aji=1,则我们称该矩阵为正互反矩阵。在层次分析法中,我们构造的判断矩阵均是正互反矩阵。
在正互反矩阵满足 a i j ∗ a j k = a i k a_{ij}*a_{jk}=a_{ik} aij∗ajk=aik,则我们称其为一致矩阵。
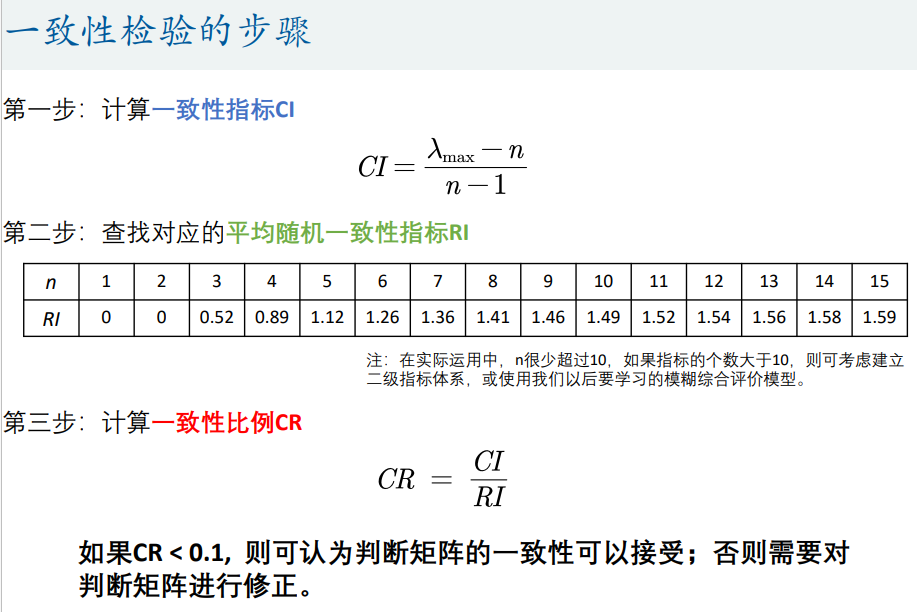
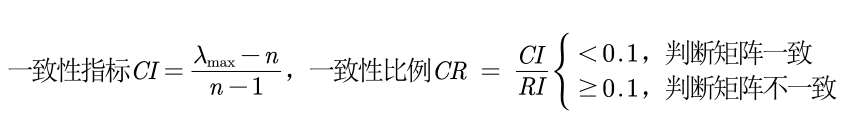
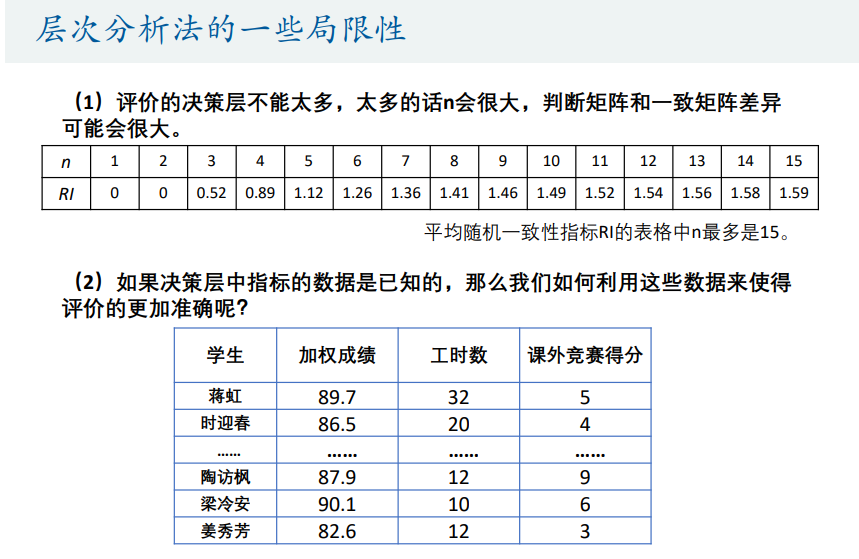
注意:在使用判断矩阵求权重之前,必须对其进行一致性检验。
[外链图片转存失败,源站可能有防盗链机制,建议将图片保存下来直接上传(img-Fc4mYPaJ-1659151534540)(https://raw.githubusercontent.com/Rick2pc/Typora/main/202207301110166.png)]
[外链图片转存失败,源站可能有防盗链机制,建议将图片保存下来直接上传(img-TiUrADbi-1659151534540)(https://raw.githubusercontent.com/Rick2pc/Typora/main/202207301110107.png)]
2. 根据判断矩阵计算权重
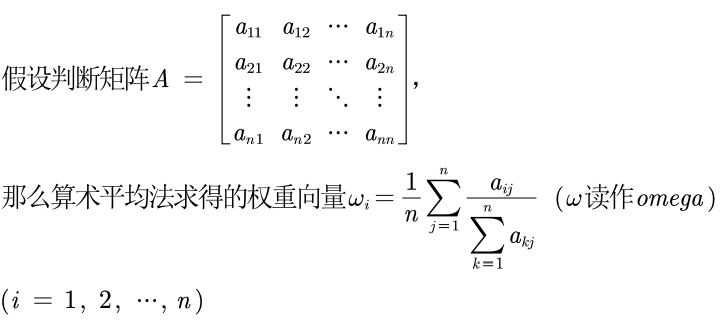
方法一:算数平均法求权重
- 第一步: 将判断矩阵按照列进行归一化(每一个元素除以其所在列的和);
- 第二步: 将归一化的各列相加(按行求和);
- 第三步: 将相加得到的向量中每个元素除以 n n n即可得到权重向量。
例:
[外链图片转存失败,源站可能有防盗链机制,建议将图片保存下来直接上传(img-ow2EPXo2-1659151834963)(https://raw.githubusercontent.com/Rick2pc/Typora/main/202207301109075.jpg)]
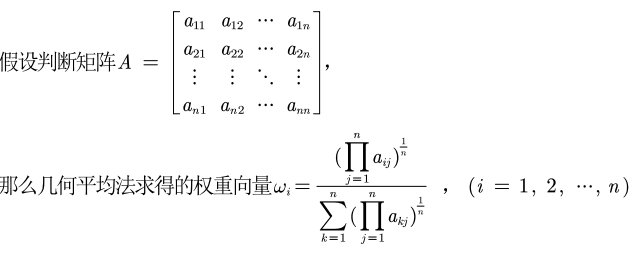
方法二:几何平均法求权重
- 第一步: 将A的元素按照行相乘得到一个新的列向量;
- 第二步: 将新的向量的每个分量开n次方;
- 第三步:对该列向量进行归一化即可得到权重向量。
方法三:特征值法求权重
假如我们的判断矩阵一致性可以接受,那么我们可以仿照一致矩阵权重的求法。
- 第一步:求出矩阵A的最大特征值以及其对应的特征向量;
- 第二步:对求出的特征向量进行归一化即可得到我们的权重。
三种方法说实话感觉没什么区别,写论文的时候选一种就好了,但是最好点明三种方法都算过了,然后在附录里面展现出最后的结果。
3. 计算得分
根据上节的三种方法,我们可以选择一种方法分别计算每个区块的得分,然后填入表中
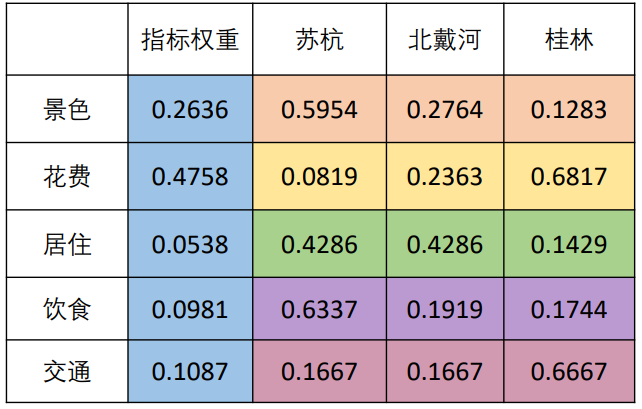
(每一种颜色就代表了一个判断矩阵)
然后根据指标权重和每个地区在5个指标上的权重进行打分,例:

这样,我们就可以得到三个地区,在五个指标上的得分,进而来选择小明想要去的地方。
4. 总结


存中…(img-31ciNpwj-1659151534546)]
[外链图片转存中…(img-LVvA6TwZ-1659151534547)]
[外链图片转存中…(img-QVW17jYg-1659151534547)]
[外链图片转存中…(img-vg6YdndN-1659151534547)]


 1947
1947


 被折叠的 条评论
为什么被折叠?
被折叠的 条评论
为什么被折叠?
 到【灌水乐园】发言


