import random
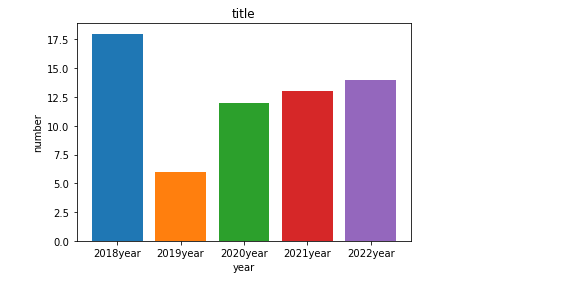
x =["20{}year".format(i)for i inrange(18,23)]
y =[random.randint(1,20)for i inrange(5)]for i inrange(len(x)):
plt.bar(x[i],y[i])
plt.title("title")
plt.xlabel("year")
plt.ylabel("number")
plt.show()
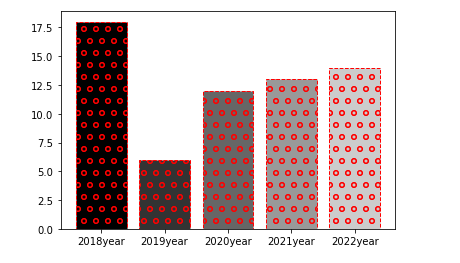
for i inrange(len(x)):
plt.bar(x[i],y[i],color=(0.2*i,0.2*i,0.2*i),linestyle="--",hatch="o",edgecolor="r")#i=0,color = (0,0,0); i=1,color=(0.2,0.2,0.2)#color = (R,G,B)
x =["20{}year".format(i)for i inrange(18,23)]
y =list(random.randint(1,20)for i inrange(5))#y = [random.randint(1,20)for i in range(5)]
y2 =list(random.randint(1,20)for i inrange(5))
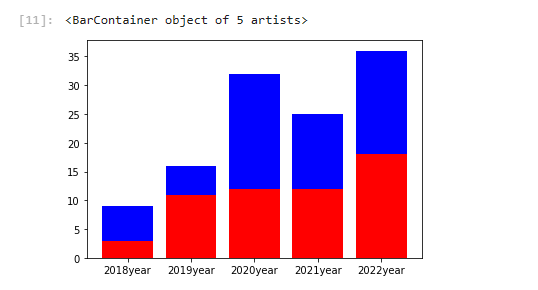
plt.bar(x,y,lw=0.5,fc="r")# lw:length wide ,fc:face color
plt.bar(x,y2,Lw=0.5,fc="b",bottom=y)# bottom:控制哪个图显示在底部
x =["20{}year".format(i)for i inrange(18,23)]
y =list(random.randint(1,20)for i inrange(5))
y2 =list(random.randint(1,20)for i inrange(5))
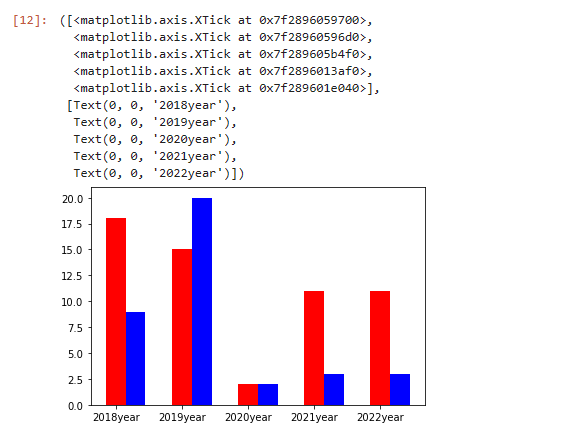
x_width =range(0,len(x))
x2_width =[i+0.3for i in x_width]
plt.bar(x_width,y,lw=0.5,fc="r",width=0.3)
plt.bar(x2_width,y2,lw=0.5,fc="b",width=0.3)
plt.xticks(range(0,5),x)#(刻度位置,标签)
x =["20{}year".format(i)for i inrange(18,23)]
y =list(random.randint(1,20)for i inrange(5))
y2 =list(random.randint(1,20)for i inrange(5))
x_width =range(0,len(x))
x2_width =[i+0.3for i in x_width]
plt.barh(x_width,y,lw=0.5,fc="r",height=0.3,label="cat")
plt.barh(x2_width,y2,Lw=0.5,fc="b",height=0.3,label="dog")
plt.yticks(range(0,5),x)
plt.legend()
plt.title("title")
plt.ylabel("year")
plt.xlabel("number")
plt.show()
x =["20{}year".format(i)for i inrange(18,23)]
y =list(random.randint(1,20)for i inrange(5))
y2 =list(random.randint(1,20)for i inrange(5))
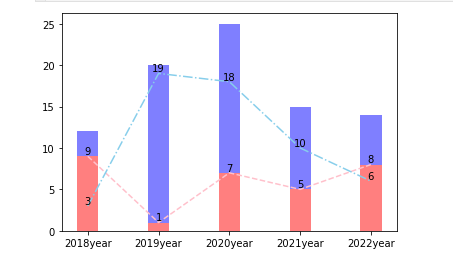
plt.plot(x,y,color="pink",linestyle="--")
plt.plot(x,y2,color="skyblue",linestyle="-.")#柱状图
plt.bar(x,y,lw=0.5,fc="r",width=0.3,alpha=0.5)
plt.bar(x,y2,lw=0.5,fc="b",width=0.3,alpha=0.5,bottom=y)#alpha:控制透明度,[0,1]for i,j inzip(x,y):
plt.text(i,j,"%d"%j,ha="center",va="bottom")for i2,j2 inzip(x,y2):
plt.text(i2,j2,"%d"%j2,ha="center",va="bottom")
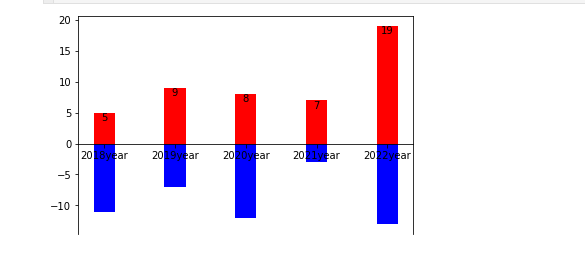
x =["20{}year".format(i)for i inrange(18,23)]
y =list(random.randint(1,20)for i inrange(5))
y2 =list(random.randint(-20,-1)for i inrange(5))
ax = plt.gca()# 获取当前的axes
ax.spines ["bottom"].set_position(('data',0))# ax.spinesp["bottom"]:底部边界线(x轴)# ax.spines["bottom"].set_position():设置x轴位置
plt.bar(x,y,lw=0.5,fc="r",width=0.3)
plt.bar(x,y2,lw=0.5,fc="b",width=0.3)for i,j inzip(x,y):
plt.text(i,j,"%d"%j,ha="center",va="top")for i2,j2 inzip(x,y2):
plt.text(12,-j2,"%d"%j2,ha="center",va="bottom")


 132
132


 被折叠的 条评论
为什么被折叠?
被折叠的 条评论
为什么被折叠?
 到【灌水乐园】发言


