


H800基础能力测试
本文记录了H800基础测试步骤及测试结果
参考链接
- NVIDIA H100 Tensor Core GPU Architecture
- How to calculate the Tensor Core FP16 performance of H100?
- NVIDIA H100 PCIe 80 GB
- NVIDIA H800 Tensor Core GPU
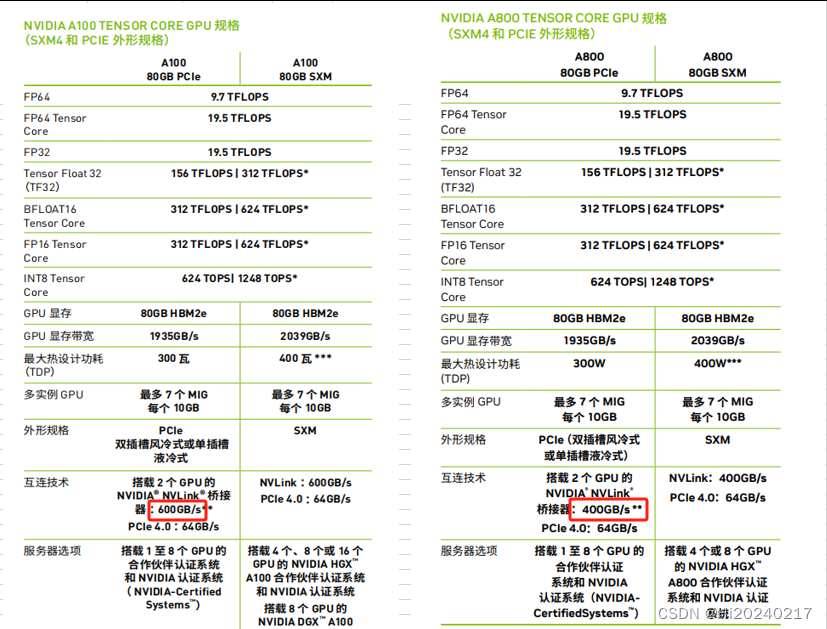
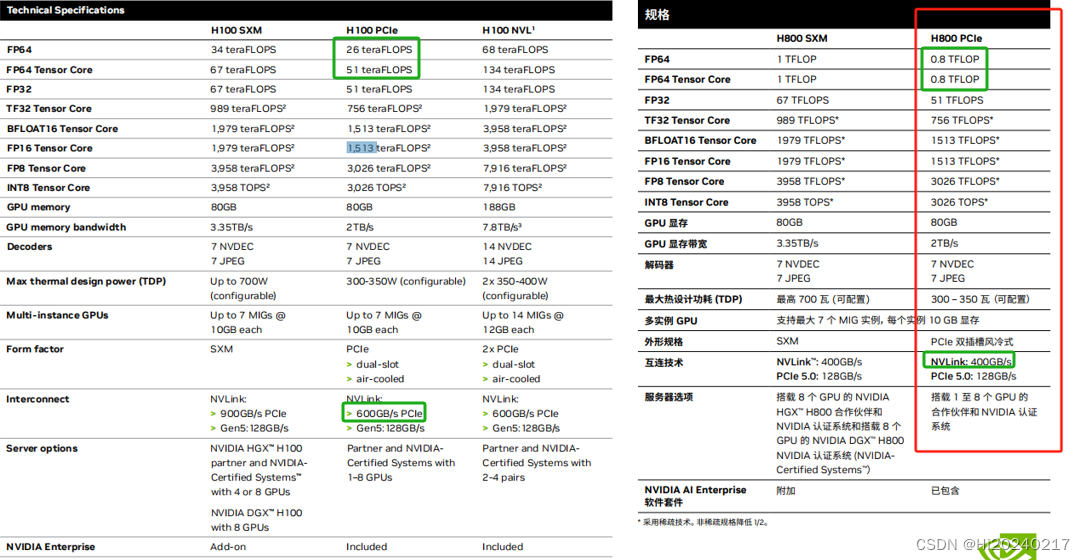
A100、A800、H100、H800差异
H100详细规格
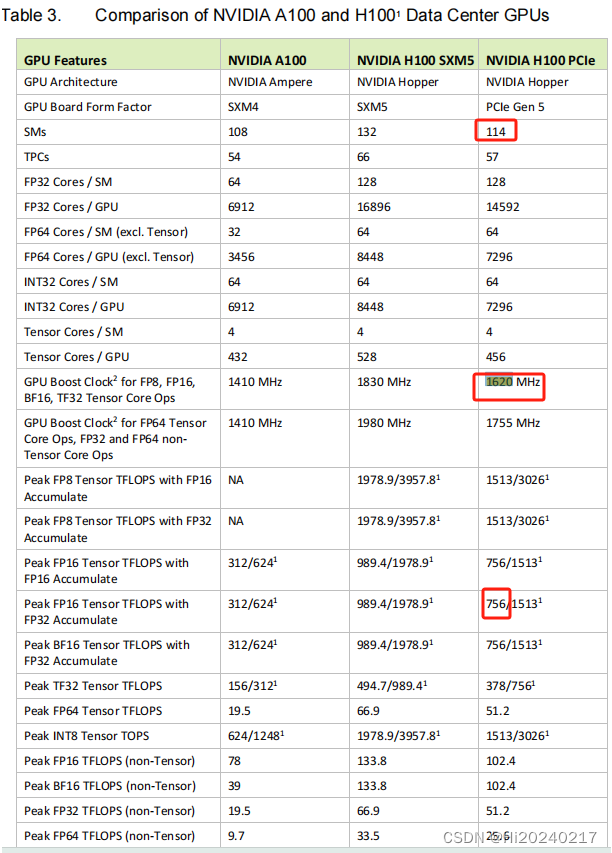
H100 TensorCore FP16 理论算力计算公式
- 4096 FLOP/clk per SM.
- The H100 PCIE has 114 SMs
- 114 x 4096 = 466944 FLOP/clk
- BoostClock:1620MHz
- 114 x 4096 x1620M/1000/1000=756 TFLOPS
- 当前的卡最大频率为1980–> 114 x 4096 x1980M/1000/1000=924 TFLOPS
锁频
nvidia-smi -q -d SUPPORTED_CLOCKS
nvidia-smi -lgc 1980,1980
nvidia-smi --lock-memory-clocks-deferred=2619
安装依赖
pip3 install https://github.com/cupy/cupy/releases/download/v13.1.0/cupy_cuda12x-13.1.0-cp310-cp310-manylinux2014_x86_64.whl
pip3 install pycuda
pytorch FP16算力测试
tee torch_flops.py <<-'EOF'
import pycuda.autoinit
import pycuda.driver as cuda
import torch
import time

def benchmark_pytorch_fp16(M,N,K, num_runs):
    # 确保使用 GPU 并设置数据类型为半精度浮点数 (float16)
    device = torch.device('cuda' if torch.cuda.is_available() else 'cpu')
    dtype = torch.float16
    # 生成随机矩阵
    A = torch.randn((M, K), device=device, dtype=dtype)
    B = torch.randn((K, N), device=device, dtype=dtype)
    # 预热 GPU,进行一次矩阵乘法
    C = torch.matmul(A, B)
    # 记录开始时间
    start_time = time.time()
    # 多次进行矩阵乘法,计算 FLOPS
    start = cuda.Event()
    end = cuda.Event()
    start.record()
    for _ in range(num_runs):
        C = torch.mm(A, B)
    end.record()
    torch.cuda.synchronize()
    elapsed_time = start.time_till(end) / num_runs
    # 计算 GFLOPS
    num_operations = 2 * M*N*K
    gflops = num_operations / (elapsed_time * 1e-3) / 1e12
    return elapsed_time, gflops
    # 记录结束时间
    end_time = time.time()
    # 计算平均运行时间
    elapsed_time = (end_time - start_time) / num_runs
    # 计算总的 FLOPs
    total_flops = 2 * M*K*N
    # 计算 GFLOPS
    gflops = total_flops / elapsed_time / 1e12
    return elapsed_time, gflops
# 设置矩阵大小和运行次数
num_runs = 32
M=2048
N=2048
K=40960
for i in range(5):
    # 运行基准测试
    elapsed_time, gflops = benchmark_pytorch_fp16(M,N,K, num_runs)
    # 输出结果
    print(f"Num:{i} 矩阵乘法大小: {M}x{K}X{N} 平均运行时间: {elapsed_time:.6f} 秒 TFLOPS: {gflops:.2f}")
    time.sleep(0.1)
EOF
python3 torch_flops.py
输出(790/924=85%)
Num:0 矩阵乘法大小: 2048x40960X2048 平均运行时间: 0.441580 秒 TFLOPS: 778.11
Num:1 矩阵乘法大小: 2048x40960X2048 平均运行时间: 0.430380 秒 TFLOPS: 798.36
Num:2 矩阵乘法大小: 2048x40960X2048 平均运行时间: 0.430523 秒 TFLOPS: 798.09
Num:3 矩阵乘法大小: 2048x40960X2048 平均运行时间: 0.430742 秒 TFLOPS: 797.69
Num:4 矩阵乘法大小: 2048x40960X2048 平均运行时间: 0.430283 秒 TFLOPS: 798.54
cublas FP16算力测试
tee cublas_flops.py <<-'EOF'
import cupy as cp
import numpy as np
from cupy._core import _dtype
from cupy.cuda import cublas
from time import time
from ctypes import c_void_p, c_float, cast, pointer, byref
import pycuda.autoinit
import pycuda.driver as cuda

def cublas_fp16_strided_batched_gemm(M,N,K, batch_size, num_runs):
    # 创建随机半精度矩阵并转换为 CuPy 数组
    cp.cuda.Device(0).use()
    A = cp.random.randn(batch_size, M, K).astype(cp.float16)
    B = cp.random.randn(batch_size, K, N).astype(cp.float16)
    C = cp.empty((batch_size, M, N), dtype=cp.float16)
    # 创建 cuBLAS 句柄
    handle = cublas.create()
    # 标量 alpha 和 beta
    alpha = np.array(1, dtype=np.float16)
    beta = np.array(0, dtype=np.float16)
    cublas.setMathMode(handle, cublas.CUBLAS_TENSOR_OP_MATH)
    algo = cublas.CUBLAS_GEMM_DEFAULT_TENSOR_OP
    try:
        # Warm-up (预热)
        for j in range(1):
            cublas.gemmStridedBatchedEx(handle,
                                        cublas.CUBLAS_OP_N, cublas.CUBLAS_OP_N,
                                        M, N, K,
                                        alpha.ctypes.data, A.data.ptr,
                                        _dtype.to_cuda_dtype(A.dtype,True), M, M * K,
                                        B.data.ptr, _dtype.to_cuda_dtype(B.dtype,True), K, K * N,
                                        beta.ctypes.data, C.data.ptr, _dtype.to_cuda_dtype(C.dtype,True), M, M * N,
                                        batch_size,
                                        _dtype.to_cuda_dtype(C.dtype,True), algo)
        cp.cuda.Device(0).synchronize()
        # 实际基准测试
        start = cuda.Event()
        end = cuda.Event()
        start.record()
        start_time = time()
        for _ in range(num_runs):
            cublas.gemmStridedBatchedEx(handle,
                                        cublas.CUBLAS_OP_N, cublas.CUBLAS_OP_N,
                                        M, N, K,
                                        alpha.ctypes.data, A.data.ptr,
                                        _dtype.to_cuda_dtype(A.dtype,True), M, M * K,
                                        B.data.ptr, _dtype.to_cuda_dtype(B.dtype,True), K, K * N,
                                        beta.ctypes.data, C.data.ptr, _dtype.to_cuda_dtype(C.dtype,True), M, M * N,
                                        batch_size,
                                        _dtype.to_cuda_dtype(C.dtype,True), algo)
        end.record()
        cp.cuda.Device(0).synchronize()
        end_time = time()
    except cp.cuda.runtime.CUDARuntimeError as e:
        print(f"CUDA 运行时错误: {e}")
        cublas.destroy(handle)
        return None, None
    elapsed_time = start.time_till(end) / num_runs
    # 计算 GFLOPS
    num_operations = 2 * M*N*K*batch_size
    gflops = num_operations / (elapsed_time * 1e-3) / 1e12
    return elapsed_time, gflops
    elapsed_time = (end_time - start_time) / num_runs
    num_ops = 2*M*K*N*batch_size
    gflops = num_ops / elapsed_time / 1e12
    cublas.destroy(handle)
    return elapsed_time, gflops
num_runs = 32
M=2048
N=2048
K=40960
matrix_size = 1
for i in range(5):
    elapsed_time, gflops = cublas_fp16_strided_batched_gemm(M,N,K,matrix_size,num_runs)
    print(f"Num:{i} 矩阵乘法大小: {M}x{K}X{N} 平均运行时间: {elapsed_time:.6f} 秒 TFLOPS: {gflops:.2f}")
EOF
python3 cublas_flops.py
输出(817/924=88%)
Num:0 矩阵乘法大小: 2048x40960X2048 平均运行时间: 0.421070 秒 TFLOPS: 816.01
Num:1 矩阵乘法大小: 2048x40960X2048 平均运行时间: 0.420407 秒 TFLOPS: 817.30
Num:2 矩阵乘法大小: 2048x40960X2048 平均运行时间: 0.420305 秒 TFLOPS: 817.50
Num:3 矩阵乘法大小: 2048x40960X2048 平均运行时间: 0.420304 秒 TFLOPS: 817.50
Num:4 矩阵乘法大小: 2048x40960X2048 平均运行时间: 0.420554 秒 TFLOPS: 817.01
运行cuda-samples
git clone https://www.github.com/nvidia/cuda-samples
cd cuda-samples/Samples/1_Utilities/deviceQuery
make clean && make
./deviceQuery
cd ../bandwidthTest/
make clean && make
./bandwidthTest
cd ../../4_CUDA_Libraries/batchCUBLAS/
make clean && make
./batchCUBLAS -m8192 -n8192 -k8192 --device=0
输出
Device 0: "NVIDIA H800"
  CUDA Driver Version / Runtime Version          12.2 / 12.2
  CUDA Capability Major/Minor version number:    9.0
  Total amount of global memory:                 81008 MBytes (84942979072 bytes)
  (132) Multiprocessors, (128) CUDA Cores/MP:    16896 CUDA Cores
  GPU Max Clock rate:                            1980 MHz (1.98 GHz)
  Memory Clock rate:                             2619 Mhz
  Memory Bus Width:                              5120-bit
  L2 Cache Size:                                 52428800 bytes
  Maximum Texture Dimension Size (x,y,z)         1D=(131072), 2D=(131072, 65536), 3D=(16384, 16384, 16384)
  Maximum Layered 1D Texture Size, (num) layers  1D=(32768), 2048 layers
  Maximum Layered 2D Texture Size, (num) layers  2D=(32768, 32768), 2048 layers
  Total amount of constant memory:               65536 bytes
  Total amount of shared memory per block:       49152 bytes
  Total shared memory per multiprocessor:        233472 bytes
  Total number of registers available per block: 65536
  Warp size:                                     32
  Maximum number of threads per multiprocessor:  2048
  Maximum number of threads per block:           1024
  Max dimension size of a thread block (x,y,z): (1024, 1024, 64)
  Max dimension size of a grid size    (x,y,z): (2147483647, 65535, 65535)
  Maximum memory pitch:                          2147483647 bytes
  Texture alignment:                             512 bytes
  Concurrent copy and kernel execution:          Yes with 3 copy engine(s)
  Run time limit on kernels:                     No
  Integrated GPU sharing Host Memory:            No
  Support host page-locked memory mapping:       Yes
  Alignment requirement for Surfaces:            Yes
  Device has ECC support:                        Enabled
  Device supports Unified Addressing (UVA):      Yes
  Device supports Managed Memory:                Yes
  Device supports Compute Preemption:            Yes
  Supports Cooperative Kernel Launch:            Yes
  Supports MultiDevice Co-op Kernel Launch:      Yes
  Device PCI Domain ID / Bus ID / location ID:   0 / 215 / 0
  Compute Mode:
     < Default (multiple host threads can use ::cudaSetDevice() with device simultaneously) >
-----------------------------------------------------------------------------------------------------

|===================== GPU =====================|
|  Main Memory (GDDR6X, 80GB)              |
------------------------------------------------
|                L2 Cache (50MB)                |
------------------------------------------------
|<--- SM (Streaming Multiprocessor) --->|
------------------------------------------------
|  Register File   | L1 Cache/Shared Memory     |
|   (128KB)        |    (228KB/48KB)            |
------------------------------------------------
|  Data Cache (100KB) | Texture Cache (48-128KB)|
------------------------------------------------


[CUDA Bandwidth Test] - Starting...
Running on...

 Device 0: NVIDIA H800
 Quick Mode

 Host to Device Bandwidth, 1 Device(s)
 PINNED Memory Transfers
   Transfer Size (Bytes)        Bandwidth(GB/s)
   32000000                     55.2

 Device to Host Bandwidth, 1 Device(s)
 PINNED Memory Transfers
   Transfer Size (Bytes)        Bandwidth(GB/s)
   32000000                     55.3

 Device to Device Bandwidth, 1 Device(s)
 PINNED Memory Transfers
   Transfer Size (Bytes)        Bandwidth(GB/s)
   32000000                     2085.3

Result = PASS

-----------------------------------------------------------------------------------------------------

 ==== Running single kernels ====

Testing sgemm
#### args: ta=0 tb=0 m=8192 n=8192 k=8192  alpha = (0xbf800000, -1) beta= (0x40000000, 2)
#### args: lda=8192 ldb=8192 ldc=8192
^^^^ elapsed = 0.04317784 sec  GFLOPS=25464.7
@@@@ sgemm test OK
Testing dgemm
#### args: ta=0 tb=0 m=8192 n=8192 k=8192  alpha = (0x0000000000000000, 0) beta= (0x0000000000000000, 0)
#### args: lda=8192 ldb=8192 ldc=8192
^^^^ elapsed = 0.00023699 sec  GFLOPS=4.63952e+06
@@@@ dgemm test OK

 ==== Running N=10 without streams ====

Testing sgemm
#### args: ta=0 tb=0 m=8192 n=8192 k=8192  alpha = (0xbf800000, -1) beta= (0x00000000, 0)
#### args: lda=8192 ldb=8192 ldc=8192
^^^^ elapsed = 0.22819090 sec  GFLOPS=48183.9
@@@@ sgemm test OK
Testing dgemm
#### args: ta=0 tb=0 m=8192 n=8192 k=8192  alpha = (0xbff0000000000000, -1) beta= (0x0000000000000000, 0)
#### args: lda=8192 ldb=8192 ldc=8192
^^^^ elapsed = 11.56301594 sec  GFLOPS=950.887
@@@@ dgemm test OK

 ==== Running N=10 with streams ====

Testing sgemm
#### args: ta=0 tb=0 m=8192 n=8192 k=8192  alpha = (0x40000000, 2) beta= (0x40000000, 2)
#### args: lda=8192 ldb=8192 ldc=8192
^^^^ elapsed = 0.23047590 sec  GFLOPS=47706.1
@@@@ sgemm test OK
Testing dgemm
#### args: ta=0 tb=0 m=8192 n=8192 k=8192  alpha = (0xbff0000000000000, -1) beta= (0x0000000000000000, 0)
#### args: lda=8192 ldb=8192 ldc=8192
^^^^ elapsed = 11.38687706 sec  GFLOPS=965.595
@@@@ dgemm test OK

 ==== Running N=10 batched ====

Testing sgemm
#### args: ta=0 tb=0 m=8192 n=8192 k=8192  alpha = (0x3f800000, 1) beta= (0xbf800000, -1)
#### args: lda=8192 ldb=8192 ldc=8192
^^^^ elapsed = 0.21581888 sec  GFLOPS=50946
@@@@ sgemm test OK
Testing dgemm
#### args: ta=0 tb=0 m=8192 n=8192 k=8192  alpha = (0xbff0000000000000, -1) beta= (0x4000000000000000, 2)
#### args: lda=8192 ldb=8192 ldc=8192
^^^^ elapsed = 11.38980007 sec  GFLOPS=965.348
@@@@ dgemm test OK

Test Summary
0 error(s)
pytorch conv2d fp16 算力测试及profing
tee torch_conv_fp16_flops.py <<-'EOF'
import torch
import torch.nn.functional as F
import time
import nvtx

def measure_conv2d_tflops(batch_size, in_channels, out_channels, input_height, input_width, kernel_height, kernel_width, stride, padding, dtype=torch.float16):
    # Create random input and kernel tensors
    input = torch.randn((batch_size, in_channels, input_height, input_width), dtype=dtype, device='cuda')
    kernel = torch.randn((out_channels, in_channels, kernel_height, kernel_width), dtype=dtype, device='cuda')
    num_iterations = 32

    # Warm up
    for _ in range(1):
        output = F.conv2d(input, kernel, stride=stride, padding=padding)

    range_id=nvtx.start_range("MYPerf")
    for _ in range(1):
        torch.cuda.synchronize()
        output = F.conv2d(input, kernel, stride=stride, padding=padding)
        torch.cuda.synchronize()
    nvtx.end_range(range_id)

    start_time = time.time()
    for i in range(num_iterations):
        output = F.conv2d(input, kernel, stride=stride, padding=padding)
    torch.cuda.synchronize()
    end_time = time.time()

    elapsed_time = (end_time - start_time) / num_iterations    # Average time per iteration

    # Calculate number of floating point operations
    output_height = (input_height - kernel_height + 2 * padding) // stride + 1
    output_width = (input_width - kernel_width + 2 * padding) // stride + 1
    num_floats_per_conv = 2 * out_channels * in_channels * kernel_height * kernel_width * output_height * output_width
    num_floats_per_batch = num_floats_per_conv * batch_size

    # Convert elapsed time to seconds
    elapsed_time_seconds = elapsed_time

    # Calculate TFLOPS
    tflops = (num_floats_per_batch / (elapsed_time_seconds * 1e12))

    # Print results
    print(f"{num_floats_per_batch} Input shape: ({batch_size}, {in_channels}, {input_height}, {input_width}) Kernel shape: ({out_channels}, {in_channels}, {kernel_height}, {kernel_width}) Output shape: ({batch_size}, {out_channels}, {output_height}, {output_width}) Elapsed time per iteration: {elapsed_time_seconds * 1e3:.3f} ms Performance: {tflops:.3f} TFLOPS")

    return tflops

batch_size = 4
in_channels = 2048
out_channels = 2048
input_height = 224
input_width = 224
kernel_height = 3
kernel_width = 3
stride = 1
padding = 1

tflops = measure_conv2d_tflops(batch_size, in_channels, out_channels, input_height, input_width,
                                kernel_height, kernel_width, stride, padding)

EOF

ncu --nvtx  --nvtx-include "MYPerf" --target-processes all \
    --metrics sm__inst_executed_pipe_tensor_op_hmma.avg.pct_of_peak_sustained_active,dram__bytes_read.sum,dram__bytes_write.sum,sm__throughput.avg.pct_of_peak_sustained_active,dram__throughput.avg.pct_of_peak_sustained_active,gpu__time_duration.avg python3 torch_conv_fp16_flops.py
输出
仅算gemm kernel:15152644620288 flops/20.00 ms= 757 TFLOPS MAC效率: 757/924=81%
==PROF== Connected to process 155905 (/usr/bin/nvidia-smi)
==PROF== Target process 155906 terminated before first instrumented API call.
==PROF== Target process 155907 terminated before first instrumented API call.
==PROF== Target process 155908 terminated before first instrumented API call.
==PROF== Target process 155909 terminated before first instrumented API call.
==PROF== Target process 155910 terminated before first instrumented API call.
==PROF== Target process 155911 terminated before first instrumented API call.
==PROF== Target process 155912 terminated before first instrumented API call.
==PROF== Target process 155913 terminated before first instrumented API call.
==PROF== Disconnected from process 155905
==PROF== Connected to process 155840 (/usr/bin/python3.10)
==PROF== Profiling "nchwToNhwcKernel" - 0: 0%....50%....100% - 9 passes
==PROF== Profiling "nchwToNhwcKernel" - 1: 0%....50%....100% - 9 passes
==PROF== Profiling "sm90_xmma_fprop_implicit_gemm..." - 2: 0%....50%....100% - 9 passes
==PROF== Profiling "nhwcToNchwKernel" - 3: 0%....50%....100% - 9 passes
15152644620288 Input shape: (4, 2048, 224, 224) Kernel shape: (2048, 2048, 3, 3) Output shape: (4, 2048, 224, 224) Elapsed time per iteration: 23.834 ms Performance: 635.745 TFLOPS

==PROF== Disconnected from process 155840
[155840] python3.10@127.0.0.1
  void cudnn::ops::nchwToNhwcKernel<__half, __half, float, (bool)0, (bool)1, (cudnnKernelDataType_t)0>(cudnn::ops::nchw2nhwc_params_t<T3>, const T1 *, T2 *) (1568, 64, 4)x(256, 1, 1), Context 1, Stream 7, Device 0, CC 9.0

    NVTX Start/End Ranges:
      <default domain>
        <0,MYPerf>
          RGB: 0xff
          REGISTERED: MYPerf
    Section: Command line profiler metrics
    ---------------------------------------------------------------------- ----------- ------------
    Metric Name                                                            Metric Unit Metric Value
    ---------------------------------------------------------------------- ----------- ------------
    dram__bytes_read.sum                                                         Mbyte       822.10
    dram__bytes_write.sum                                                        Mbyte       807.70
    dram__throughput.avg.pct_of_peak_sustained_active                                %          100
    gpu__time_duration.avg                                                     usecond       758.30
    sm__inst_executed_pipe_tensor_op_hmma.avg.pct_of_peak_sustained_active           %            0
    sm__throughput.avg.pct_of_peak_sustained_active                                  %        60.56
    ---------------------------------------------------------------------- ----------- ------------

  void cudnn::ops::nchwToNhwcKernel<__half, __half, float, (bool)0, (bool)1, (cudnnKernelDataType_t)0>(cudnn::ops::nchw2nhwc_params_t<T3>, const T1 *, T2 *) (1, 64, 2048)x(256, 1, 1), Context 1, Stream 7, Device 0, CC 9.0

    NVTX Start/End Ranges:
      <default domain>
        <0,MYPerf>
          RGB: 0xff
          REGISTERED: MYPerf
    Section: Command line profiler metrics
    ---------------------------------------------------------------------- ----------- ------------
    Metric Name                                                            Metric Unit Metric Value
    ---------------------------------------------------------------------- ----------- ------------
    dram__bytes_read.sum                                                         Mbyte        75.51
    dram__bytes_write.sum                                                        Mbyte        61.67
    dram__throughput.avg.pct_of_peak_sustained_active                                %          100
    gpu__time_duration.avg                                                     usecond       222.50
    sm__inst_executed_pipe_tensor_op_hmma.avg.pct_of_peak_sustained_active           %            0
    sm__throughput.avg.pct_of_peak_sustained_active                                  %       100.36
    ---------------------------------------------------------------------- ----------- ------------

  sm90_xmma_fprop_implicit_gemm_f16f16_f16f32_f32_nhwckrsc_nhwc_tilesize128x128x64_warpgroupsize1x1x1_g1_execute_segment_k_off_kernel_cudnn_infer (15, 8, 1)x(384, 1, 1), Context 1, Stream 7, Device 0, CC 9.0

    NVTX Start/End Ranges:
      <default domain>
        <0,MYPerf>
          RGB: 0xff
          REGISTERED: MYPerf
    Section: Command line profiler metrics
    ---------------------------------------------------------------------- ----------- ------------
    Metric Name                                                            Metric Unit Metric Value
    ---------------------------------------------------------------------- ----------- ------------
    dram__bytes_read.sum                                                         Gbyte        14.08
    dram__bytes_write.sum                                                        Mbyte       821.61
    dram__throughput.avg.pct_of_peak_sustained_active                                %          100
    gpu__time_duration.avg                                                     msecond        20.00
    sm__inst_executed_pipe_tensor_op_hmma.avg.pct_of_peak_sustained_active           %         3.12
    sm__throughput.avg.pct_of_peak_sustained_active                                  %        99.72
    ---------------------------------------------------------------------- ----------- ------------

  void cudnn::ops::nhwcToNchwKernel<__half, __half, float, (bool)1, (bool)0, (cudnnKernelDataType_t)0>(cudnn::ops::nhwc2nchw_params_t<T3>, const T1 *, T2 *) (1568, 64, 4)x(256, 1, 1), Context 1, Stream 7, Device 0, CC 9.0

    NVTX Start/End Ranges:
      <default domain>
        <0,MYPerf>
          RGB: 0xff
          REGISTERED: MYPerf
    Section: Command line profiler metrics
    ---------------------------------------------------------------------- ----------- ------------
    Metric Name                                                            Metric Unit Metric Value
    ---------------------------------------------------------------------- ----------- ------------
    dram__bytes_read.sum                                                         Mbyte       822.10
    dram__bytes_write.sum                                                        Mbyte       809.08
    dram__throughput.avg.pct_of_peak_sustained_active                                %          100
    gpu__time_duration.avg                                                     usecond       862.85
    sm__inst_executed_pipe_tensor_op_hmma.avg.pct_of_peak_sustained_active           %            0
    sm__throughput.avg.pct_of_peak_sustained_active                                  %        46.48
    ---------------------------------------------------------------------- ----------- ------------
TRT conv2d fp16算力测试
tee trt_conv_fp16_flops.py <<-'EOF'
import os
import time
import numpy as np
import tensorrt as trt
import pycuda.driver as cuda
import pycuda.autoinit
import nvtx

def load_engine(engine_path, logger):
    if os.path.exists(engine_path):
        with open(engine_path, "rb") as f, trt.Runtime(logger) as runtime:
            return runtime.deserialize_cuda_engine(f.read())
    else:
        return None

def save_engine(engine, engine_path):
    with open(engine_path, "wb") as f:
        f.write(engine.serialize())

def build_and_measure_conv2d_tflops_fp16(engine_path, batch_size, in_channels, out_channels, input_height, input_width,
                                        kernel_height, kernel_width, stride, padding):
    logger = trt.Logger(trt.Logger.WARNING)
    builder = trt.Builder(logger)
    explicit_batch = 1 << int(trt.NetworkDefinitionCreationFlag.EXPLICIT_BATCH)
    network = builder.create_network(explicit_batch)
    config = builder.create_builder_config()
    config.set_flag(trt.BuilderFlag.FP16)
    config.set_memory_pool_limit(trt.MemoryPoolType.WORKSPACE, 1 << 28)

    input_tensor = network.add_input("input_tensor", trt.float16, (batch_size,in_channels, input_height, input_width))

    kernel = np.random.rand(out_channels, in_channels, kernel_height, kernel_width).astype(np.float16)
    bias = np.zeros(out_channels, dtype=np.float16)
    conv_layer = network.add_convolution_nd(input=input_tensor,
                                         num_output_maps=out_channels,
                                         kernel_shape=(kernel_height, kernel_width),
                                         kernel=kernel,
                                         bias=bias)
    conv_layer.stride_nd = (stride, stride)
    conv_layer.padding_nd = (padding, padding)
    # 设置卷积层的输出类型为 FP16
    conv_layer.precision = trt.DataType.HALF
    conv_layer.set_output_type(0, trt.DataType.HALF)

    # 设置网络的输出类型为 FP16
    output_tensor = conv_layer.get_output(0)
    output_tensor.dtype = trt.float16
    network.mark_output(output_tensor)

    engine = load_engine(engine_path, logger)
    if engine is None:
        start_engine_build_time = time.time()
        serialized_engine = builder.build_serialized_network(network, config)
        runtime = trt.Runtime(logger)
        engine = runtime.deserialize_cuda_engine(serialized_engine)
        end_engine_build_time = time.time()
        print(f"引擎构建时间: {end_engine_build_time - start_engine_build_time:.2f}秒")
        save_engine(engine, engine_path)
    else:
        print("加载缓存的引擎")

    context = engine.create_execution_context()

    input_size = trt.volume((batch_size, in_channels, input_height, input_width)) * trt.float16.itemsize
    output_size = trt.volume((batch_size, out_channels,
                              (input_height - kernel_height + 2 * padding) // stride + 1,
                              (input_width - kernel_width + 2 * padding) // stride + 1)) * trt.float16.itemsize
    d_input = cuda.mem_alloc(input_size)
    d_output = cuda.mem_alloc(output_size)

    input_data = np.random.rand(batch_size, in_channels, input_height, input_width).astype(np.float16)
    cuda.memcpy_htod(d_input, input_data)
    stream = cuda.Stream()

    # 首次执行以初始化所有资源和缓存
    context.execute_async_v2(bindings=[int(d_input), int(d_output)], stream_handle=stream.handle)
    stream.synchronize()

    range_id=nvtx.start_range("MYPerf")
    context.execute_async_v2(bindings=[int(d_input), int(d_output)], stream_handle=stream.handle)
    stream.synchronize()
    nvtx.end_range(range_id)

    num_iterations = 32
    start_time = time.time()
    for _ in range(num_iterations):
        context.execute_async_v2(bindings=[int(d_input), int(d_output)], stream_handle=stream.handle)
    stream.synchronize()
    end_time = time.time()

    elapsed_time = (end_time - start_time) / num_iterations

    output_height = (input_height - kernel_height + 2 * padding) // stride + 1
    output_width = (input_width - kernel_width + 2 * padding) // stride + 1
    num_floats_per_conv = 2 * out_channels * in_channels * kernel_height * kernel_width * output_height * output_width
    num_floats_per_batch = num_floats_per_conv * batch_size
    elapsed_time_seconds = elapsed_time
    tflops = (num_floats_per_batch / (elapsed_time_seconds * 1e12))

    print(f"输入形状: ({batch_size}, {in_channels}, {input_height}, {input_width})")
    print(f"卷积核形状: ({out_channels}, {in_channels}, {kernel_height}, {kernel_width})")
    print(f"输出形状: ({batch_size}, {out_channels}, {output_height}, {output_width})")
    print(f"每次迭代花费时间: {elapsed_time_seconds * 1e3:.3f} ms")
    print(f"FP16性能: {tflops:.3f} TFLOPS")
    print(f"num_floats_per_batch: {num_floats_per_batch:.3f} FLOPS")

    return tflops

# 配置参数
batch_size = 4
in_channels = 2048
out_channels = 2048
input_height = 224
input_width = 224
kernel_height = 3
kernel_width = 3
stride = 1
padding = 1
engine_path = "conv_fp16.engine"

# 测量FP16卷积性能
tflops = build_and_measure_conv2d_tflops_fp16(
    engine_path, batch_size, in_channels, out_channels, input_height, input_width,
    kernel_height, kernel_width, stride, padding
)
EOF
rm -f conv_fp16.engine
python3 trt_conv_fp16_flops.py

ncu --nvtx  --nvtx-include "MYPerf" --target-processes all \
    --metrics sm__inst_executed_pipe_tensor_op_hmma.avg.pct_of_peak_sustained_active,dram__bytes_read.sum,dram__bytes_write.sum,sm__throughput.avg.pct_of_peak_sustained_active,dram__throughput.avg.pct_of_peak_sustained_active,gpu__time_duration.avg python3 trt_conv_fp16_flops.py
输出
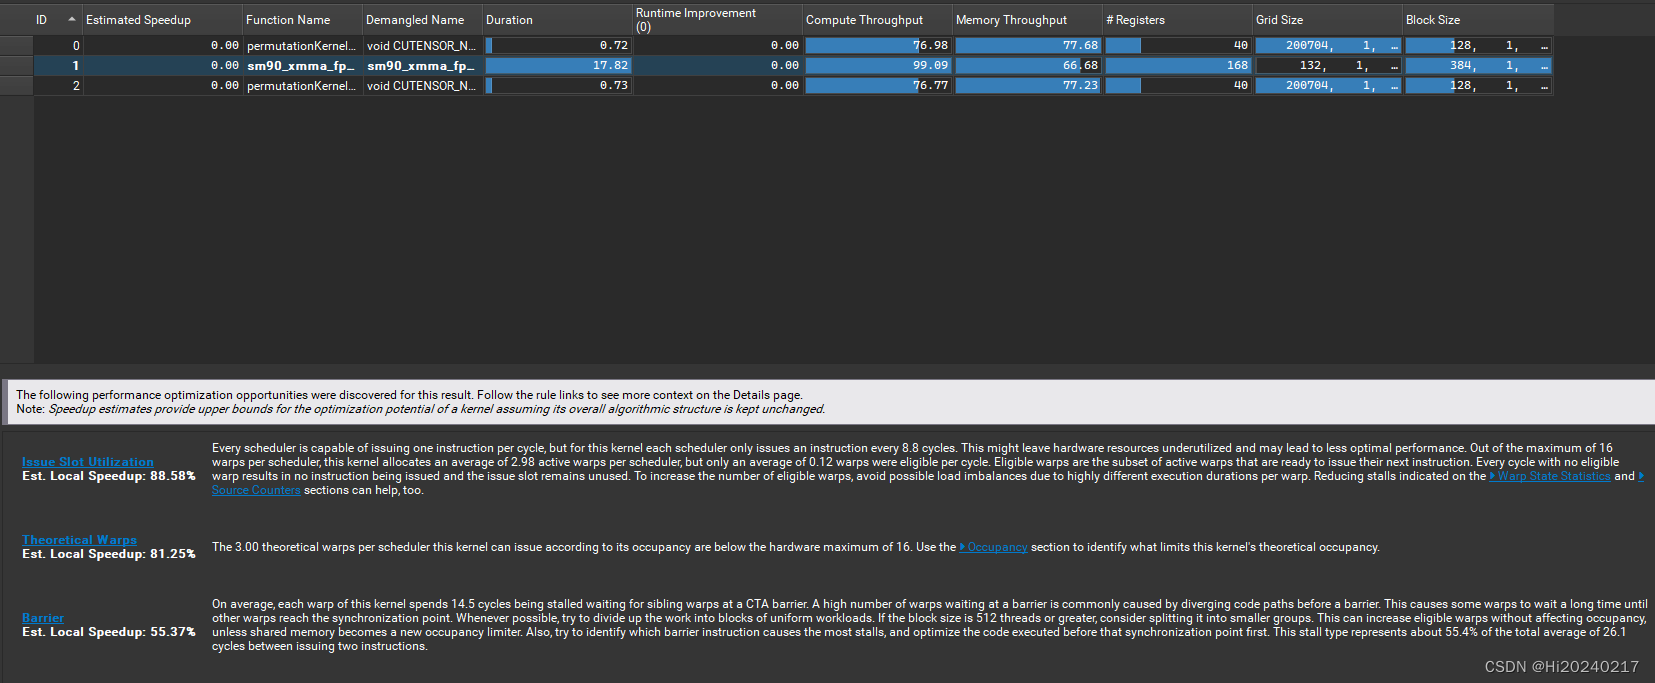
仅算gemm kernel:15152644620288 flops/17.82 ms= 850 TFLOPS MAC效率: 850/924=92%
引擎构建时间: 234.23秒
输入形状: (4, 2048, 224, 224)
卷积核形状: (2048, 2048, 3, 3)
输出形状: (4, 2048, 224, 224)
每次迭代花费时间: 19.617 ms
FP16性能: 772.409 TFLOPS

==PROF== Connected to process 156133 (/usr/bin/python3.10)
[05/24/2024-08:59:45] [TRT] [W] Tensor DataType is determined at build time for tensors not marked as input or output.
加载缓存的引擎
==PROF== Profiling "permutationKernelPLC3" - 0: 0%....50%....100% - 9 passes
==PROF== Profiling "sm90_xmma_fprop_implicit_gemm..." - 1: 0%....50%....100% - 9 passes
==PROF== Profiling "permutationKernelPLC3" - 2: 0%....50%....100% - 9 passes
输入形状: (4, 2048, 224, 224)
卷积核形状: (2048, 2048, 3, 3)
输出形状: (4, 2048, 224, 224)
每次迭代花费时间: 19.904 ms
FP16性能: 761.305 TFLOPS
num_floats_per_batch: 15152644620288.000 FLOPS

==PROF== Disconnected from process 156133
[156133] python3.10@127.0.0.1
  void CUTENSOR_NAMESPACE::permutationKernelPLC3<CUTENSOR_NAMESPACE::VectorWrite2DTensorView<(unsigned char)0, (unsigned char)1, (bool)0, (unsigned int)8, float, __half, CUTENSOR_NAMESPACE::GeneralUnarySmall<float>>, CUTENSOR_NAMESPACE::VectorRead2DTensorView<(unsigned char)1, (unsigned char)0, (bool)0, (unsigned int)8, float, __half, CUTENSOR_NAMESPACE::GeneralUnarySmall<float>>, CUTENSOR_NAMESPACE::ThreadLevelElementwise<CUTENSOR_NAMESPACE::ElementwiseConfig2DCommonCase<CUTENSOR_NAMESPACE::GeneralUnarySmall<float>, CUTENSOR_NAMESPACE::GeneralBinary<float>, (int)2, (int)16, (int)128, (int)128, (signed char)8, (bool)0, (bool)0, (bool)1, (bool)0, (bool)0>, float>, CUTENSOR_NAMESPACE::ElementwiseRuntimePLC3<__half, float, __half, float>::Params>(T4) (200704, 1, 1)x(128, 1, 1), Context 1, Stream 28, Device 0, CC 9.0

    NVTX Start/End Ranges:
      <default domain>
        <0,MYPerf>
          RGB: 0xff
          REGISTERED: MYPerf

    NVTX Push/Pop Stack for Thread 156133:
     TensorRT
        <0,ExecutionContext::enqueue>
          RGB: 0xffd2691e
          REGISTERED: ExecutionContext::enqueue
        <1,Reformatting CopyNode for Input Tensor 0 to (Unnamed Layer* 0) [Convolution]>
          RGB: 0xffffd700
          REGISTERED: Reformatting CopyNode for Input Tensor 0 to (Unnamed Layer* 0) [Convolution]
    Section: Command line profiler metrics
    ---------------------------------------------------------------------- ----------- ------------
    Metric Name                                                            Metric Unit Metric Value
    ---------------------------------------------------------------------- ----------- ------------
    dram__bytes_read.sum                                                         Mbyte       822.12
    dram__bytes_write.sum                                                        Mbyte       806.54
    dram__throughput.avg.pct_of_peak_sustained_active                                %          100
    gpu__time_duration.avg                                                     usecond       724.83
    sm__inst_executed_pipe_tensor_op_hmma.avg.pct_of_peak_sustained_active           %            0
    sm__throughput.avg.pct_of_peak_sustained_active                                  %        77.27
    ---------------------------------------------------------------------- ----------- ------------

  sm90_xmma_fprop_implicit_gemm_f16f16_f16f16_f16_nhwckrsc_nhwc_tilesize128x256x64_cgasize1x2x1_warpgroupsize1x1x1_g1_beta0_execute_segment_k_off_kernel_trt (132, 1, 1)x(384, 1, 1), Context 1, Stream 28, Device 0, CC 9.0

    NVTX Start/End Ranges:
      <default domain>
        <0,MYPerf>
          RGB: 0xff
          REGISTERED: MYPerf

    NVTX Push/Pop Stack for Thread 156133:
     TensorRT
        <0,ExecutionContext::enqueue>
          RGB: 0xffd2691e
          REGISTERED: ExecutionContext::enqueue
        <1,(Unnamed Layer* 0) [Convolution]>
          RGB: 0xffffd700
          REGISTERED: (Unnamed Layer* 0) [Convolution]
    Section: Command line profiler metrics
    ---------------------------------------------------------------------- ----------- ------------
    Metric Name                                                            Metric Unit Metric Value
    ---------------------------------------------------------------------- ----------- ------------
    dram__bytes_read.sum                                                         Gbyte        14.30
    dram__bytes_write.sum                                                        Mbyte       823.37
    dram__throughput.avg.pct_of_peak_sustained_active                                %          100
    gpu__time_duration.avg                                                     msecond        17.82
    sm__inst_executed_pipe_tensor_op_hmma.avg.pct_of_peak_sustained_active           %         1.56
    sm__throughput.avg.pct_of_peak_sustained_active                                  %        99.95
    ---------------------------------------------------------------------- ----------- ------------

  void CUTENSOR_NAMESPACE::permutationKernelPLC3<CUTENSOR_NAMESPACE::VectorWrite2DTensorView<(unsigned char)0, (unsigned char)1, (bool)0, (unsigned int)8, float, __half, CUTENSOR_NAMESPACE::GeneralUnarySmall<float>>, CUTENSOR_NAMESPACE::VectorRead2DTensorView<(unsigned char)1, (unsigned char)0, (bool)0, (unsigned int)8, float, __half, CUTENSOR_NAMESPACE::GeneralUnarySmall<float>>, CUTENSOR_NAMESPACE::ThreadLevelElementwise<CUTENSOR_NAMESPACE::ElementwiseConfig2DCommonCase<CUTENSOR_NAMESPACE::GeneralUnarySmall<float>, CUTENSOR_NAMESPACE::GeneralBinary<float>, (int)2, (int)16, (int)128, (int)128, (signed char)8, (bool)0, (bool)0, (bool)1, (bool)0, (bool)0>, float>, CUTENSOR_NAMESPACE::ElementwiseRuntimePLC3<__half, float, __half, float>::Params>(T4) (200704, 1, 1)x(128, 1, 1), Context 1, Stream 28, Device 0, CC 9.0

    NVTX Start/End Ranges:
      <default domain>
        <0,MYPerf>
          RGB: 0xff
          REGISTERED: MYPerf

    NVTX Push/Pop Stack for Thread 156133:
     TensorRT
        <0,ExecutionContext::enqueue>
          RGB: 0xffd2691e
          REGISTERED: ExecutionContext::enqueue
        <1,Reformatting CopyNode for Output Tensor 0 to (Unnamed Layer* 0) [Convolution]>
          RGB: 0xffffd700
          REGISTERED: Reformatting CopyNode for Output Tensor 0 to (Unnamed Layer* 0) [Convolution]
    Section: Command line profiler metrics
    ---------------------------------------------------------------------- ----------- ------------
    Metric Name                                                            Metric Unit Metric Value
    ---------------------------------------------------------------------- ----------- ------------
    dram__bytes_read.sum                                                         Mbyte       822.35
    dram__bytes_write.sum                                                        Mbyte       806.36
    dram__throughput.avg.pct_of_peak_sustained_active                                %          100
    gpu__time_duration.avg                                                     usecond       725.22
    sm__inst_executed_pipe_tensor_op_hmma.avg.pct_of_peak_sustained_active           %            0
    sm__throughput.avg.pct_of_peak_sustained_active                                  %        77.08
    ---------------------------------------------------------------------- ----------- ------------
计算Conv2d的理论IO量
tee calculate_total_io_with_batch.py <<-'EOF'

import math
def calculate_total_io_with_batch(batch_size, H_in, W_in, C_in, H_f, W_f, C_out, S, P):
    """
    计算卷积层的总输入输出量(IO量),包含批量大小

    参数:
    - batch_size: 批量大小
    - H_in: 输入特征图的高度
    - W_in: 输入特征图的宽度
    - C_in: 输入特征图的通道数
    - H_f: 滤波器的高度
    - W_f: 滤波器的宽度
    - C_out: 输出特征图的通道数
    - S: 步长
    - P: 填充量

    返回值:
    - H_out: 输出特征图的高度
    - W_out: 输出特征图的宽度
    - IFM_IO: 输入特征图的IO量
    - OFM_IO: 输出特征图的IO量
    - Weights_IO: 权重(滤波器)的IO量
    - Total_IO: 总的IO量
    """
    # 计算输出特征图的尺寸
    H_out = math.floor((H_in - H_f + 2 * P) / S) + 1
    W_out = math.floor((W_in - W_f + 2 * P) / S) + 1

    # 计算输入特征图的 IO 量
    IFM_IO = batch_size * H_in * W_in * C_in

    # 计算输出特征图的 IO 量
    OFM_IO = batch_size * H_out * W_out * C_out

    # 计算权重(滤波器)的 IO 量
    Weights_IO = H_f * W_f * C_in * C_out

    # 计算总的 IO 量
    Total_IO = IFM_IO + OFM_IO + Weights_IO

    return H_out, W_out, IFM_IO, OFM_IO, Weights_IO, Total_IO

# 示例数据
batch_size = 4
H_in = 224  # 输入特征图的高度
W_in = 224  # 输入特征图的宽度
C_in = 2048   # 输入特征图的通道数(例如RGB图像)
H_f = 3    # 滤波器的高度
W_f = 3    # 滤波器的宽度
C_out = 2048 # 输出特征图的通道数
S = 1      # 步长
P = 1      # 填充量

# 计算卷积层的总 IO 量
H_out, W_out, IFM_IO, OFM_IO, Weights_IO, Total_IO = calculate_total_io_with_batch(batch_size,H_in, W_in, C_in, H_f, W_f, C_out, S, P)

print(f"输出特征图的高度: {H_out}")
print(f"输出特征图的宽度: {W_out}")
print(f"输入特征图的IO量: {IFM_IO}")
print(f"输出特征图的IO量: {OFM_IO}")
print(f"权重(滤波器)的IO量: {Weights_IO}")
print(f"总的IO量: {Total_IO}")
EOF

python3 calculate_total_io_with_batch.py
输出
输出特征图的高度: 224
输出特征图的宽度: 224
输入特征图的IO量: 411041792
输出特征图的IO量: 411041792
权重(滤波器)的IO量: 37748736
总的IO量: 859832320
查看IO量
ncu --nvtx  --nvtx-include "MYPerf" --target-processes all \
    --metrics dram__bytes_read.sum,dram__bytes_write.sum,lts__t_bytes.sum,l1tex__t_bytes.sum  python3 trt_conv_fp16_flops.py
输出
  sm90_xmma_fprop_implicit_gemm_f16f16_f16f16_f16_nhwckrsc_nhwc_tilesize128x256x64_cgasize1x2x1_warpgroupsize1x1x1_g1_beta0_execute_segment_k_off_kernel_trt (132, 1, 1)x(384, 1, 1), Context 1, Stream 28, Device 0, CC 9.0

    NVTX Start/End Ranges:
      <default domain>
        <0,MYPerf>
          RGB: 0xff
          REGISTERED: MYPerf

    NVTX Push/Pop Stack for Thread 158074:
     TensorRT
        <0,ExecutionContext::enqueue>
          RGB: 0xffd2691e
          REGISTERED: ExecutionContext::enqueue
        <1,(Unnamed Layer* 0) [Convolution]>
          RGB: 0xffffd700
          REGISTERED: (Unnamed Layer* 0) [Convolution]
    Section: Command line profiler metrics
    --------------------- ----------- ------------
    Metric Name           Metric Unit Metric Value
    --------------------- ----------- ------------
    dram__bytes_read.sum        Gbyte         9.57
    dram__bytes_write.sum       Mbyte       822.73
    l1tex__t_bytes.sum          Mbyte         6.93
    lts__t_bytes.sum            Gbyte       130.29
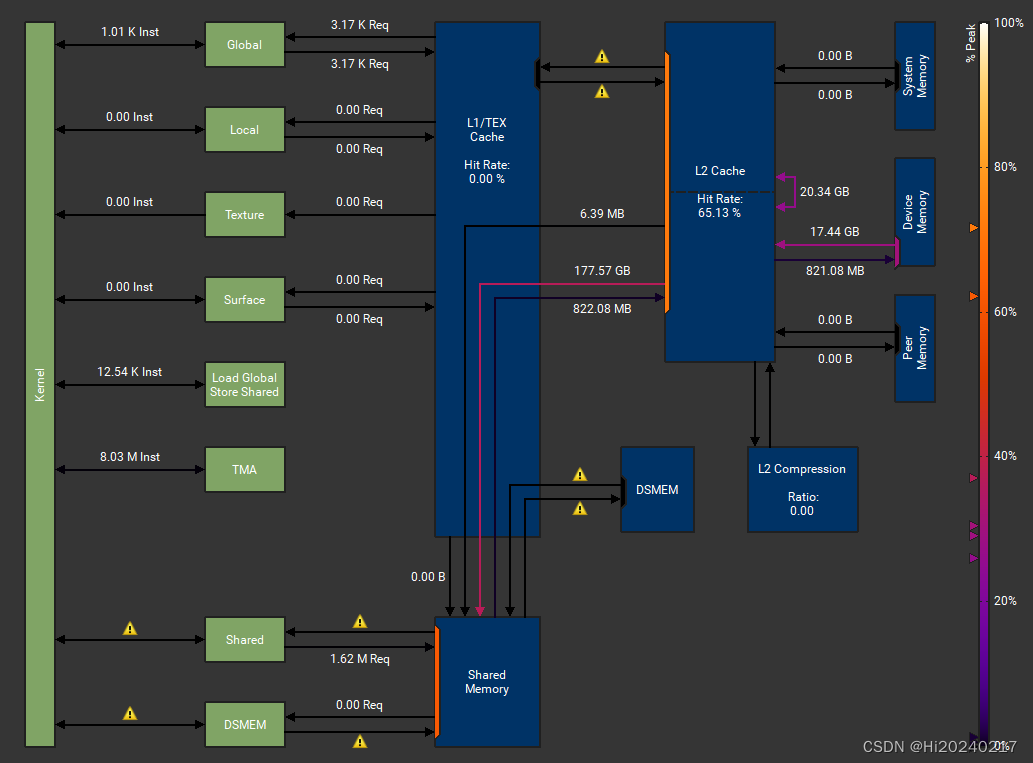
MemoryWorkloadAnalysis
ncu --nvtx --nvtx-include "MYPerf" --section "MemoryWorkloadAnalysis" --target-processes all \
--set full python3 trt_conv_fp16_flops.py
**输出**
```bash
sm90_xmma_fprop_implicit_gemm_f16f16_f16f16_f16_nhwckrsc_nhwc_tilesize128x256x64_cgasize1x2x1_warpgroupsize1x1x1_g1_beta0_execute_segment_k_off_kernel_trt (132, 1, 1)x(384, 1, 1), Context 1, Stream 28, Device 0, CC 9.0
NVTX Start/End Ranges:
<default domain>
<0,MYPerf>
RGB: 0xff
REGISTERED: MYPerf
NVTX Push/Pop Stack for Thread 157131:
TensorRT
<0,ExecutionContext::enqueue>
RGB: 0xffd2691e
REGISTERED: ExecutionContext::enqueue
<1,(Unnamed Layer* 0) [Convolution]>
RGB: 0xffffd700
REGISTERED: (Unnamed Layer* 0) [Convolution]
Section: GPU Speed Of Light Throughput
----------------------- ------------- ------------
Metric Name Metric Unit Metric Value
----------------------- ------------- ------------
DRAM Frequency cycle/nsecond 2.62
SM Frequency cycle/nsecond 1.59
Elapsed Cycles cycle 28327488
Memory Throughput % 69.86
DRAM Throughput % 30.83
Duration msecond 17.82
L1/TEX Cache Throughput % 62.85
L2 Cache Throughput % 69.33
SM Active Cycles cycle 28038376.39
Compute (SM) Throughput % 99.05
----------------------- ------------- ------------
INF The kernel is utilizing greater than 80.0% of the available compute or memory performance of the device. To
further improve performance, work will likely need to be shifted from the most utilized to another unit.
Start by analyzing workloads in the Compute Workload Analysis section.
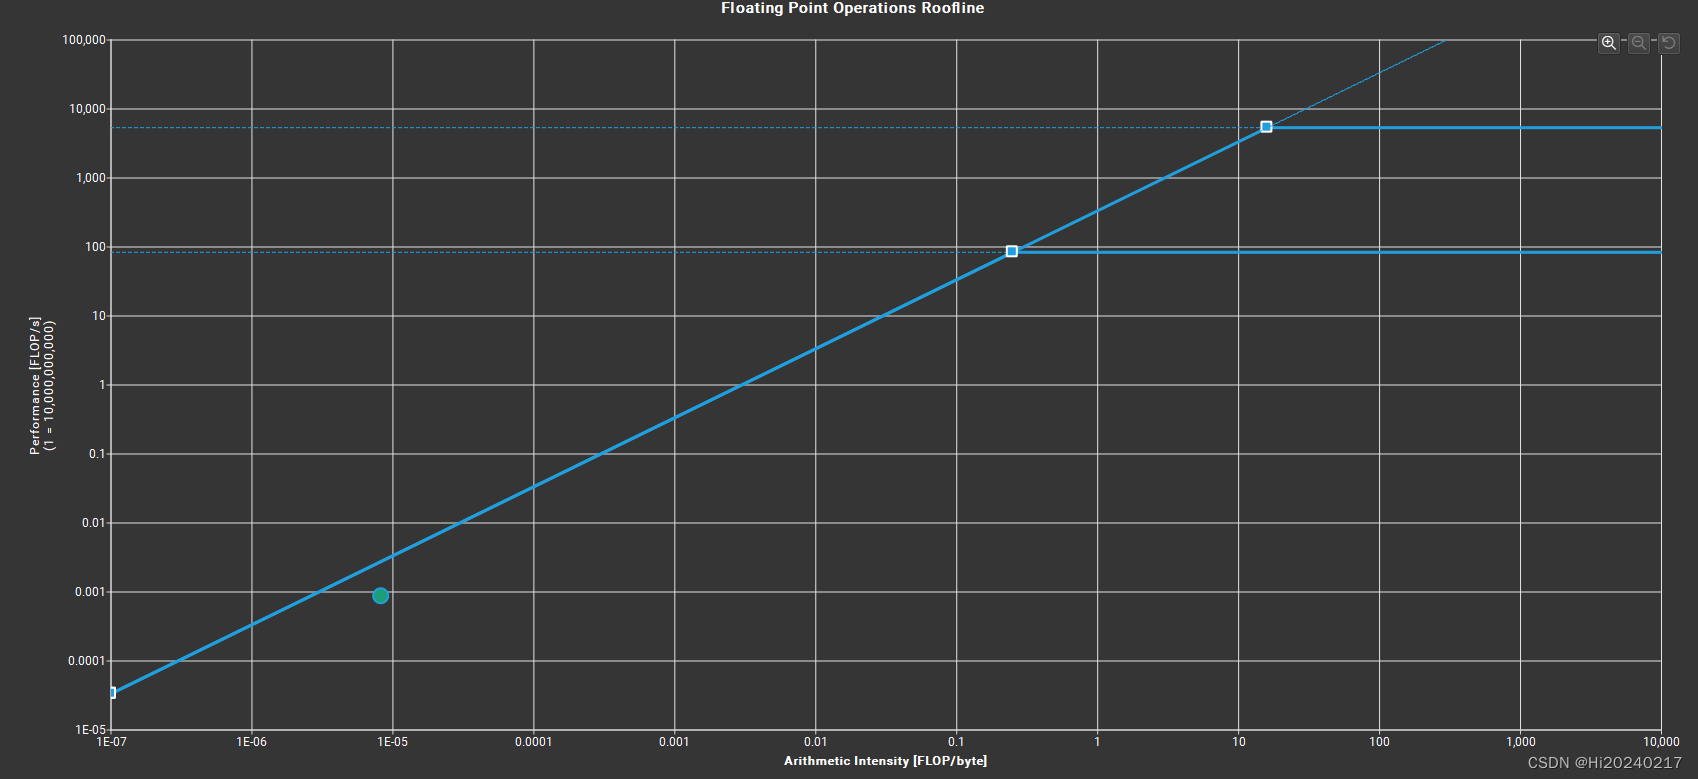
Section: GPU Speed Of Light Roofline Chart
INF The ratio of peak float (fp32) to double (fp64) performance on this device is 64:1. The kernel achieved
close to 0% of this device's fp32 peak performance and 0% of its fp64 peak performance. See the Kernel
Profiling Guide (https://docs.nvidia.com/nsight-compute/ProfilingGuide/index.html#roofline) for more details
on roofline analysis.
Section: Compute Workload Analysis
-------------------- ----------- ------------
Metric Name Metric Unit Metric Value
-------------------- ----------- ------------
Executed Ipc Active inst/cycle 0.46
Executed Ipc Elapsed inst/cycle 0.45
Issue Slots Busy % 11.42
Issued Ipc Active inst/cycle 0.46
SM Busy % 99.95
-------------------- ----------- ------------
WRN Tensor is the highest-utilized pipeline (100.0%) based on active cycles, taking into account the rates of its
different instructions. It is the logical aggregation of individual tensor pipelines. It's dominated by its
Tensor (FP) sub-pipeline. The pipeline is over-utilized and likely a performance bottleneck. Based on the
number of executed instructions, the highest utilized pipeline (10.4%) is Uniform. Comparing the two, the
overall pipeline utilization appears to be caused by high-latency instructions. See the Kernel Profiling
Guide (https://docs.nvidia.com/nsight-compute/ProfilingGuide/index.html#metrics-decoder) or hover over the
pipeline name to understand the workloads handled by each pipeline. The Instruction Statistics section shows
the mix of executed instructions in this kernel. Check the Warp State Statistics section for which reasons
cause warps to stall.
Section: Memory Workload Analysis
--------------------------- ------------ ------------
Metric Name Metric Unit Metric Value
--------------------------- ------------ ------------
Memory Throughput Tbyte/second 1.03
Mem Busy % 62.28
Max Bandwidth % 69.86
L1/TEX Hit Rate % 0
L2 Compression Success Rate % 0
L2 Compression Ratio 0
L2 Hit Rate % 68.07
Mem Pipes Busy % 52.63
--------------------------- ------------ ------------
Section: Memory Workload Analysis Tables
OPT Estimated Speedup: 0.0001318%
The memory access pattern for global loads in L1TEX might not be optimal. On average, this kernel accesses
10.2 bytes per thread per memory request; but the address pattern, possibly caused by the stride between
threads, results in 16.0 sectors per request, or 16.0*32 = 512.0 bytes of cache data transfers per request.
The optimal thread address pattern for 10.2 byte accesses would result in 10.2*32 = 325.7 bytes of cache
data transfers per request, to maximize L1TEX cache performance. Check the Source Counters section for
uncoalesced global loads.
----- --------------------------------------------------------------------------------------------------------------
OPT Estimated Speedup: 15.28%
The memory access pattern for shared stores might not be optimal and causes on average a 2204.7 - way bank
conflict across all 12808 shared store requests.This results in 4354493 bank conflicts, which represent
15.42% of the overall 28238369 wavefronts for shared stores. Check the Source Counters section for
uncoalesced shared stores.
Section: Scheduler Statistics
---------------------------- ----------- ------------
Metric Name Metric Unit Metric Value
---------------------------- ----------- ------------
One or More Eligible % 11.42
Issued Warp Per Scheduler 0.11
No Eligible % 88.58
Active Warps Per Scheduler warp 2.98
Eligible Warps Per Scheduler warp 0.12
---------------------------- ----------- ------------
OPT Estimated Speedup: 88.58%
Every scheduler is capable of issuing one instruction per cycle, but for this kernel each scheduler only
issues an instruction every 8.8 cycles. This might leave hardware resources underutilized and may lead to
less optimal performance. Out of the maximum of 16 warps per scheduler, this kernel allocates an average of
2.98 active warps per scheduler, but only an average of 0.12 warps were eligible per cycle. Eligible warps
are the subset of active warps that are ready to issue their next instruction. Every cycle with no eligible
warp results in no instruction being issued and the issue slot remains unused. To increase the number of
eligible warps, avoid possible load imbalances due to highly different execution durations per warp.
Reducing stalls indicated on the Warp State Statistics and Source Counters sections can help, too.
----- --------------------------------------------------------------------------------------------------------------
OPT Estimated Speedup: 81.25%
The 3.00 theoretical warps per scheduler this kernel can issue according to its occupancy are below the
hardware maximum of 16. Use the Occupancy section to identify what limits this kernel's theoretical
occupancy.
Section: Warp State Statistics
---------------------------------------- ----------- ------------
Metric Name Metric Unit Metric Value
---------------------------------------- ----------- ------------
Warp Cycles Per Issued Instruction cycle 26.12
Warp Cycles Per Executed Instruction cycle 26.15
Avg. Active Threads Per Warp 32.00
Avg. Not Predicated Off Threads Per Warp 29.71
---------------------------------------- ----------- ------------
OPT Estimated Speedup: 55.36%
On average, each warp of this kernel spends 14.5 cycles being stalled waiting for sibling warps at a CTA
barrier. A high number of warps waiting at a barrier is commonly caused by diverging code paths before a
barrier. This causes some warps to wait a long time until other warps reach the synchronization point.
Whenever possible, try to divide up the work into blocks of uniform workloads. If the block size is 512
threads or greater, consider splitting it into smaller groups. This can increase eligible warps without
affecting occupancy, unless shared memory becomes a new occupancy limiter. Also, try to identify which
barrier instruction causes the most stalls, and optimize the code executed before that synchronization point
first. This stall type represents about 55.4% of the total average of 26.1 cycles between issuing two
instructions.
----- --------------------------------------------------------------------------------------------------------------
OPT Estimated Speedup: 32.04%
On average, each warp of this kernel spends 8.4 cycles being stalled waiting for a scoreboard dependency on a
L1TEX (local, global, surface, texture) operation. Find the instruction producing the data being waited upon
to identify the culprit. To reduce the number of cycles waiting on L1TEX data accesses verify the memory
access patterns are optimal for the target architecture, attempt to increase cache hit rates by increasing
data locality (coalescing), or by changing the cache configuration. Consider moving frequently used data to
shared memory. This stall type represents about 32.0% of the total average of 26.1 cycles between issuing
two instructions.
----- --------------------------------------------------------------------------------------------------------------
INF Check the Warp Stall Sampling (All Samples) table for the top stall locations in your source based on
sampling data. The Kernel Profiling Guide
(https://docs.nvidia.com/nsight-compute/ProfilingGuide/index.html#metrics-reference) provides more details
on each stall reason.
Section: Instruction Statistics
---------------------------------------- ----------- ------------
Metric Name Metric Unit Metric Value
---------------------------------------- ----------- ------------
Avg. Executed Instructions Per Scheduler inst 3197298.22
Executed Instructions inst 1688173458
Avg. Issued Instructions Per Scheduler inst 3200871.78
Issued Instructions inst 1690060299
---------------------------------------- ----------- ------------
OPT Estimated Speedup: 50%
This kernel executes 0 fused and 4752 non-fused FP32 instructions. By converting pairs of non-fused
instructions to their fused (https://docs.nvidia.com/cuda/floating-point/#cuda-and-floating-point),
higher-throughput equivalent, the achieved FP32 performance could be increased by up to 50% (relative to its
current performance). Check the Source page to identify where this kernel executes FP32 instructions.
Section: Launch Statistics
-------------------------------- --------------- ---------------
Metric Name Metric Unit Metric Value
-------------------------------- --------------- ---------------
Block Size 384
Cluster Scheduling Policy PolicySpread
Cluster Size 2
Function Cache Configuration CachePreferNone
Grid Size 132
Registers Per Thread register/thread 168
Shared Memory Configuration Size Kbyte 233.47
Driver Shared Memory Per Block Kbyte/block 1.02
Dynamic Shared Memory Per Block Kbyte/block 231.42
Static Shared Memory Per Block byte/block 0
Threads thread 50688
Waves Per SM 1
-------------------------------- --------------- ---------------
OPT If you execute __syncthreads() to synchronize the threads of a block, it is recommended to have more than the
achieved 1 blocks per multiprocessor. This way, blocks that aren't waiting for __syncthreads() can keep the
hardware busy.
Section: Occupancy
------------------------------- ----------- ------------
Metric Name Metric Unit Metric Value
------------------------------- ----------- ------------
Max Active Clusters cluster 66
Max Cluster Size block 16
Overall GPU Occupancy % 0.59
Cluster Occupancy % 3.12
Block Limit SM block 32
Block Limit Registers block 1
Block Limit Shared Mem block 1
Block Limit Warps block 5
Theoretical Active Warps per SM warp 12
Theoretical Occupancy % 18.75
Achieved Occupancy % 18.63
Achieved Active Warps Per SM warp 11.93
------------------------------- ----------- ------------
OPT This kernel's theoretical occupancy (18.8%) is limited by the number of required registers. This kernel's
theoretical occupancy (18.8%) is limited by the required amount of shared memory. See the CUDA Best
Practices Guide (https://docs.nvidia.com/cuda/cuda-c-best-practices-guide/index.html#occupancy) for more
details on optimizing occupancy.
Section: Source Counters
------------------------- ----------- ------------
Metric Name Metric Unit Metric Value
------------------------- ----------- ------------
Branch Instructions Ratio % 0.03
Branch Instructions inst 46310987
Branch Efficiency % 99.94
Avg. Divergent Branches 54.77
------------------------- ----------- ------------


 3万+
3万+

 被折叠的 条评论
为什么被折叠?
被折叠的 条评论
为什么被折叠?
 到【灌水乐园】发言


