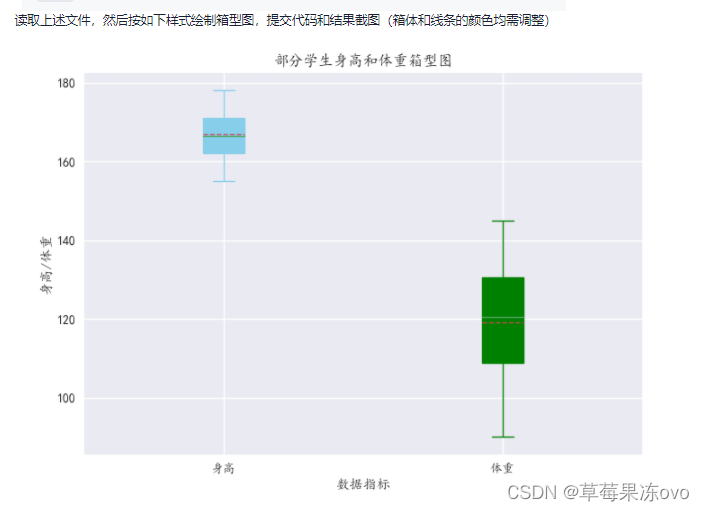
代码如下:
import pandas as pd
import  matplotlib.pyplot as plt
df=pd.read_csv('xs413.csv',delimiter=',')
plt.style.use('seaborn')
plt.rcParams['font.family']='simhei'
color=['plum']
colors=['hotpink']
df1=plt.boxplot(df.sg,patch_artist=True,vert=1,positions=[2],meanline=True,showmeans=True,
capprops={'color':'plum'},whiskerprops={'color':'plum'},labels=['身高'])
df2=plt.boxplot(df.tz,patch_artist=True,vert=1,positions=[3],meanline=True,showmeans=True,
capprops={'color':'hotpink'},whiskerprops={'color':'hotpink'},labels=['体重'])
for box,c in zip(df1['boxes'],color):
    box.set(color=c,linewidth=2)
    box.set(facecolor=c)
for box,c in zip(df2['boxes'],colors):
    box.set(color=c,linewidth=2)
    box.set(facecolor=c)
plt.title('部分学生身高和体重箱型图')
plt.xlabel('数据指标')
plt.ylabel('身高/体重')
plt.show()


 3万+
3万+


 被折叠的 条评论
为什么被折叠?
被折叠的 条评论
为什么被折叠?
 到【灌水乐园】发言


