


🤵♂️ 个人主页:@艾派森的个人主页
✍🏻作者简介:Python学习者
🐋 希望大家多多支持,我们一起进步!😄
如果文章对你有帮助的话,
欢迎评论 💬点赞👍🏻 收藏 📂加关注+
目录
1.项目背景
随着视频流媒体服务的兴起和发展,如Netflix、Hulu、Amazon Prime等,人们对电影和电视节目的需求和观看习惯发生了变化。Netflix作为全球最大的视频流媒体服务提供商之一,拥有庞大的电影和电视节目库,涵盖了各种不同类型和风格的内容。
对Netflix的电影和电视节目数据集进行可视化分析,不仅可以帮助我们更深入地了解Netflix平台上的内容分布、受众偏好和趋势,还可以为内容创作、推荐系统优化以及市场营销策略提供重要的参考和决策支持。
具体而言,通过对Netflix数据集的可视化分析,可以探索以下方面:
-
内容类型分布: 分析Netflix平台上电影和电视节目的类型分布情况,了解哪些类型的内容更受欢迎,以及不同类型之间的数量和比例。
-
上线时间分析: 探索Netflix上不同年份和季度上线的电影和电视节目数量和趋势变化,分析新内容的增长速度和趋势。
-
评分和受欢迎程度: 分析Netflix内容的评分分布情况,了解受欢迎程度高的电影和电视节目特征,以及用户对不同类型内容的评价偏好。
-
国家/地区分布: 研究Netflix内容的国家/地区分布情况,了解不同国家/地区内容的数量和类型,以及可能存在的地域特色和差异。
-
内容时长分析: 分析Netflix电影和电视节目的时长分布情况,了解用户对不同时长内容的偏好和观看习惯。
通过以上分析,可以为Netflix及其他视频流媒体服务提供商提供有益的洞察,帮助他们更好地理解用户需求,优化内容选择和推荐系统,提升用户体验,增强竞争力。因此,对Netflix电影和电视节目数据集进行可视化分析具有重要的研究意义和实际应用价值。
2.数据集介绍
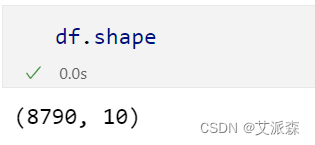
本数据集来源于Kaggle,是 Netflix 电影和电视节目数据集,原始数据集共有8790条,10个变量,各变量含义如下:
show_id:展出ID
type:内容(电视节目或电影)
title:标题
director:节目或电影的导演
country:节目或电影的国家/地区
date_added:添加到 Netflix 的日期
release_year:内容发布年份
rating:评级或限制
duration:内容持续时间
listed_in:内容类型
3.技术工具
Python版本:3.9
代码编辑器:jupyter notebook
4.导入数据
导入第三方库并加载数据集
import numpy as np
import pandas as pd
import matplotlib.pyplot as plt
import seaborn as sns

df = pd.read_csv("netflix.csv")
df.head()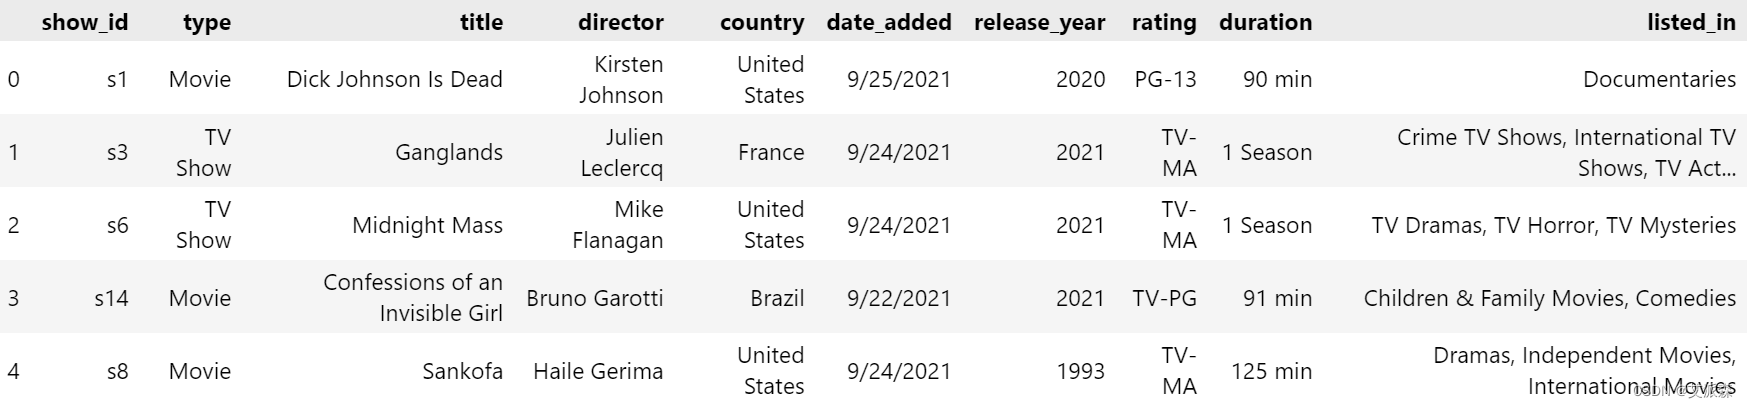
查看数据大小
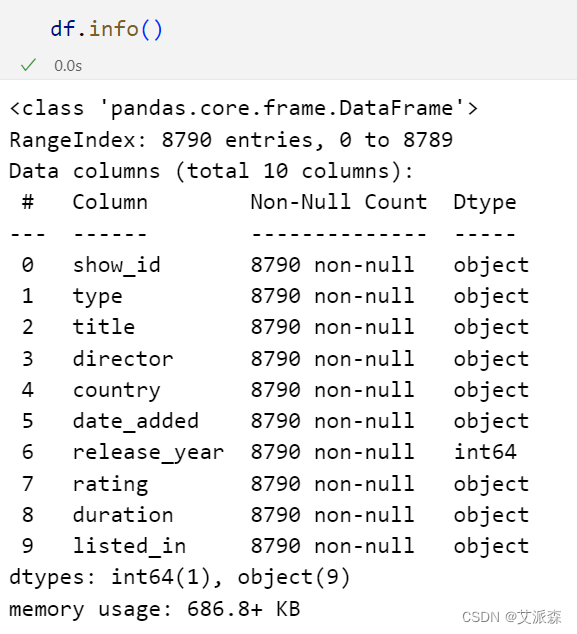
查看数据基本信息
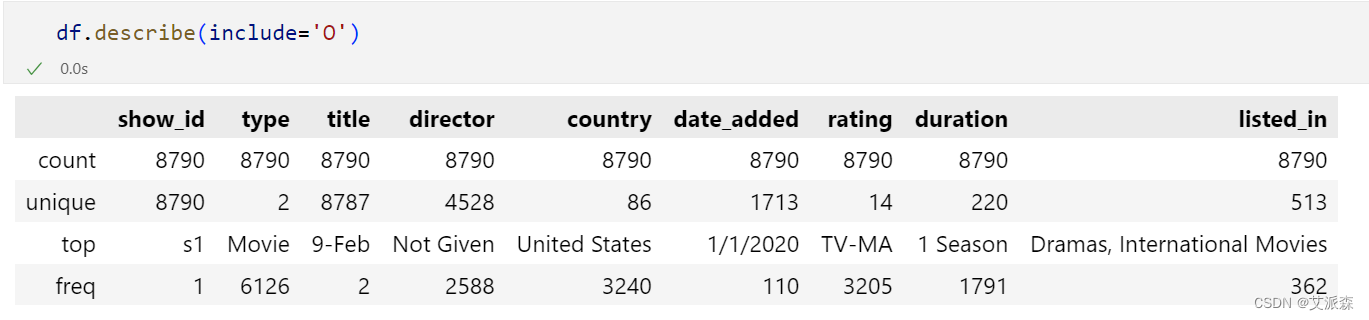
查看数据描述性统计
删除ID列

5.数据可视化
df["type"].value_counts().plot.pie(figsize=(12,8),explode=(0.1,0.01),autopct="%1.1f%%")
plt.title("Distribution of Netflix Content Types",fontsize=20)
plt.show()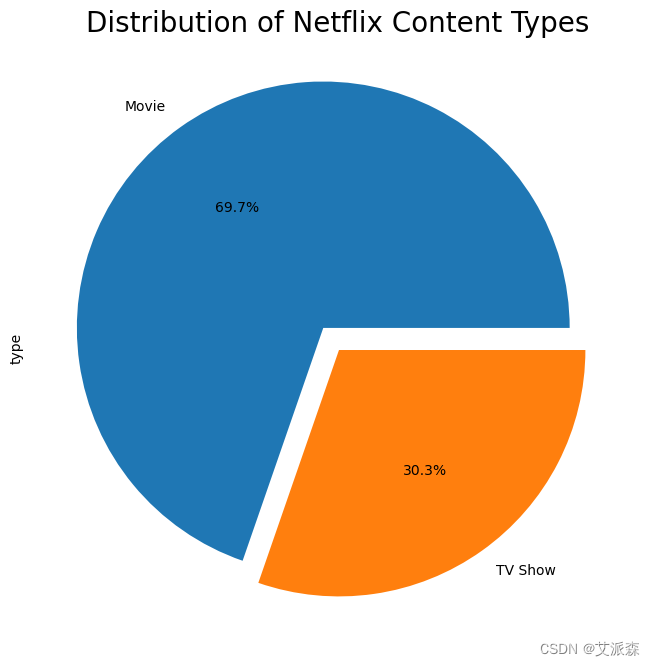
category_counts = df["title"].value_counts()
top_categories = category_counts.head(10)
category_counts = df["title"].value_counts()
top_categories = category_counts.head(10)
plt.figure(figsize=(12, 8))
palette = sns.color_palette("Set2")
sns.countplot(x=df[df["title"].isin(top_categories.index)]["title"], palette=palette)
plt.xticks(rotation=45, ha="right")
plt.title("Top 10 title on netflix",fontsize=20)
plt.show()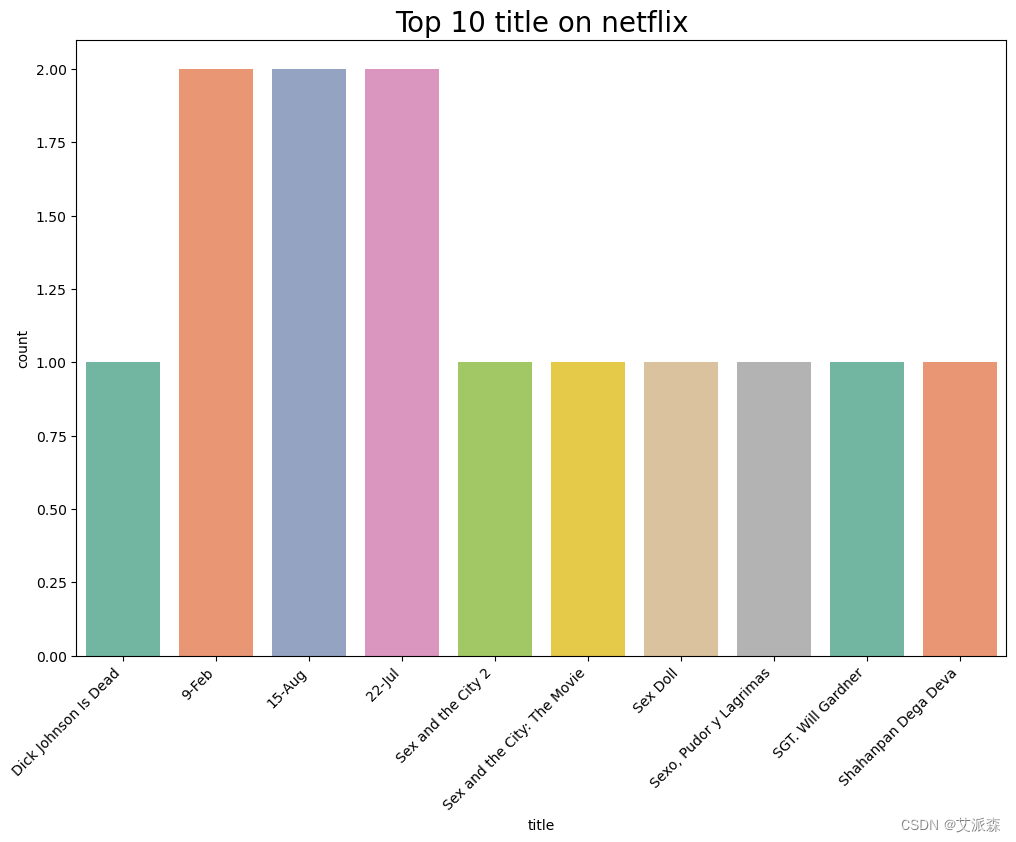
category_counts = df["director"].value_counts()[1:10]
top_categories = category_counts.head(10)
plt.figure(figsize=(12, 8))
palette = sns.color_palette("Set2")
sns.countplot(x=df[df["director"].isin(top_categories.index)]["director"], palette=palette)
plt.xticks(rotation=45, ha="right")
plt.title("The 10 most recurring directors on Netflix ",fontsize=20)
plt.show()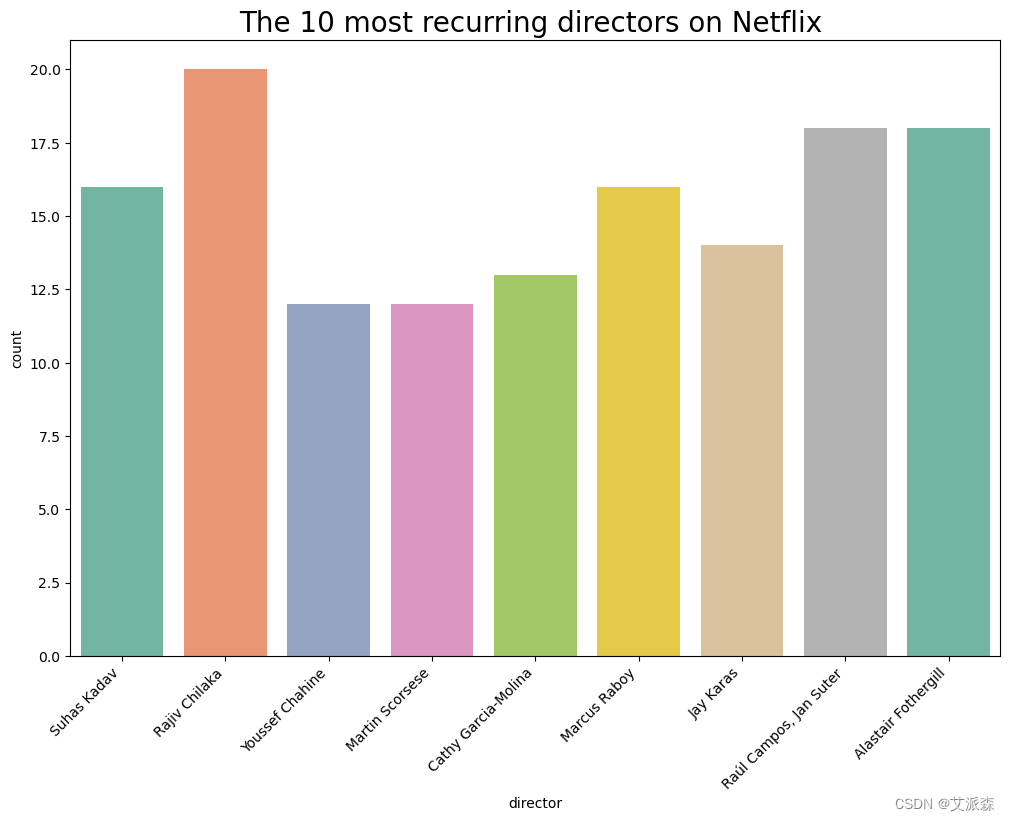
import folium
from folium.plugins import HeatMap
import pandas as pd

new_data = {'Country': ['United States', 'India', 'United Kingdom', 'Pakistan', 'Not Given', 'Canada', 'Japan', 'South Korea', 'France',
                    'Spain', 'Mexico', 'Egypt', 'Australia', 'Turkey', 'Nigeria', 'Germany', 'China', 'Brazil', 'Taiwan'],
        'Count': [3240, 1057, 638, 421, 287, 271, 259, 214, 213, 182, 138, 123, 114, 112, 105, 104, 100, 88, 86],
        'Latitude': [37.0902, 20.5937, 51.5099, 30.3753, 0, 56.1304, 36.2048, 35.9078, 46.6035, 40.4637, 23.6345, 26.8206, -25.2744, 38.9637, 9.0820, 51.1657, 35.8617, -14.2350, 23.6978],
        'Longitude': [-95.7129, 78.9629, -0.1180, 69.3451, 0, -106.3468, 138.2529, 127.7669, 1.8883, -3.7492, -102.5528, 30.8028, 133.7751, 35.2433, 8.6753, 10.4515, 104.1954, -51.9253, 120.9605]}

new_df = pd.DataFrame(new_data)

df = pd.concat([df, new_df], ignore_index=True)


world_map = folium.Map(location=[20, 0], zoom_start=2)

heat_data = [[point['Latitude'], point['Longitude'], point['Count']] for index, point in df.iterrows()]
HeatMap(heat_data).add_to(world_map)
world_map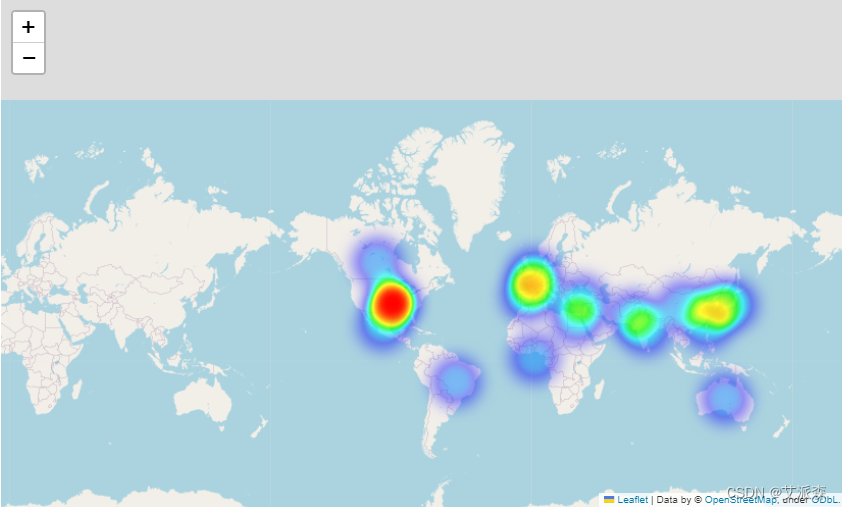
countries =  ['United States', 'India', 'United Kingdom', 'Pakistan', 'Not Given', 'Canada', 'Japan', 'South Korea', 'France',
                    'Spain', 'Mexico', 'Egypt', 'Australia', 'Turkey', 'Nigeria', 'Germany', 'China', 'Brazil', 'Taiwan']
viewing_activity= [3240, 1057, 638, 421, 287, 271, 259, 214, 213, 182, 138, 123, 114, 112, 105, 104, 100, 88, 86]

plt.figure(figsize=(10, 6))
palette = sns.color_palette("Set2")
plt.barh(countries, viewing_activity, color=palette)
plt.xlabel('viewing_activity')
plt.title('"Geographic distribution of viewing activity on the Netflix platform by country"')
plt.show()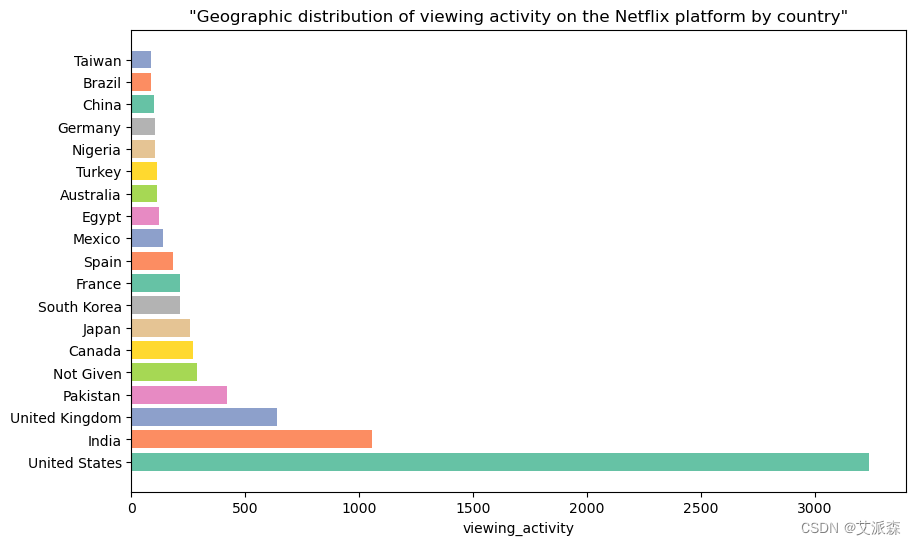
df["rating"].value_counts()[0:8].plot.pie(figsize=(12,8),explode=(0.1,0.01,0.01,0.01,0.01,0.01,0.01,0.01),autopct="%1.1f%%")
plt.title("Rating for TV show",fontsize=20)
plt.show()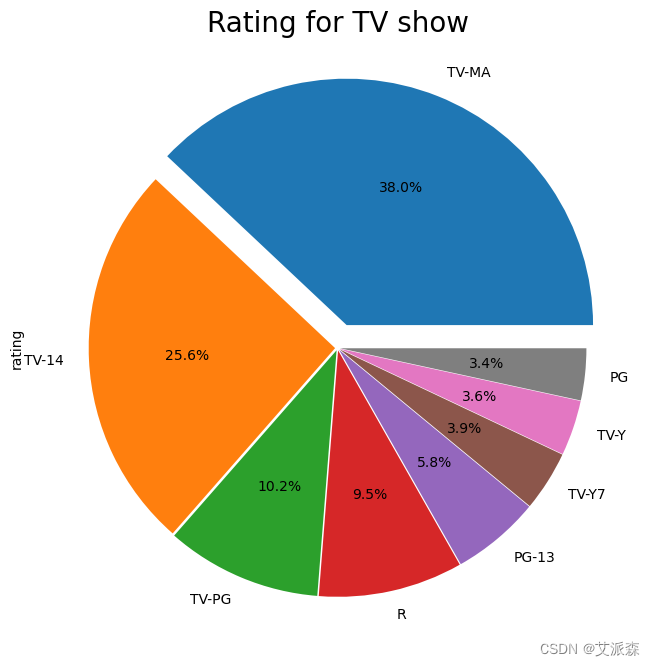
plt.figure(figsize=(15, 8))

sns.lineplot(x=df['release_year'].value_counts().head(15).index,
             y=df['release_year'].value_counts().head(15).values,
             alpha=1, color="r")

for i, txt in enumerate(df['release_year'].value_counts().head(15).index):
    plt.annotate(txt, (df['release_year'].value_counts().head(15).index[i],
                       df['release_year'].value_counts().head(15).values[i]),
                 textcoords="offset points", xytext=(0, 5), ha='center', fontsize=9)

plt.title('Contents Added Through Different Years', fontsize=14, fontweight='heavy')
plt.show()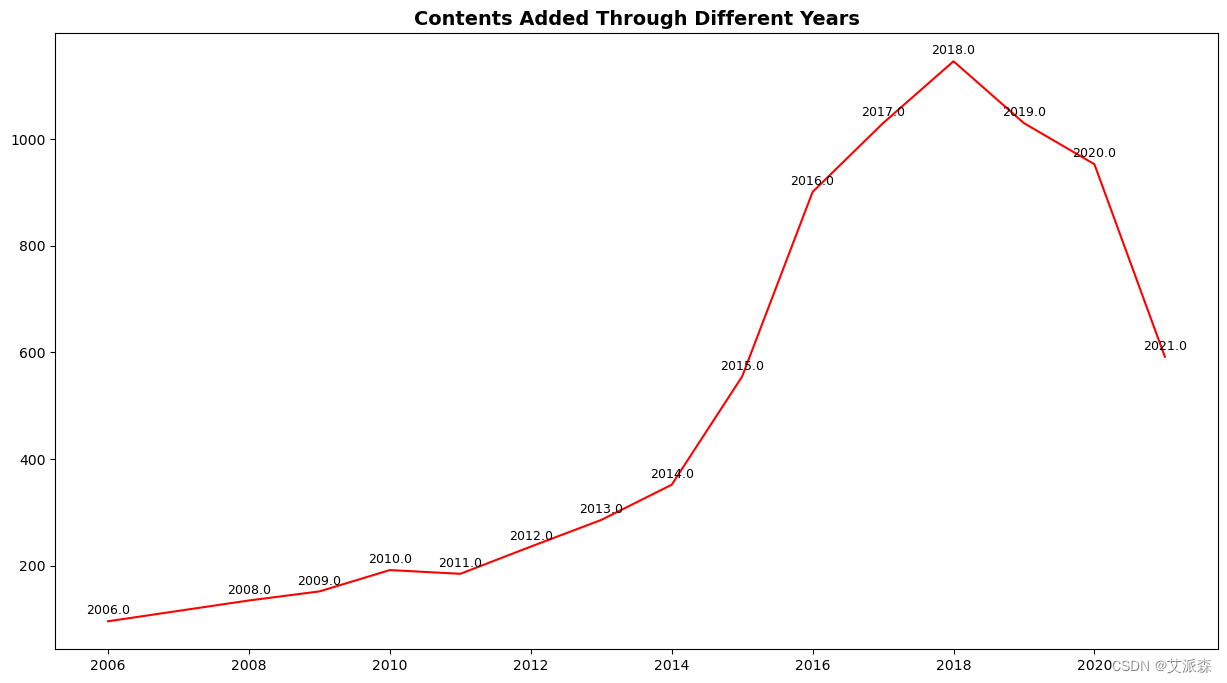
6.总结
1 .内容多样性:数据显示,Netflix提供广泛多样的娱乐内容,包括电影和电视节目。这种多样性迎合了Netflix用户寻求全面娱乐体验的兴趣。
2 .全球制作:数据表明,Netflix是一个真正的国际平台,其内容在美国、印度、英国、巴基斯坦和其他国家制作,反映了该服务的地理多样性。
3 .与导演合作:Netflix很注重与才华横溢、多元化的导演合作,拉吉夫·奇拉卡(Rajiv Chilaka)和阿拉斯泰尔·福瑟吉尔(Alastair Fothergill)等人都是最优秀的导演。
4 .逐年增加的内容:Netflix每年增加的内容反映了对观众期望的响应。近年来产量的增加表明满足日益增长的需求的战略取得了成功。
5 .节目收视率:TV-MA和TV-14等流行收视率的主导地位表明Netflix对适合不同年龄群体和兴趣的内容的控制。
6 .全球影响力:数据显示了Netflix的全球影响力,大量的作品来自不同的国家,满足了国际观众的偏好。
7 .年度内容演变:近年来内容生产的增长表明Netflix致力于不断发展和适应不断变化的观众偏好和需求。
总体影响:Netflix在过去几十年的成功是显而易见的,最近内容添加的激增是该服务持续成功的积极指标。
文末推荐与福利
《商业分析思维与实践:用数据分析解决商业问题》免费包邮送出3本!

内容简介:
本书以业务为导向,详细地讲解了如何通过大数据分析来解决商业问题。其目的在于运用大数据分析思维,帮助读者把学术知识应用于真实的业务场景,解决实际的业务问题。
本书基于业务问题,就如何搭建分析框架,厘清分析思路,按照标准分析步骤对数据进行恰当的预处理,选择合适的分析方法和分析模型,使用恰当的分析工具对数据进行分析,以及对分析结果进行可视化和符合业务要求的解读等内容展开讲解,帮助业务专家做出合适的业务判断,制定准确的业务策略。
本书既可作为各行各业的一线业务在线人员、业务决策人员、数据分析人员、企业管理人员的学习用书,也可以作为广大本科院校、高职高专院校的大数据相关专业的教材用书,还可作为从事大数据分析与应用培训的参考教材。
编辑推荐:
1.重思路:数据思维+分析框架,深入数据分析解决商业问题的底层逻辑
2.重体系:分析过程+分析阶段,全流程、立体化解析大数据时代商业分析核心方法论
3.重实战:分析方法+分析模型+分析工具,快速上手发现业务规律、解决实际问题
4.重落地:可视化+数据解读+业务策略,实现商业数据分析与业务需求完美融合
5.赠送资源:免费赠送全书案例源文件,供读者下载学习。
- 抽奖方式:评论区随机抽取3位小伙伴免费送出!
- 参与方式:关注博主、点赞、收藏、评论区评论“人生苦短,拒绝内卷!”(切记要点赞+收藏,否则抽奖无效,每个人最多评论三次!)
- 活动截止时间:2024-3-15 20:00:00
名单公布时间:2024-3-15 21:00:00

资料获取,更多粉丝福利,关注下方公众号获取


 2万+
2万+

 被折叠的 条评论
为什么被折叠?
被折叠的 条评论
为什么被折叠?
 到【灌水乐园】发言


